

Just learning Power BI? Start with our list of free Power BI dashboard templates (official Microsoft samples), then come back here for an industry-ready report.
Key Features of the 10 Power BI Dashboard Templates
| Rank | Best industry or team | Power BI template | Best decision supported | Price |
|---|---|---|---|---|
| 1 | Manufacturing | Manufacturing Efficiency Dashboard | Improve OEE, uptime, throughput, and cost per unit | $17.99 |
| 2 | Finance and treasury | Treasury Management Dashboard | Control liquidity, exposure, counterparty risk, and interest rates | $17.99 |
| 3 | Healthcare | Medical Practice Dashboard | Balance patient experience, capacity, revenue, and waiting time | $17.99 |
| 4 | Human resources | HR Analytics Dashboard | Connect headcount, attrition, recruitment, engagement, and training | $17.99 |
| 5 | Energy and facilities | Energy Consumption Analysis Dashboard | Find consumption, cost, emissions, and efficiency hotspots | $17.99 |
| 6 | Supply chain | Supply Chain Management Dashboard | Compare fulfillment, returns, suppliers, and warehouses | $17.99 |
| 7 | Startups | Startup Burn Rate Dashboard | Monitor burn, runway, budget variance, MRR, and churn | $17.99 |
| 8 | ESG and sustainability | ESG Environmental Dashboard | Track emissions, water, energy, waste, and compliance | $17.99 |
| 9 | Sales | Sales Dashboard | Protect margin while comparing product, channel, region, and trend | $17.99 |
| 10 | Digital marketing | Digital Marketing Campaign Dashboard | Allocate spend using revenue, leads, conversions, and ROI | $17.99 |
 Launch offer
From your first Pivot Table to the Data Model, DAX, Power Query and a one-page KPI dashboard. 11h 51m of video by PK, with practice files, quizzes and a capstone.
Dashboard Pages and Ranking Method
The strongest Power BI business analytics templates do more than display KPI cards. They connect an executive overview to diagnostic pages that explain why performance changed. Across this list, the recurring pattern is a five-page Power BI report: an overview, two or three domain-specific analyses, and a trend or operational review. Slicers then let users narrow the same model by month, department, facility, product, region, supplier, or other business dimension.Power BI dashboard templateWe ranked templates higher when the documented metrics form a complete decision chain. Manufacturing leads because OEE, downtime, utilization, throughput, and cost link directly to plant action. Treasury follows because liquidity, bank exposure, counterparty concentration, and rates give finance teams both performance and risk visibility. Specialized reports still rank highly when their pages cover the workflow cleanly.Power BI dashboard templatePower BI Dashboard Templates vs. Tableau vs. Paid Industry SaaS – Feature Comparison
| Criterion | These Power BI templates | Tableau alternative | Paid industry SaaS |
|---|---|---|---|
| Starting cost | $17.99 one-time per template | Build or marketplace cost varies | Recurring subscription or quote |
| Platform | Power BI Desktop / Service | Tableau Desktop / Cloud | Vendor application |
| Setup time | Replace sample data and map fields | Usually build or adapt a workbook | Implementation and configuration |
| Collaboration | Publish through Power BI Service | Publish through Tableau | Usually built in |
| Mobile access | Available after service publishing | Available after publishing | Vendor dependent |
| Custom fields and visuals | Editable PBIX model and visuals | Editable workbook | Often configuration-limited |
| Share with a link | Requires appropriate Microsoft sharing setup | Requires appropriate Tableau sharing setup | Usually account based |
| Year-1 cost at 5 users | $17.99 template plus any Microsoft licenses | Template/build plus vendor licenses | Vendor quote or subscription |
| Industry KPI starting point | Prebuilt and documented | Depends on chosen workbook | Usually preconfigured |
Building finance reporting specifically? Our CFO dashboard stack of 10 Excel, Sheets and Power BI templates shows which Power BI report to pair with Excel forecasting.
Who Should Use These Templates
These templates suit analysts, managers, consultants, and small-to-midsize teams that already use Power BI and have structured source data. They are especially useful when leadership needs a working report faster than a from-scratch build. They are not replacements for an ERP, EHR, HRIS, treasury management system, or marketing automation platform. If you need transactional data entry, approval workflows, regulatory controls, or fully managed integrations, use the operational system first and treat Power BI as the reporting layer.Power BI dashboard templateGarment factories and fashion labels can find industry-specific picks in our list of the 8 best apparel manufacturing dashboard and fashion brand templates, in Power BI, Excel and Google Sheets.
Real-World Use Cases
- Maya, a plant manager: reviews OEE and downtime by machine before the daily production meeting, then assigns maintenance attention to the largest recurring loss.
- Daniel, a finance controller: consolidates bank, loan, and counterparty data for a weekly liquidity and exposure review with the CFO.
- Priya, an HR business partner: filters attrition, engagement, and recruitment metrics by department to prepare a targeted retention discussion.
Advantages of Industry-Specific Power BI Templates
The main advantage is decision-ready structure. Instead of starting with a blank canvas, buyers get relevant KPIs, page layouts, slicers, and visual relationships. The PBIX format remains editable, Power BI Desktop is a free authoring download from Microsoft, and each template is a one-time NextGenTemplates purchase rather than a per-seat subscription.Opportunities for Improvement
Every template still requires data preparation. Field names, date tables, refresh credentials, and organization-specific KPI definitions may need adjustment. Buyers should also plan security roles, mobile layouts, accessibility, and service licensing before broad distribution. A polished template accelerates report design; it does not remove data governance work.For manufacturing lines, pair these dashboards with the right KPIs — see the 10 OEE & downtime metrics to track, with OEE calculation Excel formulas and benchmark ranges for each.
Best Practices
- Define each KPI, owner, calculation, and refresh cadence before replacing the sample data.
- Test one reporting period first and reconcile totals against the source system.
- Keep a clean staging table so Power Query transformations remain repeatable.
- Use slicers for questions users ask repeatedly; avoid adding filters without a decision purpose.
- Validate row-level security and sharing permissions before publishing to a workspace.
For utilities specifically, see our roundup of the best utilities dashboard templates, which ranks water utilities, water supply KPI and electricity distribution dashboards in Power BI, Excel and Google Sheets.
For software and subscription companies, see our ranked list of SaaS dashboard templates for subscription businesses, with Power BI versions of the SaaS Metrics and SaaS Financial Model dashboards.
Explore Relevant Templates
Working in energy? See our ranked oil and gas dashboard templates for 2026, including Power BI reports for capacity utilisation and profit margin by country.
Working in a specific vertical? See our ranked insurance agency dashboard templates for policy, premium and claims reporting in Excel, Google Sheets and Power BI.
Running a furniture or home decor business? See our ranked furniture & home decor dashboard templates for 2026, covering retail, manufacturing and office inventory in Excel and Power BI.
1. Manufacturing Efficiency Dashboard in Power BI
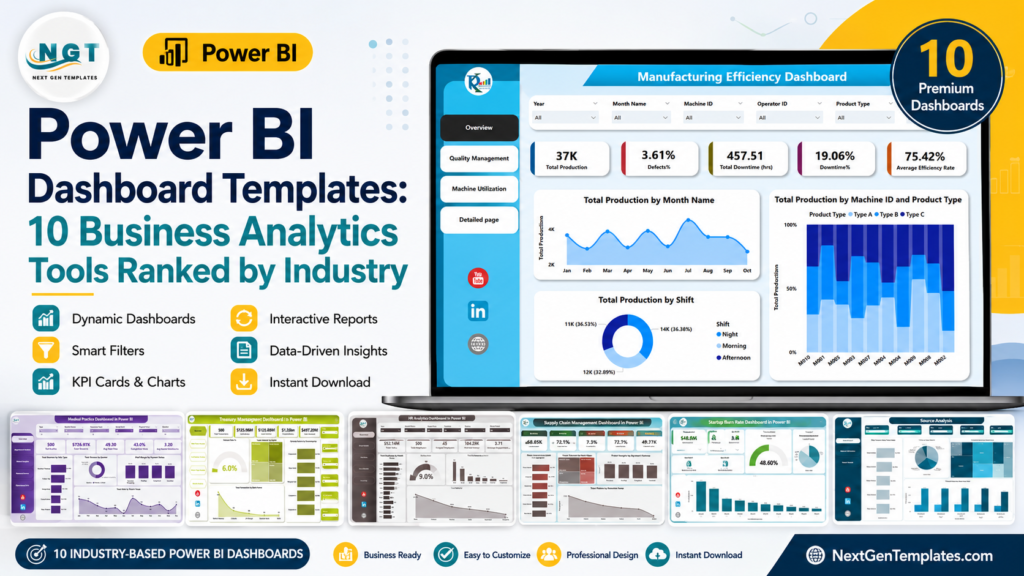
Best for: plant managers and operations teams. Track OEE, production rate, machine utilization, downtime, throughput, and operational cost. It ranks first because its metrics move naturally from loss detection to production action.
2. Treasury Management Dashboard in Power BI
Best for: treasury analysts, controllers, and CFO teams. Its five pages cover cash and loan exposure, bank analysis, counterparty concentration, interest rates, and monthly movement—an unusually complete finance decision set for a compact report.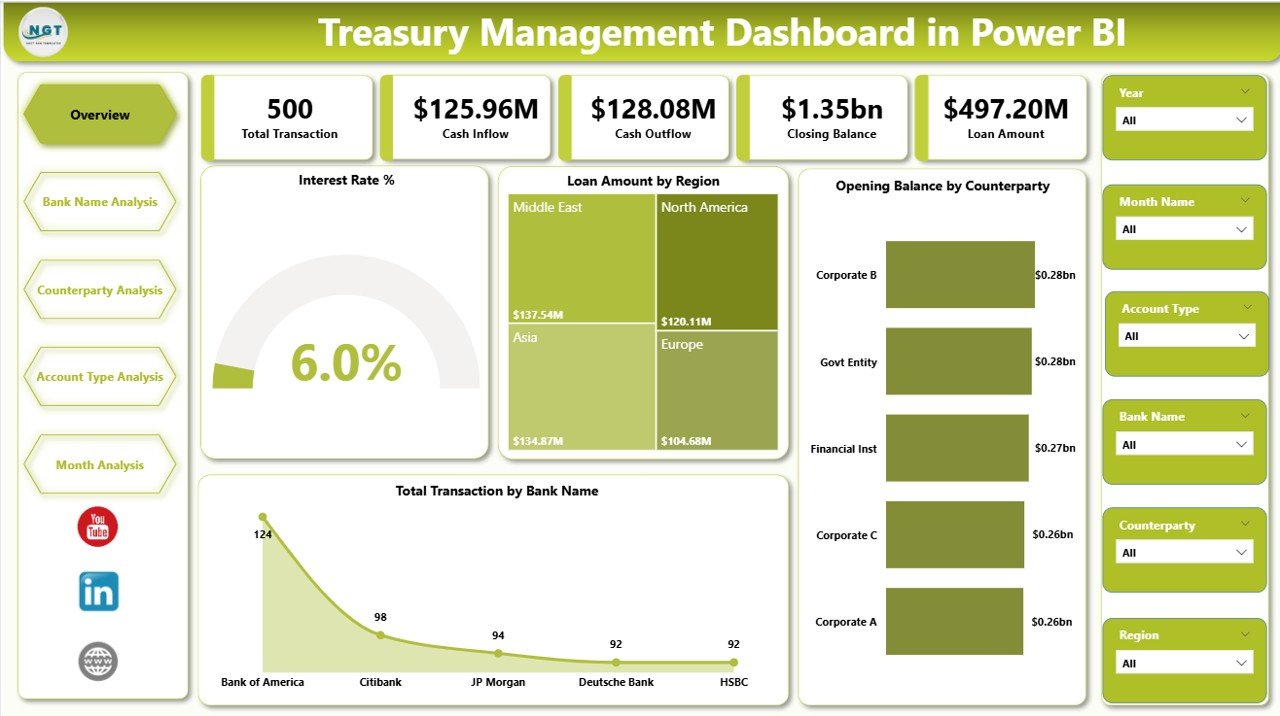
3. Medical Practice Dashboard in Power BI
Best for: clinics, practice managers, and healthcare administrators. Compare total visits, revenue, waiting time, completion rate, and patient satisfaction across overview, department, patient, financial, and operational pages.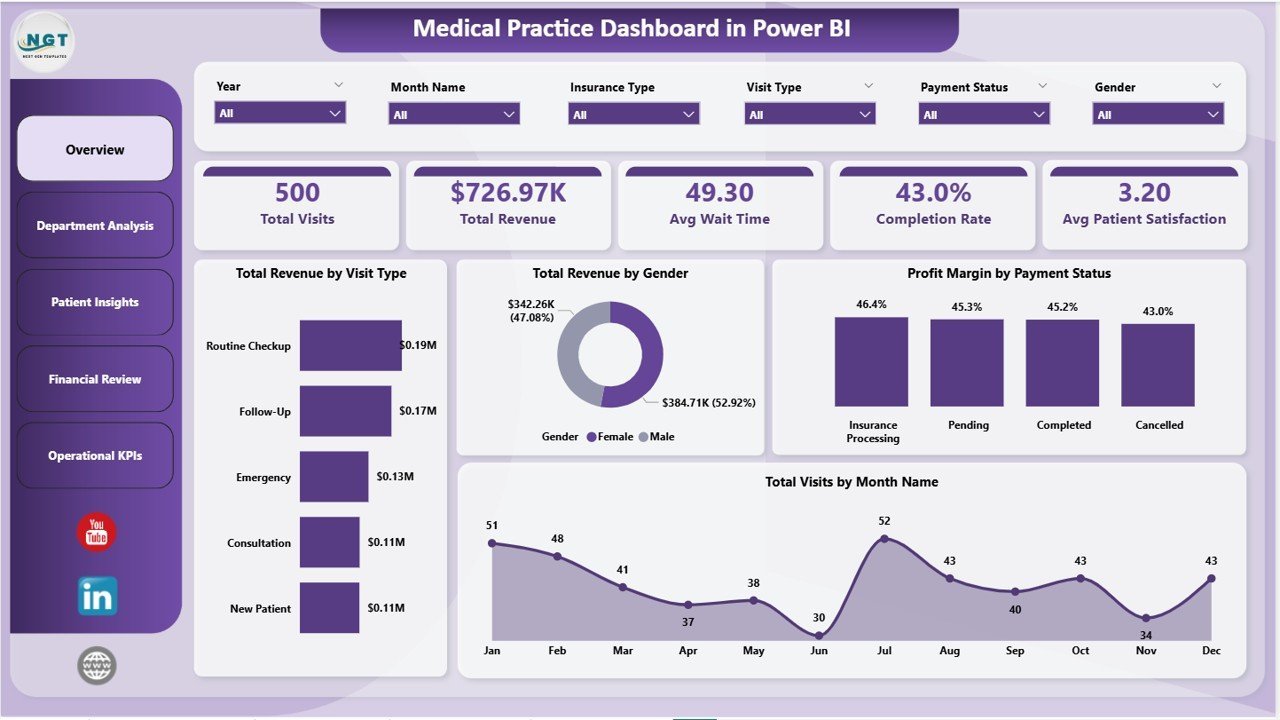
4. HR Analytics Dashboard in Power BI
Best for: HR managers and people analytics teams. Five report pages connect salary, employee count, resignations, engagement, department performance, recruitment, attrition, and training for leadership-ready workforce reviews.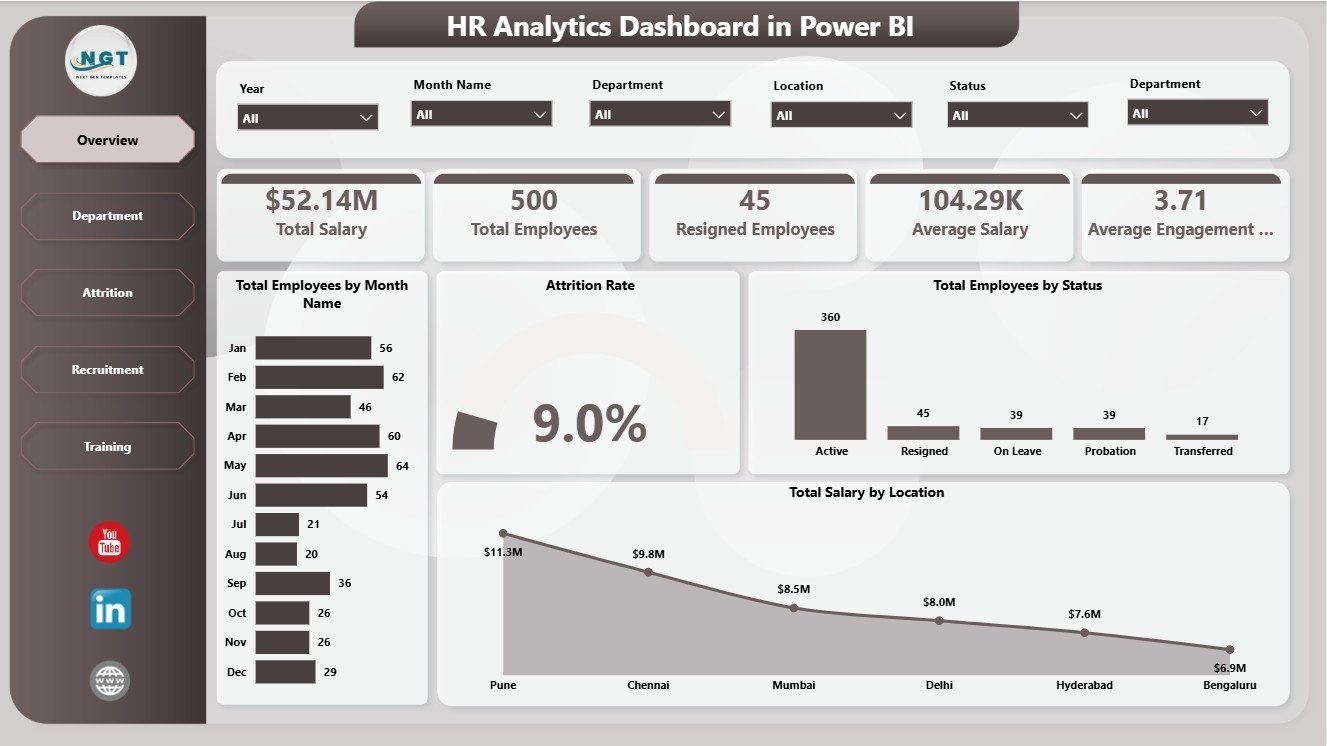
5. Energy Consumption Analysis Dashboard in Power BI
Best for: energy managers, facilities teams, and multi-site operators. Analyze consumption, cost, carbon emissions, efficiency, sources, facilities, maintenance status, equipment, and regions across five focused pages.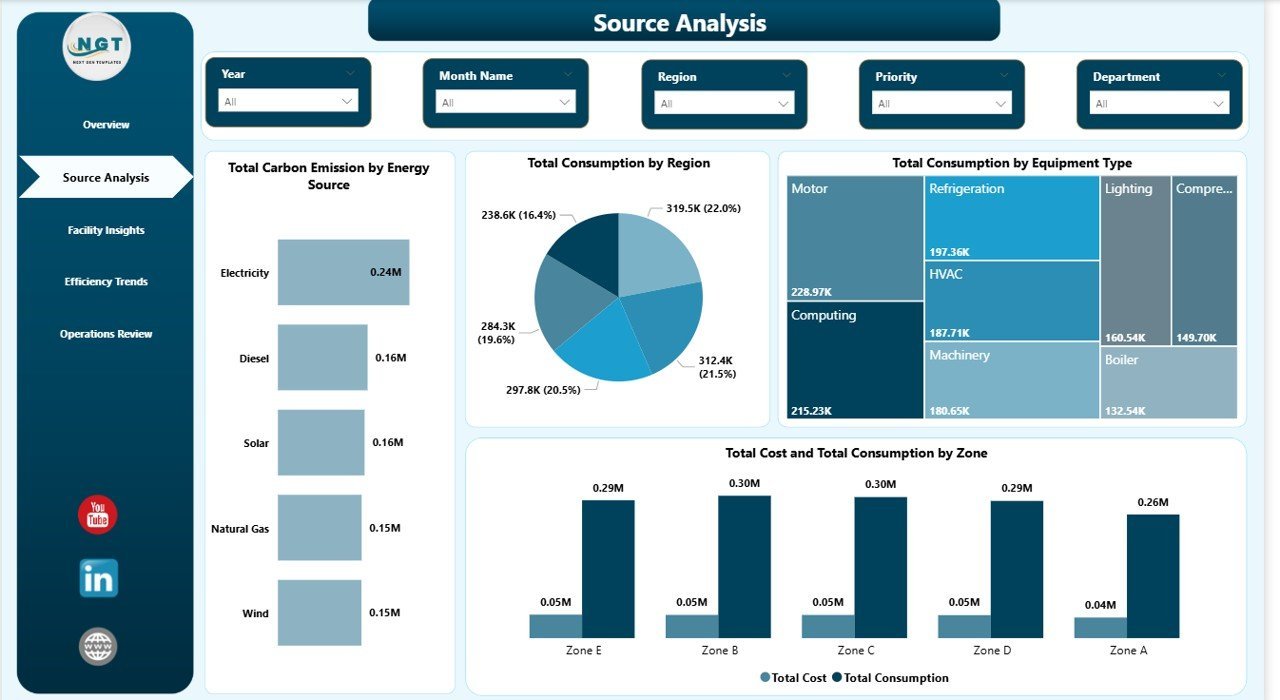
6. Supply Chain Management Dashboard in Power BI
Best for: procurement, logistics, warehouse, and operations teams. Its overview, supplier, warehouse, product, and monthly-trend pages help compare fulfillment, on-time delivery, returns, and order accuracy.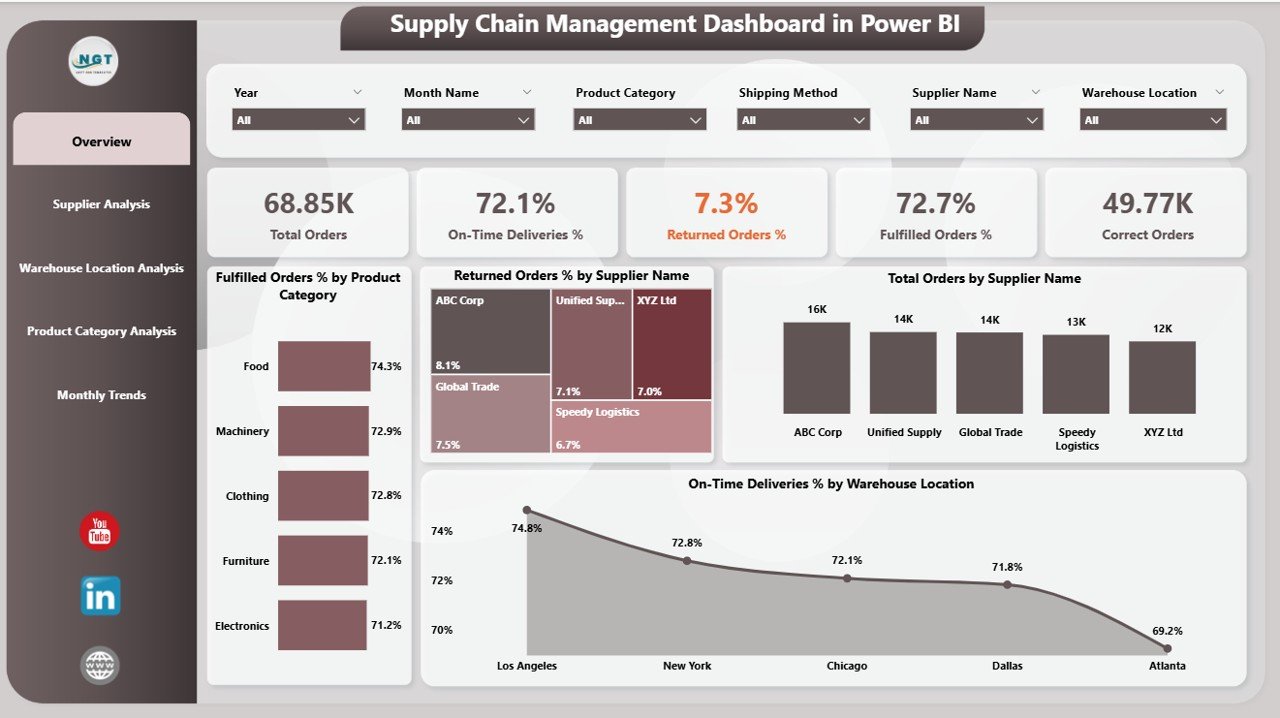
7. Startup Burn Rate Dashboard in Power BI
Best for: founders, startup CFOs, finance teams, and investors. Monitor revenue, burn, average cash balance, churn, budget status, department spending, MRR, runway trends, and customer growth.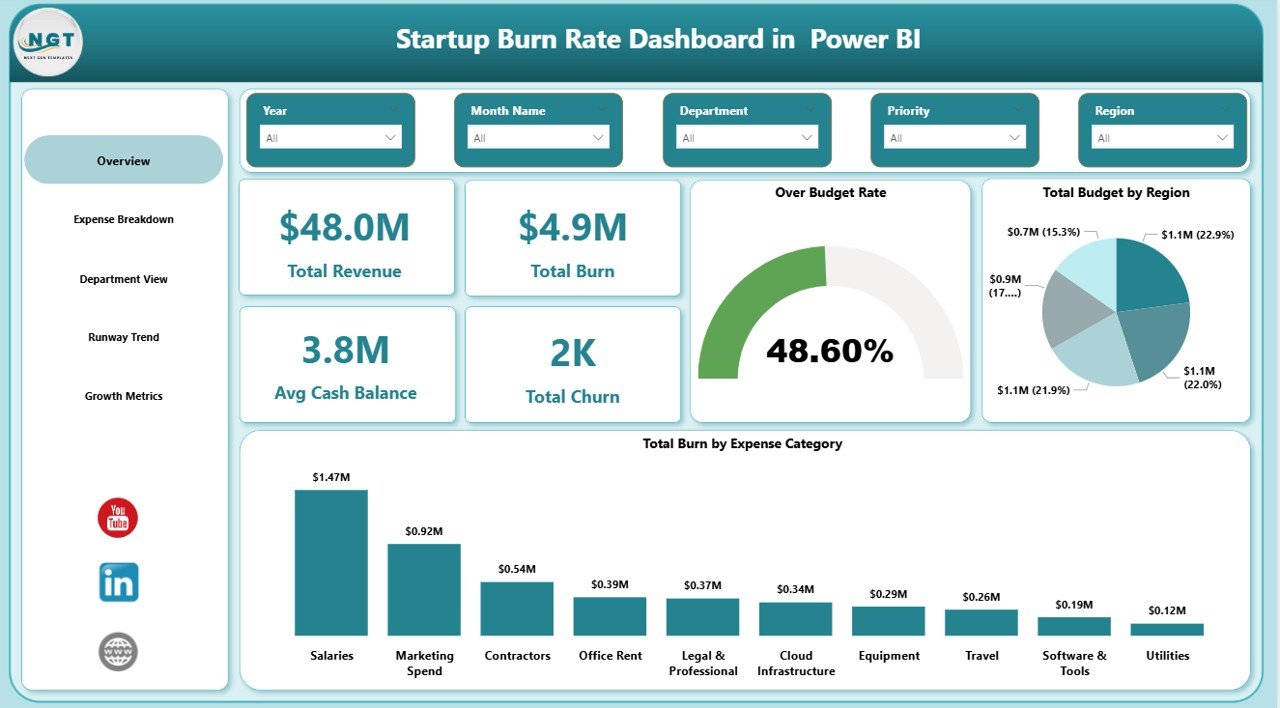
8. ESG Environmental Dashboard in Power BI
Best for: sustainability and environmental compliance teams. Track carbon emissions, renewable energy, water use, waste, facilities, regions, sectors, and compliance scores across five pages.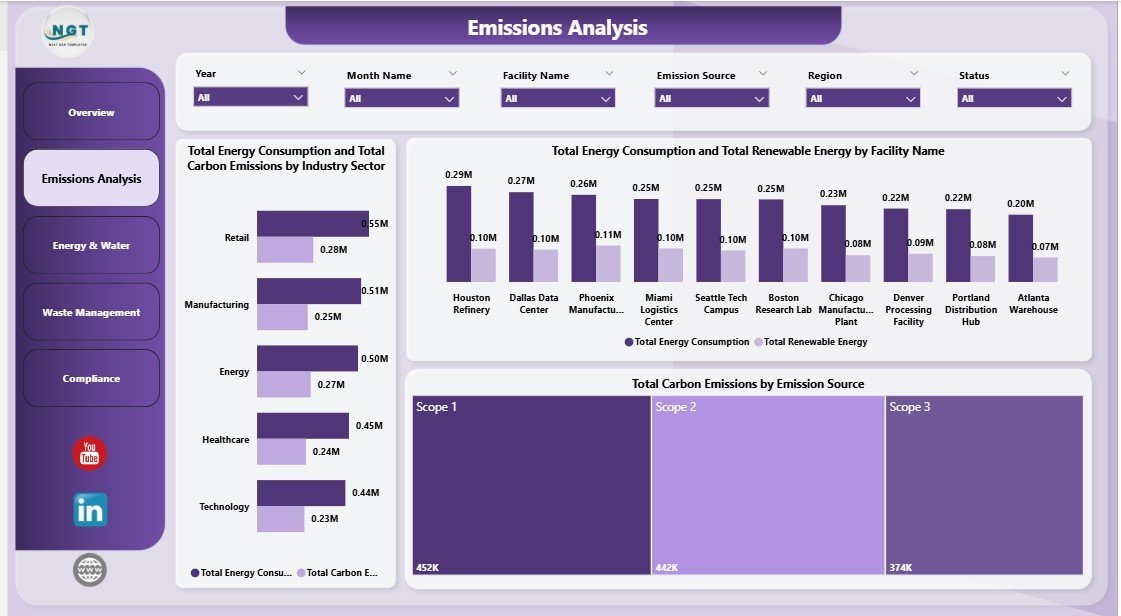
9. Sales Dashboard in Power BI
Best for: sales leaders and commercial analysts. The report connects gross and net sales, discounts, margin, shipping cost, product performance, lead source, region, and monthly trends.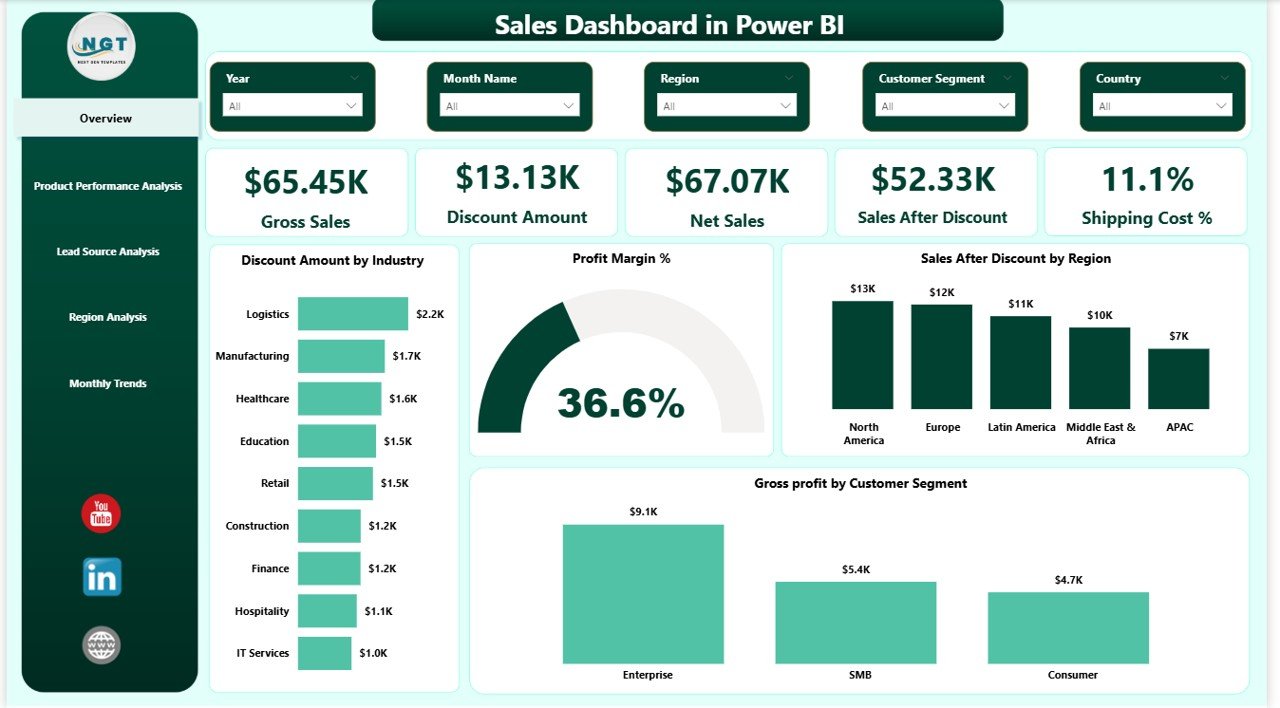
10. Digital Marketing Campaign Dashboard in Power BI
Best for: marketing managers, agencies, and growth teams. Five pages cover spend, revenue, leads, impressions, conversions, platform results, campaign performance, lead analysis, net profit, and ROI.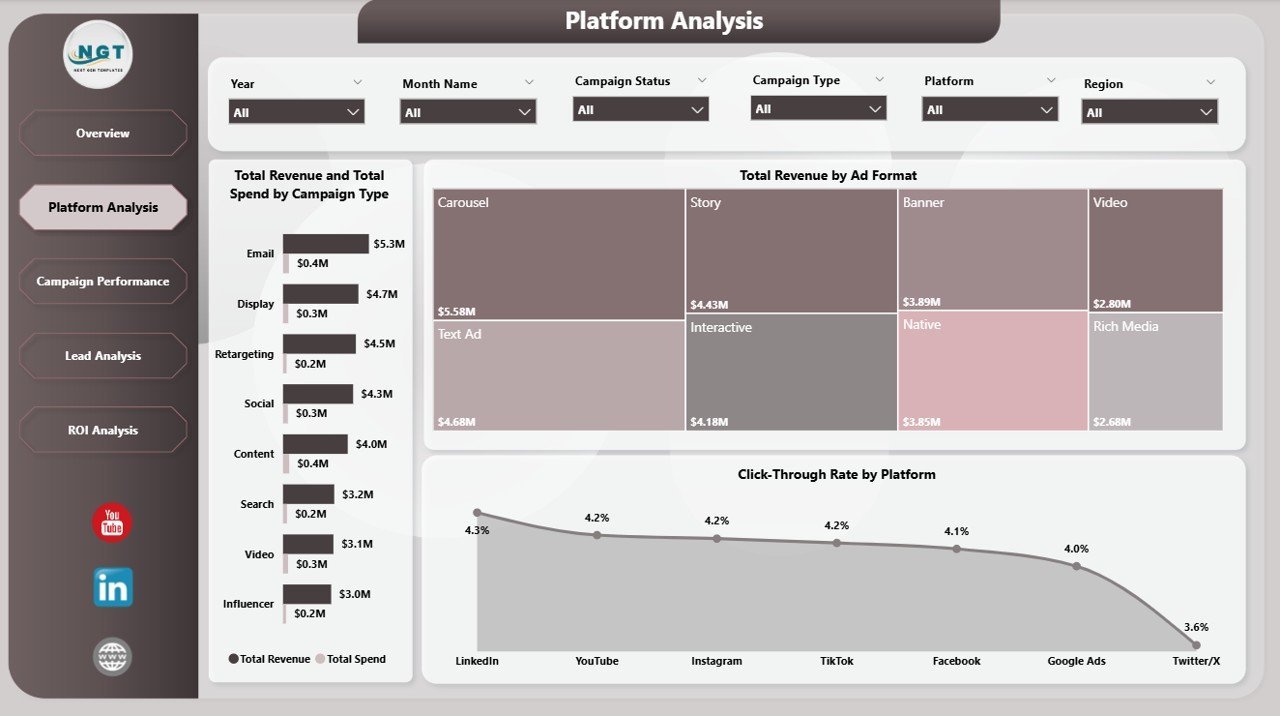
Best Value: 15 Power BI Dashboards in One Collection
Need coverage across departments? The Power BI Dashboard Mega Collection includes 15 premium PBIX templates for $79.99. The listed individual value is $269.85, a $189.86 saving. It is the better buy when multiple teams need a reporting starting point.View the 15-Template Power BI Mega CollectionFor telecom operators specifically, our telecom KPI dashboard guide ranks eight Excel, Google Sheets and Power BI templates for network availability, call drops, churn and ARPU.
Frequently Asked Questions
What is the best Power BI dashboard template overall?
The Manufacturing Efficiency Dashboard ranks first for decision coverage, but the best choice is the template that matches your industry, source data, and recurring management questions.Are these Power BI dashboards or reports?
They are editable, multi-page PBIX reports that are commonly marketed as dashboard templates. In Microsoft terminology, a Power BI service dashboard is a separate single-page canvas.Do I need Power BI Pro?
You can author and edit in the free Power BI Desktop application. Sharing and collaboration in the Power BI service can require paid licensing or access through an eligible capacity.Can I replace the sample data?
Yes. These products are designed as editable starting points. You must map your prepared data to the model, validate calculations, and configure refresh and security for your environment.Which option is best for several departments?
The 15-template Power BI Dashboard Mega Collection offers stronger value than buying many individual templates, provided its included industries match your roadmap.About the Author
Built by PK – Microsoft Certified Professional with 15+ years of Excel, Google Sheets, and Power BI experience. Founder of NextGenTemplates, reaching 300K+ subscribers across YouTube channels. Every template is hand-built and tested before release.Conclusion
Choose a Power BI dashboard template by the decision it improves, not by visual style alone. Start with one department, reconcile its KPIs, and publish only after data owners approve the results. Continue comparing options in our healthcare dashboard guide, retail and e-commerce template guide, and small-business template bundle guide. For tutorials and new dashboard examples, visit the NextGenTemplates YouTube channel.Building a sales stack on a budget? See the best Pipedrive alternatives in Excel and Google Sheets – one-time templates that stand in for a per-seat Pipedrive subscription.
If you are still capturing the underlying data in a spreadsheet, read how to scale a spreadsheet into a business system before you build dashboards on top of it – the record-keeping tier matters as much as the reporting one.
Comparing enterprise BI platforms before you commit? See our guide to Qlik Sense alternatives: 8 BI templates in Excel & Sheets for one-time-purchase dashboards that replace a per-seat subscription.
Related: Moving off a cloud BI platform rather than starting fresh? Our Domo alternatives: 8 BI templates in Excel & Sheets puts each Domo feature next to the one-time template that replaces it, from $4.99.
Weighing a premium BI subscription against a one-time file? See our guide to the best Power BI Premium alternatives in Excel, Sheets and Power BI from $7.99.