

The best Qlik Sense alternatives for small teams are ready-made BI dashboard templates in Excel, Power BI, and Google Sheets. Instead of paying $825+ per month for Qlik Cloud Analytics, you buy a one-time $9.99–$17.99 template that delivers the same KPI cards, trend charts, and self-service filtering — with no seats, no modules, and no admin.
Last updated: August 2026
Key takeaways
- Qlik Cloud Analytics (formerly Qlik Sense) starts at roughly $825/month billed annually for 20 full users — a recurring cost most small teams never fully use.
- Our top pick, the Business Intelligence KPI Dashboard in Power BI, is a one-time $11.99 file that covers the core Qlik self-service analytics use case.
- All 8 templates are one-time purchases priced $9.99–$17.99 — the whole set costs less than a single month of Qlik.
- Templates ship in Excel, Power BI, and Google Sheets, so you keep the format your team already knows instead of retraining on Qlik’s associative engine.
- Qlik Sense still wins for governed enterprise deployments, 100+ concurrent users, and live data pipelines — we say exactly where below.
 Launch offer
SUMIFS, XLOOKUP, FILTER, LAMBDA and checking AI-written formulas, with real business projects. 11h 47m of video by PK, with practice files, quizzes and a capstone.
Why small teams leave Qlik Sense
Qlik Sense — now sold as Qlik Cloud Analytics — is a genuinely powerful self-service BI platform. But its pricing model is built for the mid-market and enterprise, not for a five-person finance team or a solo analyst. According to Qlik’s official published pricing, the Standard tier lists at about $825/month billed annually and bundles 20 full users plus 25 GB of data per year; the Premium tier jumps to roughly $2,750/month, and Enterprise is custom-quoted. (Confirm current figures on Qlik’s page — SaaS pricing moves.)
Three reasons small teams churn off it show up again and again:
- Seat cost. You pay for a 20-user block whether or not you have 20 analysts. A team of four is effectively paying five times the per-head rate they actually need.
- Unused modules. Alerting, AutoML, application automation, data integration — the platform bills for a stack most small teams touch once and then forget. You are renting capability you do not consume.
- Admin overhead. Someone has to manage spaces, streams, reload schedules, and user governance. That is a part-time job the platform quietly assumes you have staffed.
A dashboard template removes all three. You pay once, you own the file, and the KPIs, charts, and filters are already built. The trade-off — no live data pipeline, no governed multi-user server — is one most small teams happily make. See how the formats stack up in our Excel vs Google Sheets vs Power BI dashboard format comparison.
Qlik Sense vs NGT templates compared
| Qlik Sense feature | NGT template that covers it | Format | Price |
|---|---|---|---|
| Self-service BI dashboard (associative analytics) | Business Intelligence KPI Dashboard in Power BI — Best overall | Power BI | $11.99 |
| Interactive KPI app with input sheets | Business Intelligence (BI) KPI Dashboard in Excel | Excel | $14.99 |
| Cloud, shareable analytics workspace | Business Intelligence KPI Dashboard in Google Sheets — Best value | Google Sheets | $9.99 |
| Classic BI scorecard with trend view | Business Intelligence KPI Dashboard in Excel | Excel | $12.99 |
| Advanced / data-science analytics | Data Science and Analytics KPI Dashboard in Excel | Excel | $14.99 |
| Web & marketing analytics (Qlik connectors) | Google Analytics KPI Dashboard in Power BI | Power BI | $11.99 |
| Cloud web-analytics dashboard | Google Analytics KPI Dashboard in Google Sheets | Google Sheets | $9.99 |
| E-commerce / seller analytics app | Etsy Seller Analytics Dashboard in Excel | Excel | $17.99 |
Every row is a one-time purchase. The whole table — eight dashboards across three formats — totals under $105, versus $825+ every month for a single Qlik tier.
How we picked these
We searched the NextGenTemplates catalog of 1,000+ paid templates for dashboards that reproduce what a small team actually uses Qlik Sense for: KPI monitoring, trend analysis, and self-service filtering. We prioritized BI-branded dashboards with real input sheets and definition tabs, then added web-analytics and e-commerce analytics dashboards to cover the connector use cases Qlik markets. We excluded free templates, single-chart files, and anything without an interactive filter or slicer — because the whole point of a Qlik replacement is interactivity, not a static report. Prices and links were pulled live at the time of writing.
The 8 best Qlik Sense alternatives for 2026
1. Business Intelligence KPI Dashboard in Power BI — best overall
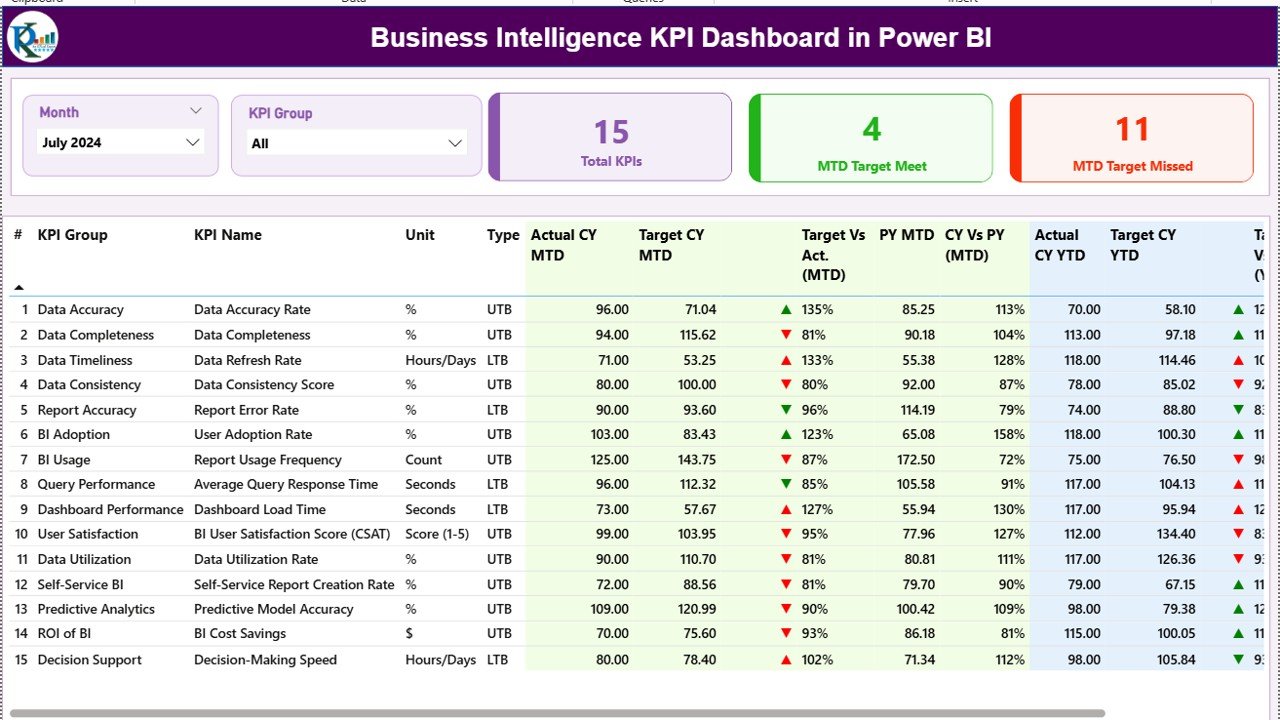
This is the closest one-to-one swap for Qlik Sense. Power BI gives you the same self-service, click-to-filter analytics model that Qlik’s associative engine is famous for — but on Microsoft’s free desktop authoring tool, with a one-time template instead of a per-seat SaaS bill.
Who it is for: analysts and small BI teams who want interactive, drill-anywhere dashboards without a platform subscription.
What is inside:
- Pre-built BI KPI cards with variance and trend indicators
- Slicers for date, category, and region — the self-service filtering Qlik users expect
- A structured data model you point at your own numbers
- Definition sheet documenting every metric
Swap in your monthly figures and a Qlik dashboard you paid $825/month for becomes an $11.99 file you own outright. A four-person team saves roughly $9,900 in the first year alone. Publish to the free Power BI service to share read-only views internally. It ranks #1 because it matches Qlik’s flagship use case at the lowest switching cost for anyone already in the Microsoft stack.
Price: $11.99 — get the BI Power BI dashboard.
Best for: the default Qlik Sense replacement for Microsoft-stack teams.
2. Business Intelligence (BI) KPI Dashboard in Excel — most complete Excel build
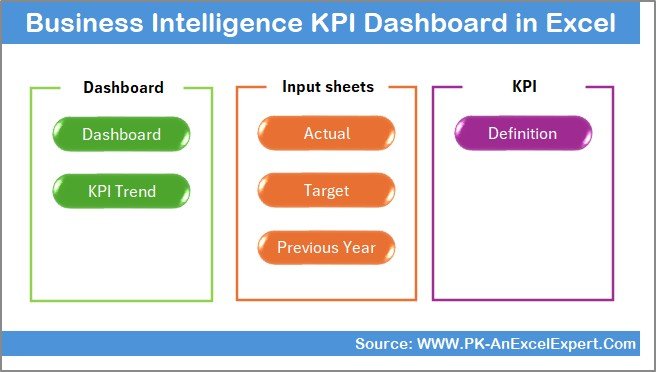
If your team lives in Excel, this is the richest BI replacement in the set. It ships with separate Actual, Target, and Previous Year input sheets feeding a single dashboard — the same “app with managed data” pattern Qlik pushes, minus the server.
Who it is for: finance and ops teams who want a governed-feeling BI dashboard entirely inside a workbook.
What is inside:
- Actual / Target / Previous-Year input sheets
- Dashboard and KPI Trend views
- A KPI definition tab so metrics stay consistent
- No macros required — it opens and calculates anywhere Excel runs
Track 10–15 KPIs against target and prior year, refresh in a couple of minutes each month, and email the file to stakeholders who do not have — and will never buy — a Qlik seat. For a broader Excel and Power BI dashboard set, see our Power BI dashboard templates ranked by industry.
Price: $14.99 — get the BI Excel dashboard.
Best for: Excel-first teams that want target-vs-actual BI without a platform.
3. Business Intelligence KPI Dashboard in Google Sheets — best value
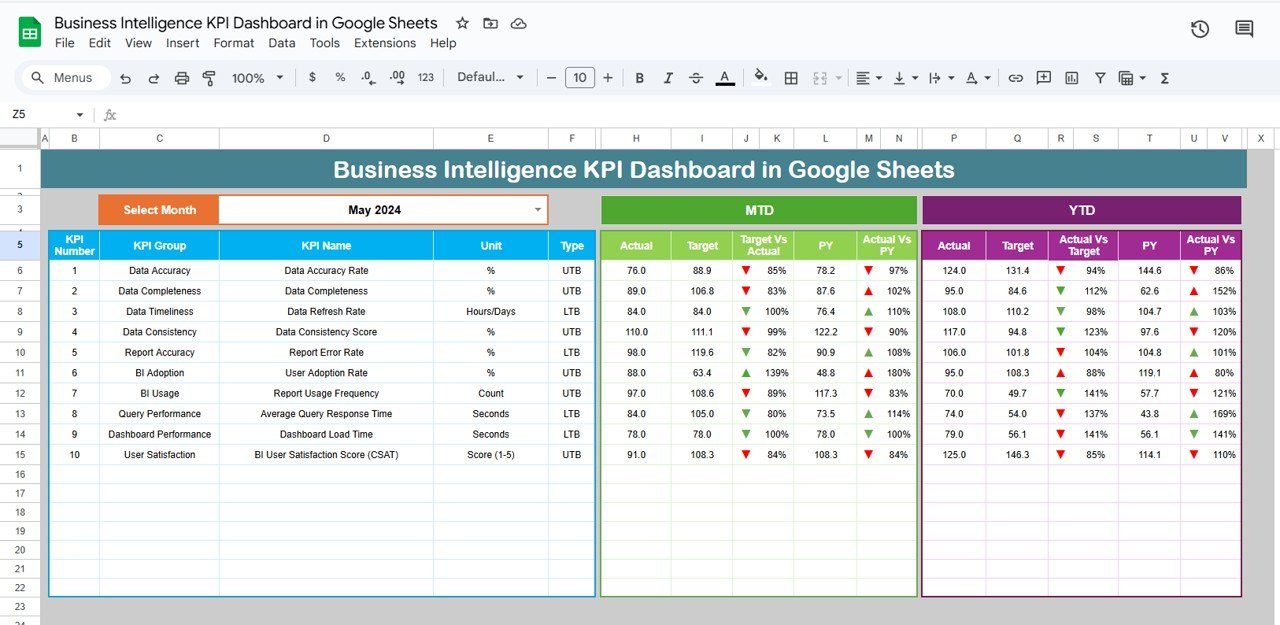
At $9.99 this is the cheapest way to get a shareable, cloud-native BI dashboard — and it directly answers Qlik’s biggest selling point: browser access with no install. Google Sheets is free, collaborative, and already open in most small teams.
Who it is for: distributed teams that want live, link-shared dashboards without any per-user licence.
What is inside:
- Cloud KPI dashboard with charts and filters
- Real-time multi-user editing — the Qlik Cloud collaboration story, for free
- Input tabs for your own data
- Works on any device with a browser
Share one link and your whole team sees the same numbers, exactly like a Qlik space — except you are not paying per head. This is the best value in the list because it removes both the software cost and the sharing cost. It pairs well with the Google Analytics dashboard in Google Sheets below for a full cloud reporting stack.
Price: $9.99 — get the BI Google Sheets dashboard.
Best for: teams that valued Qlik for cloud sharing above all else.
4. Business Intelligence KPI Dashboard in Excel — classic BI scorecard

A leaner, lower-cost Excel BI dashboard for teams that want the scorecard-plus-trend layout without the extra input sheets of option 2. At $12.99 it is the value pick inside the Excel family.
Who it is for: managers who need a clean monthly BI scorecard, not a full data app.
What is inside:
- KPI summary cards with conditional formatting
- Trend charts for period-over-period movement
- A single, simple data sheet to maintain
- Print-ready layout for board packs
Use it when Qlik was overkill and all you ever exported was a one-page KPI summary anyway. Maintain 8–12 metrics, refresh monthly, and drop the page straight into a leadership deck. For revenue-specific tracking, our revenue analysis dashboard guide goes deeper.
Price: $12.99 — get the BI scorecard in Excel.
Best for: a simple, printable monthly BI scorecard.
5. Data Science and Analytics KPI Dashboard in Excel — advanced analytics
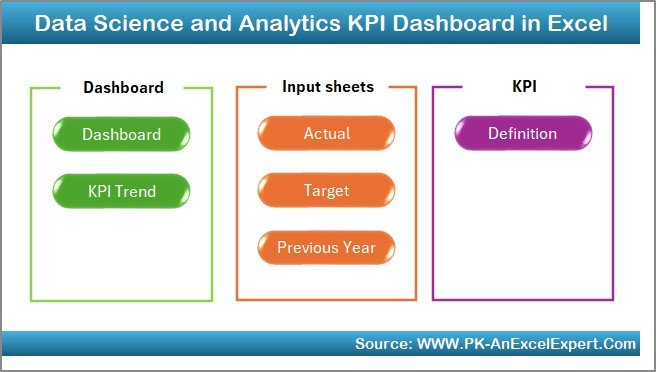
Qlik markets AutoML and advanced analytics as premium add-ons. This dashboard covers the reporting side of that story — model, experiment, and analytics KPIs — in a plain Excel file, so a data team can track its own metrics without a platform seat.
Who it is for: analytics and data-science teams reporting on model and project performance.
What is inside:
- Analytics-focused KPI cards (accuracy, throughput, coverage-style metrics)
- Trend visuals for experiment tracking
- Input sheet for your own model or project data
- Definition tab keeping metric formulas explicit
Where Qlik would bill you for the AutoML tier, this gives a data team a $14.99 scorecard to report accuracy, run counts, and delivery KPIs to non-technical stakeholders. Track a dozen model metrics month over month and present them without exposing a notebook.
Price: $14.99 — get the data science KPI dashboard.
Best for: reporting data-science KPIs without a BI platform.
6. Google Analytics KPI Dashboard in Power BI — web analytics

One of Qlik’s headline features is its library of data connectors, including web and marketing sources. This Power BI dashboard delivers the web-analytics slice of that — sessions, users, conversions — in an interactive report you refresh yourself.
Who it is for: marketing and growth teams who used Qlik to visualize web traffic.
What is inside:
- Traffic, engagement, and conversion KPI cards
- Channel and source breakdowns with slicers
- Trend charts for sessions and users over time
- A layout you point at your exported GA data
Instead of paying for Qlik’s connector tier to chart marketing performance, drop your Google Analytics export into this $11.99 Power BI file and get a self-service traffic dashboard. Great for monthly marketing reviews and paired with a quality assurance dashboard for full-funnel reporting.
Price: $11.99 — get the GA Power BI dashboard.
Best for: marketing teams replacing Qlik’s web-analytics connectors.
7. Google Analytics KPI Dashboard in Google Sheets — cloud web analytics
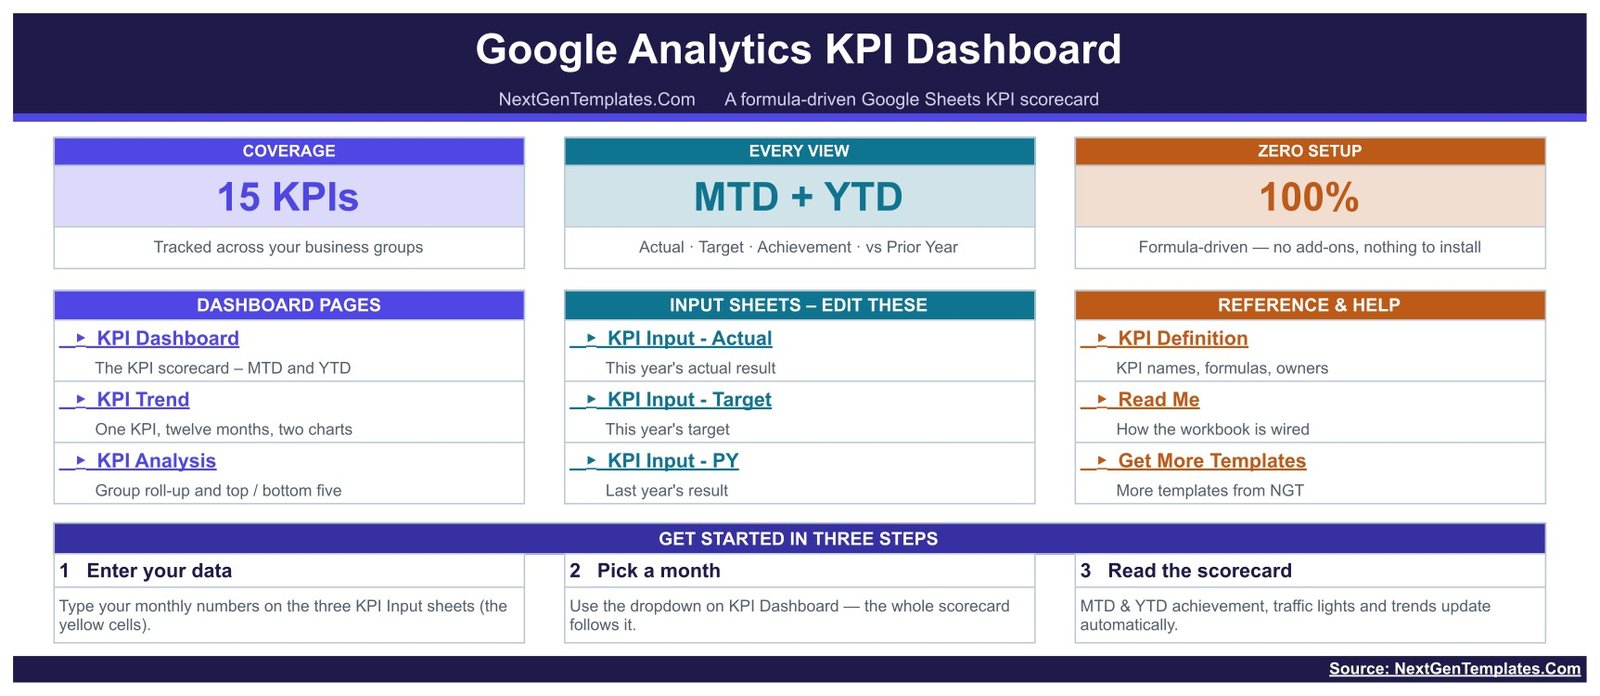
The cloud-native counterpart to option 6. At $9.99 it puts your web KPIs in a shareable Google Sheet — the natural home for GA data, since both live in the Google ecosystem — with no platform between you and the numbers.
Who it is for: lean marketing teams that want a link-shareable traffic dashboard.
What is inside:
- Web KPI cards and trend charts in Google Sheets
- Filterable channel and campaign views
- Live collaboration and link sharing
- Simple monthly data-paste workflow
Refresh once a month, share the link with your founder or client, and skip both the Qlik licence and the Power BI publish step. A solo marketer can run their entire reporting cadence from this one $9.99 sheet.
Price: $9.99 — get the GA Google Sheets dashboard.
Best for: the cheapest shareable web-analytics dashboard.
8. Etsy Seller Analytics Dashboard in Excel — e-commerce analytics
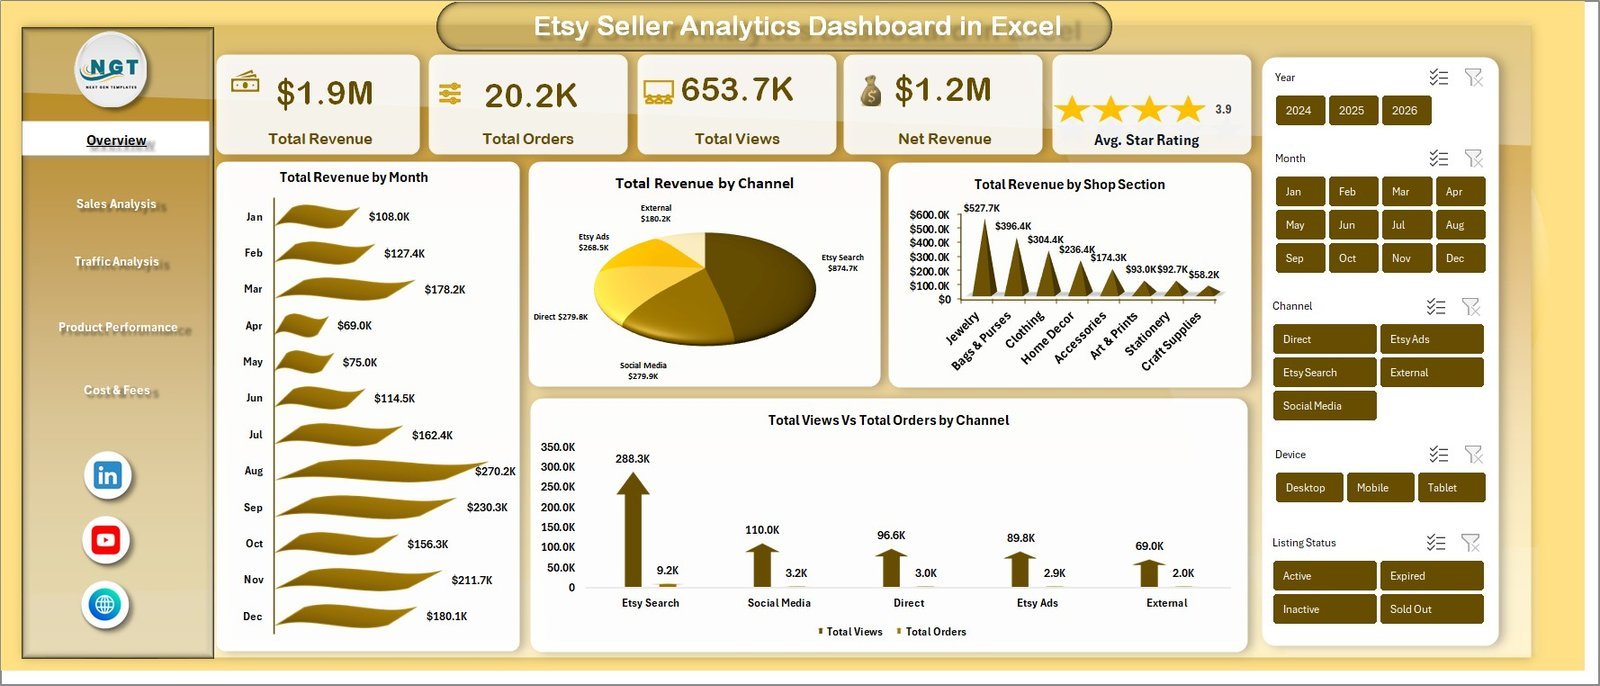
Qlik is often bought to unify sales data from multiple channels. If your channel is an online marketplace, this purpose-built $17.99 dashboard does the analytics job for a fraction of a Qlik seat — and it is ready the moment you paste in your orders.
Who it is for: Etsy and small e-commerce sellers analyzing sales, fees, and product performance.
What is inside:
- Revenue, orders, and fee KPI cards
- Best-seller and product-level breakdowns
- Trend charts for sales over time
- Profit-after-fees calculations
A seller doing 200–500 orders a month gets margin visibility Qlik would charge a subscription for — here it is a one-time file. As the most feature-rich dashboard in the set, it is the pick for anyone whose “BI” really means “understand my store.”
Price: $17.99 — get the Etsy analytics dashboard.
Best for: marketplace sellers replacing Qlik with focused e-commerce analytics.
Ready to drop Qlik’s monthly bill? Start with the Business Intelligence KPI Dashboard in Power BI — a one-time $11.99 that covers the core Qlik Sense use case. Prefer the cloud? The Google Sheets version is just $9.99.
How to choose between them
| If you… | Buy this | Price |
|---|---|---|
| Are in the Microsoft stack and want the closest Qlik swap | BI KPI Dashboard in Power BI | $11.99 |
| Want the richest Excel BI build with target vs actual | BI (BI) KPI Dashboard in Excel | $14.99 |
| Value cloud sharing and free multi-user access most | BI KPI Dashboard in Google Sheets | $9.99 |
| Just need a printable monthly scorecard | BI KPI Dashboard in Excel | $12.99 |
| Report on models or analytics projects | Data Science and Analytics KPI Dashboard | $14.99 |
| Track web and marketing performance | Google Analytics KPI Dashboard (Power BI / Sheets) | $11.99 / $9.99 |
| Run an online store | Etsy Seller Analytics Dashboard in Excel | $17.99 |
Quick rule: match the format to your team (Power BI for Microsoft shops, Google Sheets for cloud collaborators, Excel for everyone else), then match the topic to your data. Most small teams start with the BI dashboard in their preferred format and add a web-analytics dashboard later.
When a Qlik Sense template is NOT the right answer
These templates replace Qlik for the majority of small-team use cases, but not all of them. Buy or keep Qlik Sense / Qlik Cloud Analytics when:
- You have 50–100+ concurrent business users. Governed spaces, row-level security, and centralized user management are exactly what an enterprise BI platform is for — a template cannot administer that.
- You need live, always-on data pipelines. Qlik’s associative engine and scheduled reloads pull from databases and APIs automatically. A template refreshes when a human pastes data in.
- You rely on associative exploration across huge datasets. Qlik’s in-memory engine handling millions of rows with instant selection state is a real capability Excel and Sheets will not match at scale.
- Compliance requires audit trails and SSO governance. Regulated environments often mandate the controls only a managed platform provides.
If none of those describe you — and for most teams under ~20 people, none do — a one-time dashboard template is the honest, cheaper answer. For larger deployments, compare full dashboard suites in our Power BI dashboard templates guide, or see how other tools stack up in our NetSuite reporting alternatives and Salesforce alternatives comparisons.
Frequently asked questions
What is the best Qlik Sense alternative for small teams?
The Business Intelligence KPI Dashboard in Power BI ($11.99) is the best all-round Qlik Sense alternative for small teams. It reproduces Qlik’s core self-service analytics — interactive KPI cards, slicers, and trend charts — as a one-time file, avoiding the roughly $825/month Qlik Cloud Analytics subscription.
How much does Qlik Sense cost in 2026?
Qlik’s published pricing lists Qlik Cloud Analytics Standard at about $825/month billed annually (20 full users, 25 GB/year), Premium at roughly $2,750/month, and Enterprise as custom-quoted. Because SaaS pricing changes often, confirm current numbers on Qlik’s official pricing page before deciding.
Can Excel or Google Sheets really replace Qlik Sense?
For most small-team use cases, yes. KPI monitoring, trend analysis, and self-service filtering all work in Excel, Power BI, and Google Sheets templates. What they do not replace is Qlik’s governed multi-user server, live data pipelines, and its in-memory associative engine for millions of rows.
Is Power BI a good Qlik alternative?
Power BI is the closest mainstream alternative to Qlik Sense. Both offer self-service, click-to-filter analytics, but Power BI Desktop is free to author and you can start from a one-time template instead of a per-seat subscription. It is the natural switch for teams already using Microsoft 365.
Do these templates include my data?
No. Each template ships with a sample structure and input sheets; you paste in your own figures. That is deliberate — it keeps the file yours, private, and offline. Most dashboards take only a few minutes to populate the first time, then a quick monthly refresh after that.
Are the templates one-time purchases or subscriptions?
All eight are one-time purchases priced between $9.99 and $17.99. You own the file permanently with no recurring fee, no user seats, and no expiry — the opposite of Qlik’s monthly licensing model. The entire set costs less than one month of a single Qlik tier.
Which format should I choose: Excel, Power BI, or Google Sheets?
Choose Power BI if your team uses Microsoft 365 and wants the richest interactivity, Google Sheets if cloud sharing and free multi-user access matter most, and Excel if you want a self-contained file that opens anywhere. Several BI dashboards are offered in more than one format so you can match your workflow.
Will I lose Qlik’s interactivity with a template?
You keep the everyday interactivity — slicers, filters, and drill-downs are built into every dashboard. What you give up is Qlik’s associative selection model, where every filter instantly recolors the entire dataset. For typical KPI reporting that difference rarely matters; for deep ad-hoc exploration of huge datasets, it can.
Can I customize these dashboards?
Yes. Every template is fully editable — change metrics, colors, chart types, and add your own calculations. Because they are standard Excel, Power BI, or Google Sheets files, any team member who knows the tool can adapt them, with no proprietary platform skills required.
Where can I see these dashboards in action?
Watch build walkthroughs and dashboard tutorials on the NextGenTemplates YouTube channel. The videos show how each dashboard is populated and customized, so you can judge fit before buying.
Get more BI dashboard templates
Replace Qlik Sense for a one-time $9.99–$17.99. The Business Intelligence KPI Dashboard in Power BI ($11.99) is the best overall swap; the Google Sheets version ($9.99) is the best value for cloud teams.
Browse the full range of Power BI dashboard templates and subscribe to NextGenTemplates on YouTube for walkthroughs of every dashboard above.
Related: Sisense is another BI platform with a very different pricing model – it publishes no list price at all. See our Sisense alternatives: 6 analytics templates in Excel & Sheets for the quote-only cost breakdown and six one-time replacements from $9.99.
Related: Weighing Domo as well? Our Domo alternative dashboard template guide maps every Domo feature to the template that covers it, with eight one-time BI dashboards from $4.99 and the median $50,000 annual Domo contract recorded in Vendr deal data.
Related: At the free end of the same market sits Looker Studio, now Data Studio. It costs $0 for creators and viewers, yet people still switch – for query speed, for Pro licensing billed per Google Cloud project, and for the paid connectors non-Google data needs. See our Looker Studio alternatives in Google Sheets & Excel – eight one-time reporting templates from $4.99.
Switching a support desk too? Compare our Zendesk alternatives in Excel & Google Sheets — 8 helpdesk templates that replace Zendesk ticketing, SLA and CSAT reporting from $6.99.
Comparing service tools too? See our guide to Freshdesk alternatives in Excel & Sheets.
Switching business tools to cut subscription costs? See our guide to Cin7 alternatives – 6 inventory and order templates in Excel & Sheets for the same template-versus-SaaS approach applied to inventory management.
Switching construction software too? See our guide to Buildertrend alternatives in Excel and Google Sheets for six home-builder templates that replace scheduling, budgeting and reporting for a one-time fee.
Trimming IT tool costs elsewhere too? Compare options in our ServiceNow alternatives for ITSM teams.
Related: Need a CMMS on a budget? See these affordable MaintainX alternative Excel & Sheets templates from $1.99.