

🔑 Key Features of Medical Practice Dashboard in Power BI
The Medical Practice Dashboard in Power BI is a professionally designed, ready-to-use analytics template built for clinics, hospitals, private practices, and healthcare administrators who need to track patient visits, revenue, departmental performance, and operational KPIs — all from a single Power BI file. This dashboard includes 5 interactive analysis pages covering an Overview, Department Analysis, Patient Insights, Financial Review, and Operational KPIs. It tracks key metrics including Total Visits, Total Revenue, Average Wait Time, Completion Rate, and Average Patient Satisfaction across multiple departments, visit types, insurance categories, and payment statuses.
Whether you manage a small clinic or a multi-department hospital, this Power BI Dashboard Template gives you instant visibility into financial performance, patient demographics, and operational efficiency. Simply open the .pbix file in Power BI Desktop, connect your data source, and watch every chart and KPI update automatically. If you’re looking for the Excel version, check out the Medical Practice Dashboard in Excel.
📦 What’s Inside the Medical Practice Dashboard in Power BI
This template is organized into 5 dashboard pages, each serving a specific analytical purpose:
📊 Overview Page — The high-level command center of your medical practice. At the top, you’ll find KPI cards displaying Total Visits, Total Revenue, Avg Wait Time, Completion Rate, and Avg Patient Satisfaction. Below the cards, four key visualizations show Total Revenue by Visit Type, Total Revenue by Gender, Profit Margin by Payment Status, and Total Visits by Month Name. Multiple slicers let you filter the dashboard instantly by department, visit type, and more.
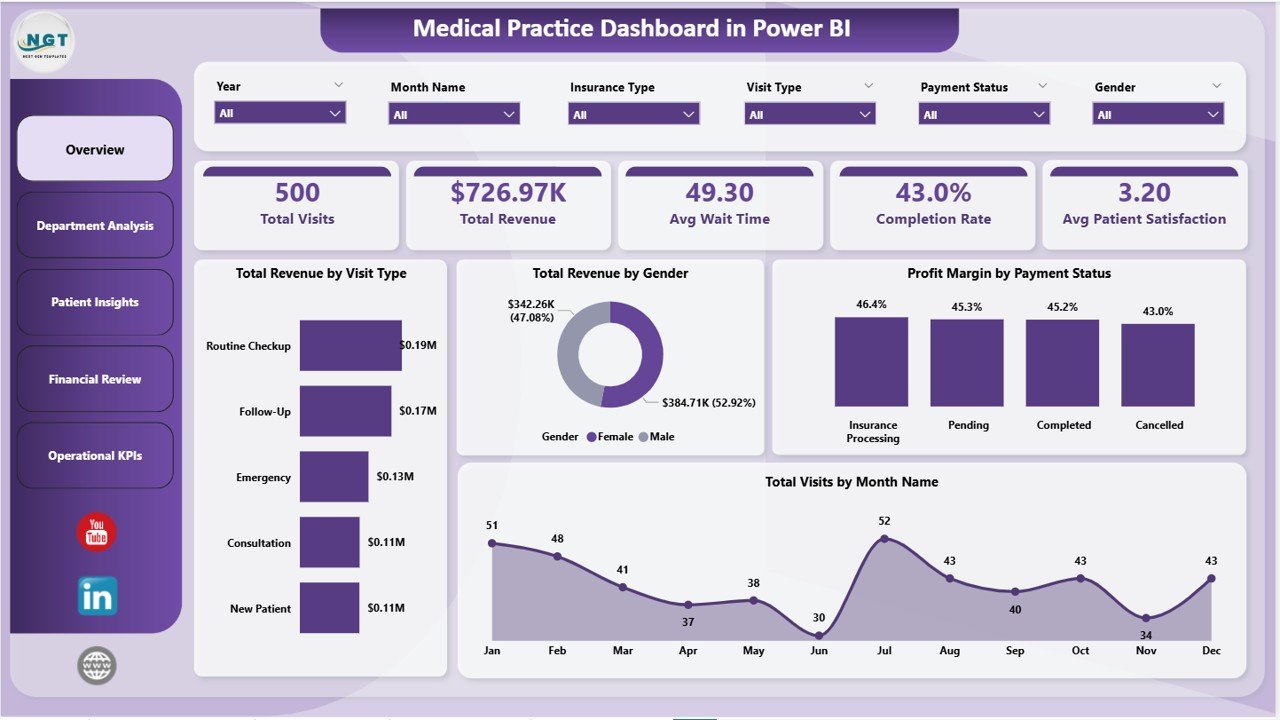
Medical Practice Dashboard in Power BI
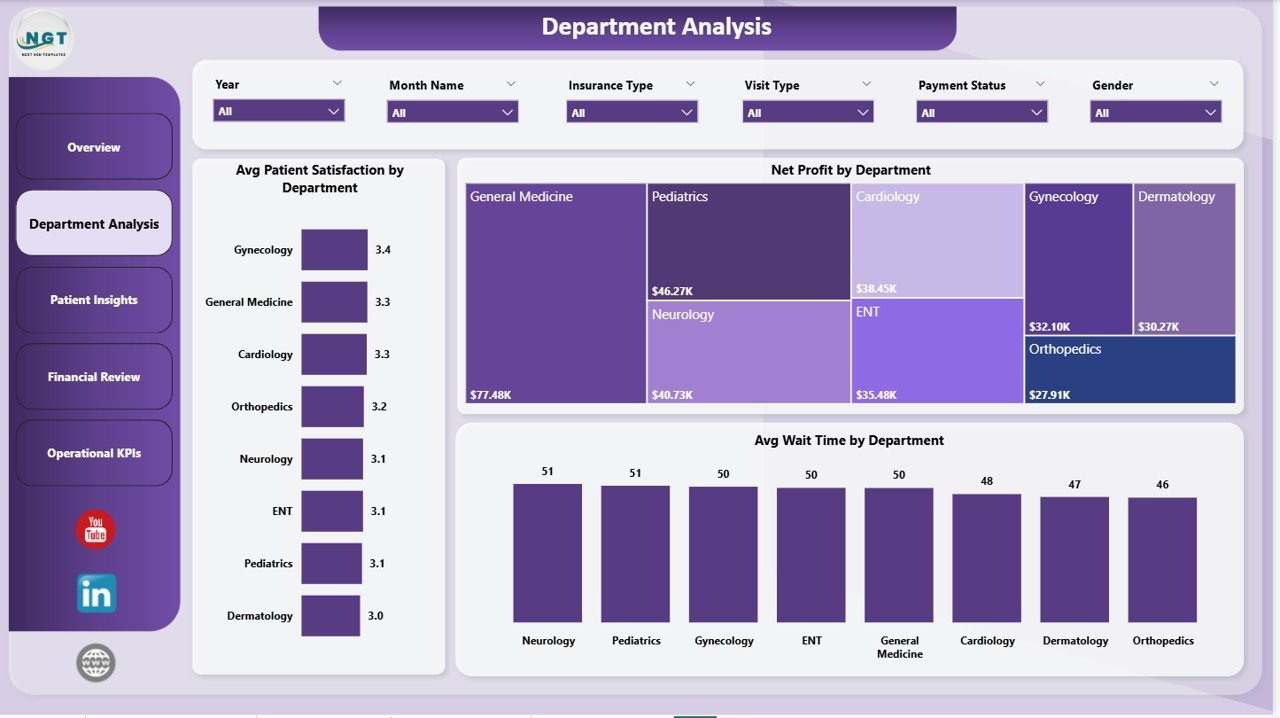
📊 Department Analysis — This page focuses entirely on departmental performance. It visualizes Avg Patient Satisfaction by Department, Net Profit by Department, and Avg Wait Time by Department. Healthcare administrators can quickly identify which departments are performing well and which need improvement.

Department Analysis
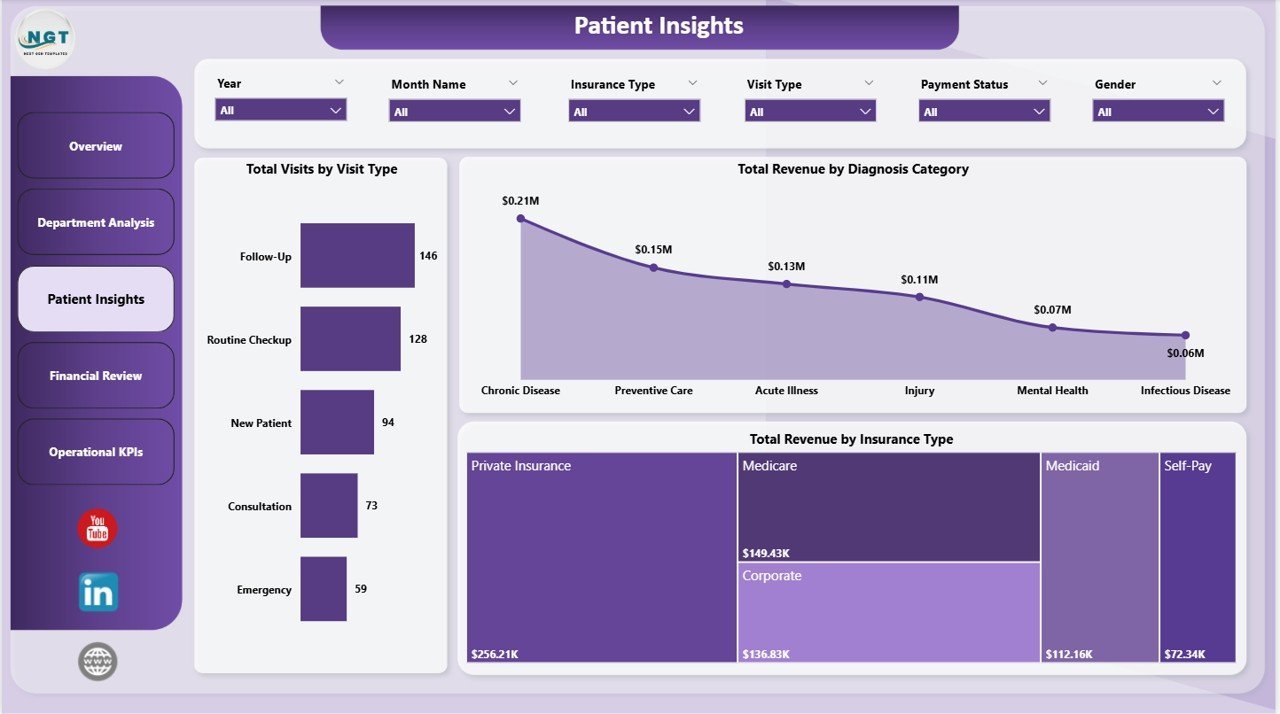
📊 Patient Insights — Dive deeper into patient demographics and diagnosis patterns. This page shows Total Visits by Visit Type, Total Revenue by Diagnosis Category, and Total Revenue by Insurance Type. It helps practice managers understand where their revenue comes from and which patient segments contribute the most. You can also explore the Hospital Patient Flow Dashboard in Google Sheets for similar patient tracking capabilities.

Patient Insights
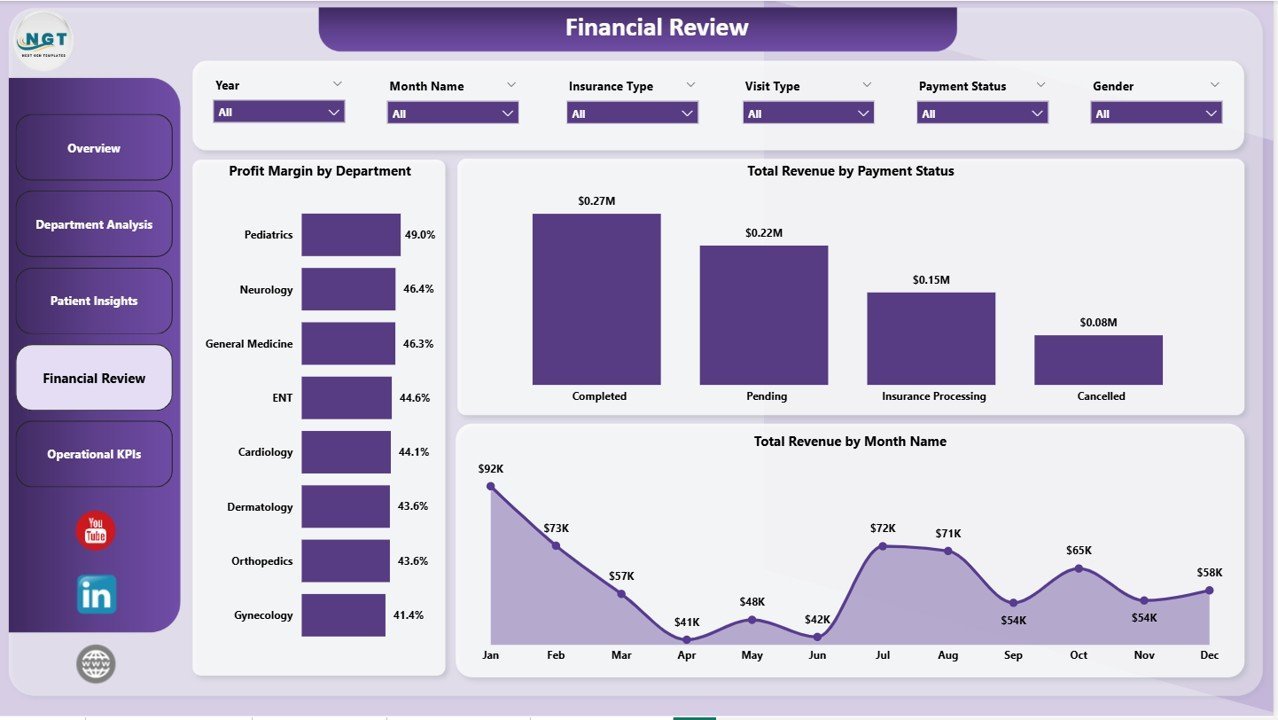
📊 Financial Review — A dedicated page for financial deep-dives. It includes Profit Margin by Department, Total Revenue by Payment Status, and Total Revenue by Month Name. This page is essential for CFOs, financial controllers, and practice owners who want to monitor cash flow, identify payment delays, and track monthly revenue trends.

Financial Review
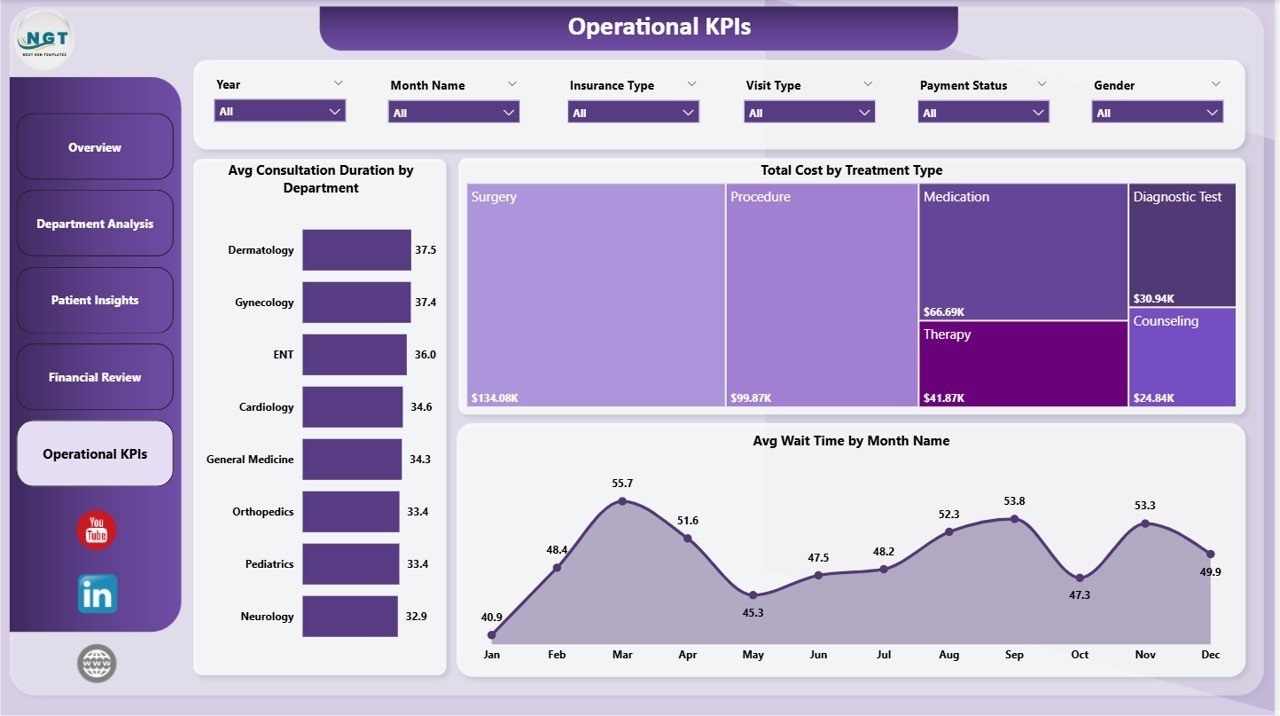
📊 Operational KPIs — This page tracks the day-to-day operational health of your practice. It visualizes Avg Consultation Duration by Department, Total Cost by Treatment Type, and Avg Wait Time by Month Name. It enables operations managers to optimize staff scheduling, reduce patient wait times, and control treatment costs.

Operational KPIs
⚙️ How to Use the Medical Practice Dashboard in Power BI
1️⃣ Download the .pbix file after purchase and open it in Power BI Desktop (free from Microsoft).
2️⃣ Review the sample data to understand the data structure and required fields.
3️⃣ Replace the sample data with your own medical practice data — patient records, visit logs, billing data, and department details.
4️⃣ Click Refresh and watch all 5 dashboard pages, KPI cards, charts, and slicers update automatically.
5️⃣ Use the slicers on each page to filter data by department, visit type, time period, and other dimensions.
👥 Who Can Benefit from This Medical Practice Dashboard in Power BI
📌 Healthcare Administrators and Hospital Managers looking for a comprehensive analytics overview
📌 Practice Managers at clinics, dental offices, and specialty practices who need to monitor revenue and patient flow
📌 Medical Business Analysts who require department-level performance and profitability tracking
📌 CFOs and Financial Controllers in healthcare organizations needing monthly revenue and cost analysis
📌 Operations Managers focused on reducing wait times and optimizing consultation durations
📌 Students and trainees building healthcare analytics portfolios with real-world dashboard examples
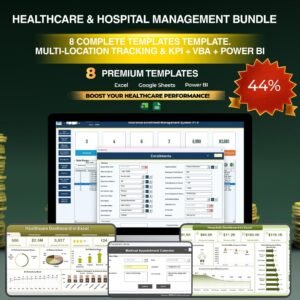
If you’re managing multiple healthcare facilities, consider the Healthcare & Hospital Management Bundle which includes 8 premium templates across Excel, Power BI, and VBA.
❓ Frequently Asked Questions
What KPIs does the Medical Practice Dashboard in Power BI track?
The Medical Practice Dashboard in Power BI tracks 5 key performance indicators on the Overview page: Total Visits, Total Revenue, Avg Wait Time, Completion Rate, and Avg Patient Satisfaction. Additional KPIs across other pages include Net Profit by Department, Profit Margin by Department, Avg Consultation Duration, and Total Cost by Treatment Type.
Do I need advanced Power BI skills to use this template?
No. This is a ready-to-use template. Simply open the .pbix file in Power BI Desktop, replace the sample data with your own medical practice data, and click Refresh. All charts, KPI cards, and slicers update automatically — no DAX coding or data modeling required.
Can I customize the dashboard pages and charts?
Yes. Since this is a standard .pbix file, you can fully customize every page, chart, slicer, color, and layout using Power BI Desktop’s editing tools. Add new measures, create additional pages, or modify existing visuals to match your specific reporting needs.
What data do I need to use this dashboard?
You need patient visit records including visit type, department, diagnosis category, insurance type, payment status, consultation duration, wait time, revenue, and cost data. The sample data included in the template shows the exact structure and fields required.
Is this dashboard suitable for multi-department hospitals?
Absolutely. The Department Analysis page is specifically designed to compare Avg Patient Satisfaction, Net Profit, and Avg Wait Time across all departments. The slicers on every page allow you to filter by department for detailed analysis.
What is the best Power BI dashboard template for a medical practice?
The Medical Practice Dashboard in Power BI from NextGenTemplates is one of the best options available. It includes 5 interactive pages covering Overview, Department Analysis, Patient Insights, Financial Review, and Operational KPIs — providing a complete analytics solution for any medical practice or healthcare facility.
🔗 Explore Related Templates
📌 Veterinary Clinic Dashboard in Power BI — A specialized Power BI dashboard for veterinary clinics tracking patient visits, treatments, and revenue.
📌 Dermatology Clinics Dashboard in Power BI — Track clinic performance, doctor productivity, and treatment analytics in Power BI.
📌 Dental Practice Dashboard in HTML — An interactive HTML dashboard for dental clinics with patient and financial analytics.
📖 Click here to read the Detailed Blog Post
🎥 Visit our YouTube channel to learn step-by-step video tutorials
👉 YouTube.com/@NextGenTemplates
Watch the step-by-step video tutorial:
YouTube


Reviews
There are no reviews yet.