

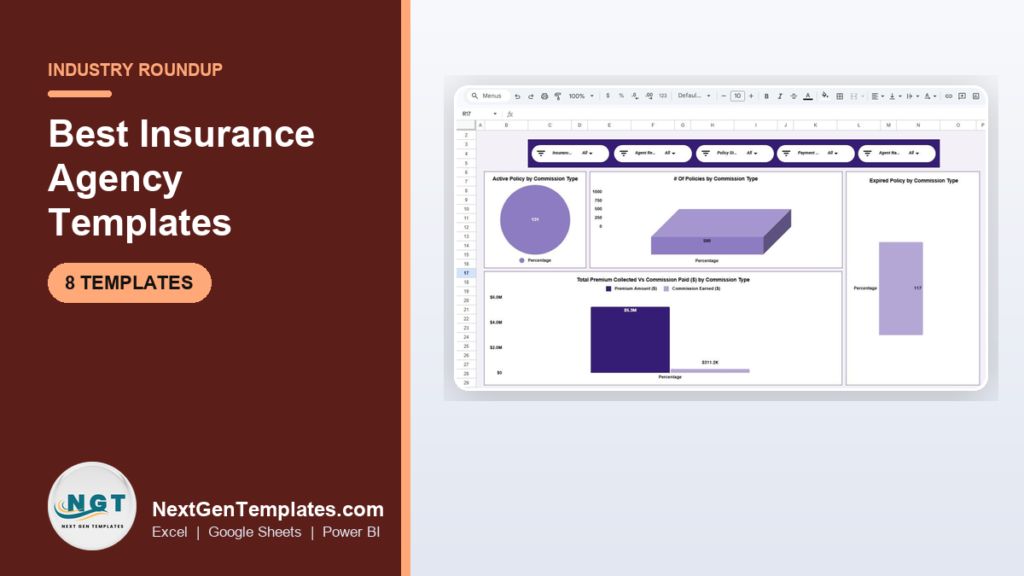
The best insurance dashboard template for most agencies in 2026 is the Insurance Policy Analytics Dashboard in Google Sheets ($9.99): it tracks policies, premium, commission and agent performance across seven pages without the per-seat cost of a full agency management system. Seven more ranked picks below cover Excel and Power BI.
Last updated: September 2026
Key takeaways
- Our top overall pick is the Insurance Policy Analytics Dashboard in Google Sheets at $9.99 — seven pages covering commissions, agent performance and policy revenue.
- Best value is the Insurance Policy and Premium Tracker at $6.99, which handles renewals and premium totals for a solo producer.
- All eight templates are one-time purchases between $6.99 and $14.99 — a commercial agency management system such as Applied Epic or EZLynx often bills $50–$150 per user every month.
- Formats are covered across Google Sheets, Excel and Power BI, so you can match the tool to the software your team already runs.
- Target a loss ratio near 60% and a client retention rate above 84%; every dashboard here surfaces the metrics you need to defend both.
Insurance agency templates compared
| Template | Format | Best For | Price |
|---|---|---|---|
| Insurance Policy Analytics Dashboard | Google Sheets | Best overall — full agency operations view | $9.99 |
| Insurance Brokers KPI Dashboard | Excel | Brokerages needing MTD/YTD vs target | $14.99 |
| Insurance KPI Dashboard | Power BI | Multi-branch agencies with large data | $11.99 |
| Healthcare Insurance KPI Dashboard | Excel | Health lines — claims & loss ratio | $14.99 |
| Insurance Policy & Premium Tracker | Google Sheets | Best value — solo agents & renewals | $6.99 |
| Reinsurance Services KPI Dashboard | Excel | Reinsurance & treaty desks | $14.99 |
| Healthcare Insurance KPI Dashboard | Power BI | Health insurers wanting interactive BI | $11.99 |
| Policy Advocacy Groups KPI Dashboard | Excel | Advocacy & membership organisations | $14.99 |
How we picked these insurance dashboard templates
We searched the full NextGenTemplates catalogue of roughly 6,900 published products for insurance, policy, premium, broker and reinsurance tools, then narrowed to eight that a working agency would actually open on a Monday morning. Selection criteria were simple: real premium, commission or claims KPIs; a genuine data-entry layer, not just a static picture; and multi-format coverage so Excel, Google Sheets and Power BI users are all served.
We excluded loosely related “insurance-themed” spreadsheets with no KPI logic, free downloads that stop at a blank table, and single-chart files that duplicate a page you already get inside the dashboards below. Prices shown are the current one-time list prices on the product pages. For deeper metric definitions, the Insurance Information Institute publishes the industry benchmarks we reference for loss ratio and retention.
The 8 best insurance agency templates for 2026
1. Insurance Policy Analytics Dashboard in Google Sheets — best overall
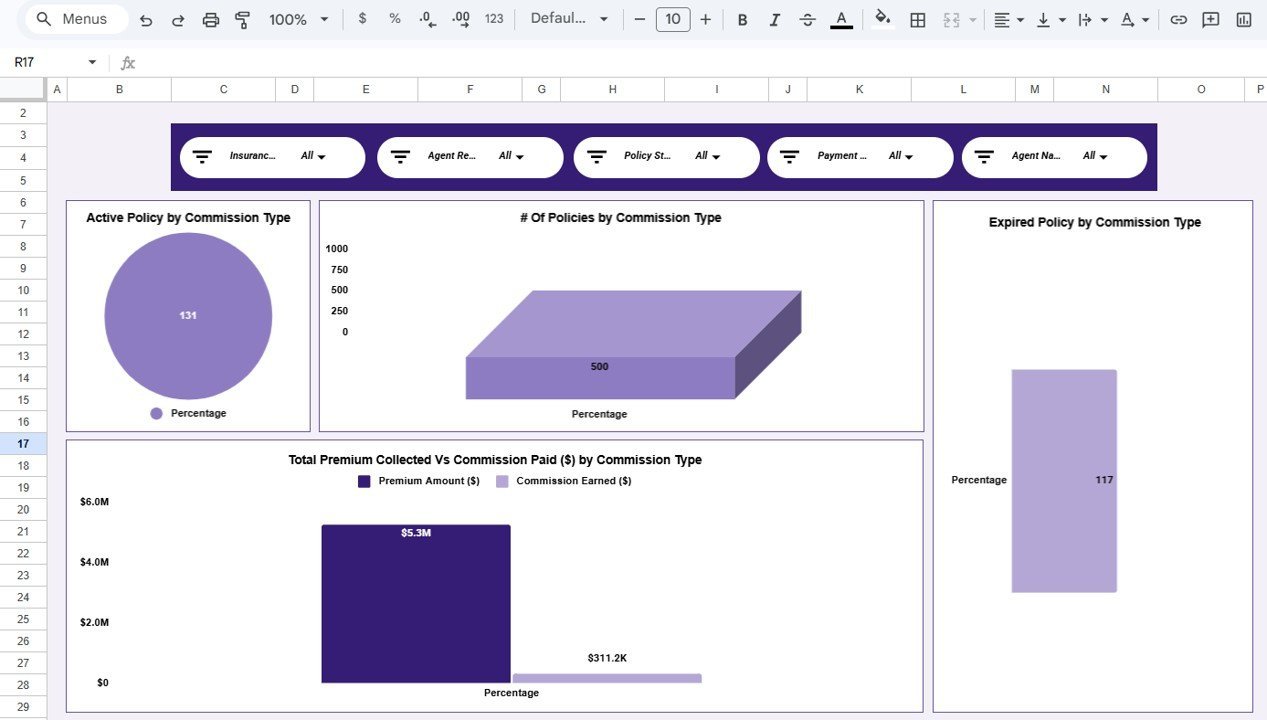
This is the most complete agency-operations view in the roundup, which is why it takes the top spot. Seven interactive pages — Overview, Commission Analysis, Agent Performance, Policy Revenue & Payouts, Monthly Trends, a Search sheet and the Data sheet — turn a raw policy register into a live control panel that any producer can read in seconds.
Who it is for: independent agencies and small brokerages that live in Google Workspace and want shared, real-time visibility without a per-seat SaaS contract.
- Five KPI cards: number of policies, total premium collected, commission paid, average premium and expired policies.
- 14+ auto-updating charts driven directly by the data sheet.
- Commission and agent-performance breakdowns for producer pay reviews.
Concrete uses: reconcile a book of 500 active policies and instantly see which agent wrote the $1.3M in premium; catch the 117 expired policies before they lapse for good; and spend a 15-minute Monday stand-up on the Agent Performance page instead of building a pivot table by hand. Price: $9.99. Get the Insurance Policy Analytics Dashboard →
Best for: the agency that wants one shared, always-on view of policies, premium and producer performance.
2. Insurance Brokers KPI Dashboard in Excel
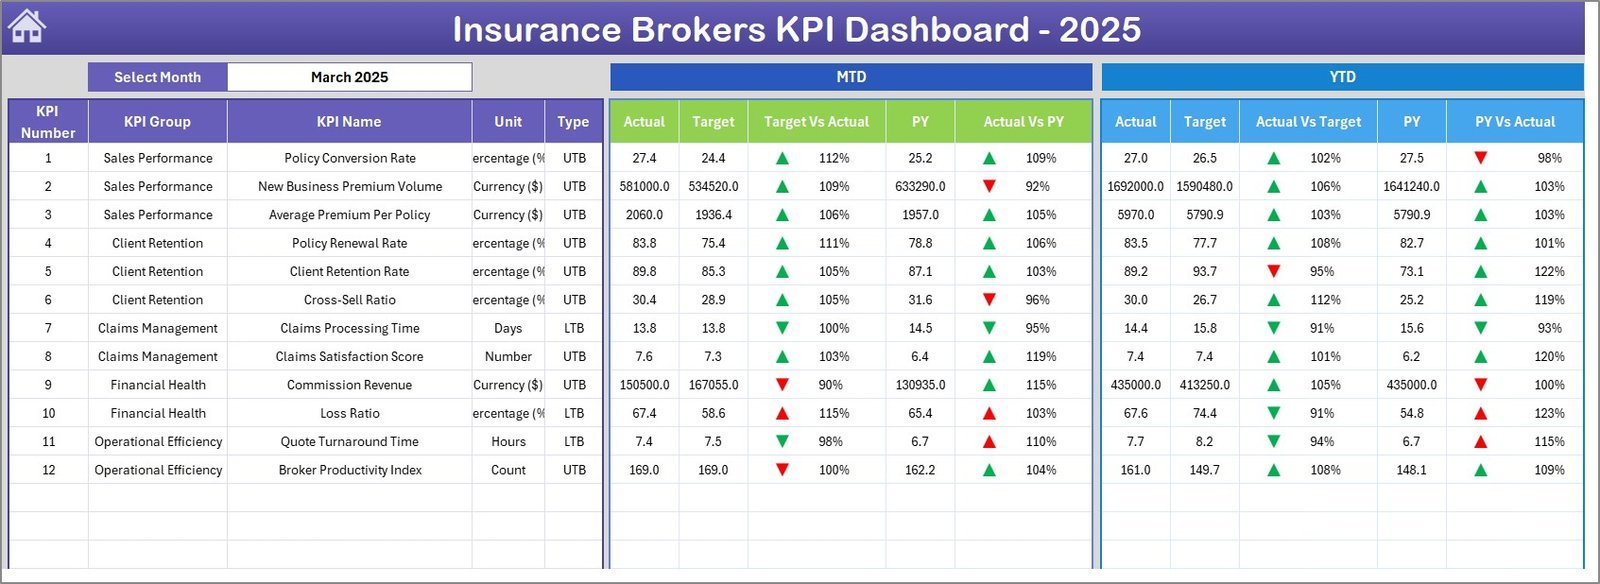
The classic Excel KPI scorecard, purpose-built for a brokerage that manages against targets. Seven worksheets — Home, Dashboard, KPI Trend, Actual Input, Target Input, Previous Year and KPI Definition — give you a disciplined month-close routine rather than a one-off chart.
Who it is for: broker principals and operations managers who report Actual vs Target vs Previous Year every month and need conditional-formatting arrows the board can read at a glance.
- MTD and YTD comparisons with automatic red/green trend arrows.
- A single month-selector dropdown that repaints the whole dashboard.
- A built-in KPI Definition sheet so every producer measures the same way.
Concrete uses: set a new-business target of $250k for Q1 and watch the variance update as you type actuals; compare this September’s retention against last September’s on the KPI Trend page; and hand a new hire the KPI Definition tab so “written premium” means the same thing across the desk. Price: $14.99. See the Insurance Brokers KPI Dashboard →
Best for: brokerages that run a formal monthly target-versus-actual review in Excel.
3. Insurance KPI Dashboard in Power BI

When a spreadsheet starts to strain, this Power BI report scales. It is built to slice claims, premiums and policy sales across branches, product lines and time, with the interactivity a data-heavy agency expects from a modern BI tool.
Who it is for: multi-branch agencies and MGAs whose policy and claims data has outgrown a single sheet and who already have Power BI Desktop on the team.
- Claims processing and profitability visuals with cross-filtering.
- Customer-retention insights: renewal rates, churn and satisfaction.
- Real-time refresh from your own data source once connected.
Concrete uses: compare loss ratios across five branches on one page and flag the office running above the 60% benchmark; drill from a national premium total into a single product line in two clicks; and publish the report so regional managers self-serve instead of emailing you for numbers. For more BI options, see our Power BI dashboard templates ranked by industry. Price: $11.99. Get the Insurance KPI Dashboard in Power BI →
Best for: larger agencies that need drill-down analytics rather than a fixed monthly sheet.
4. Healthcare Insurance KPI Dashboard in Excel

Health and benefits lines carry their own metrics, and this Excel dashboard is tuned for them. It monitors premiums, claims and loss ratios in one place so a benefits agency can see profitability without stitching together three reports.
Who it is for: agencies and brokers who write group health, medical or benefits business and need claims-versus-premium visibility.
- Premium, claims and loss-ratio tracking with real-time inputs.
- Claims-processing and revenue-monitoring visuals.
- Customisable KPIs you can rename to your book.
Concrete uses: watch the loss ratio move as claims post and act before it crosses 70%; separate revenue by plan type to see which carrier relationship actually pays; and keep a clean claims log you can export for a renewal negotiation. It pairs naturally with the finance KPIs every agency should track when you roll results up to the P&L. Price: $14.99. View the Healthcare Insurance KPI Dashboard →
Best for: health and benefits agencies focused on claims and loss-ratio control in Excel.
Not sure which format fits? Start with the Insurance Policy Analytics Dashboard in Google Sheets ($9.99) for shared team access, or the Insurance Brokers KPI Dashboard in Excel ($14.99) for a formal monthly review. Both cost less than a single month of a per-seat agency management system.
5. Insurance Policy and Premium Tracker in Google Sheets — best value

At $6.99 this is the cheapest way to get organised, and for a solo producer it may be all you need. It focuses on the two jobs that cost agencies money when they slip: tracking premium and never missing a renewal.
Who it is for: solo agents, new producers and side-hustle books that need structure without a dashboard learning curve.
- Total annual premium at a glance and annual premium by policy.
- Status tracking for active, expired, cancelled and renewal-stage policies.
- A Days-to-Renewal view that flags what is coming due.
Concrete uses: sort by Days to Renewal each Monday and call the five clients due in the next 30 days; spot the three high-premium policies that deserve a personal review; and see your true annual book value instead of guessing. When your book outgrows it, upgrade to pick 1. Compare it against other collaborative tools in our Google Sheets templates for teams guide. Price: $6.99. Get the Insurance Policy & Premium Tracker →
Best for: solo agents who want renewal discipline for under seven dollars.
6. Reinsurance Services KPI Dashboard in Excel
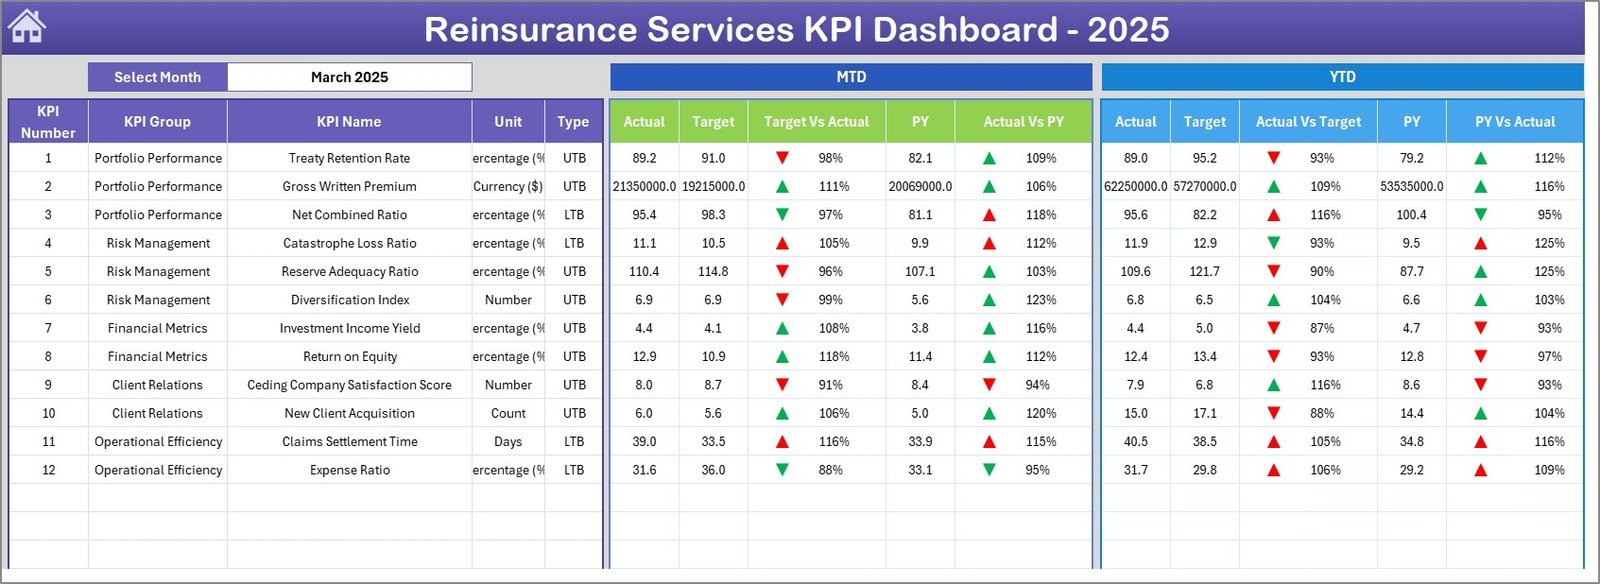
Reinsurance desks and treaty teams work at a different altitude, and this dashboard speaks their language. It shares the disciplined seven-sheet KPI architecture — Home, Dashboard, KPI Trend, Actual Input, Target Input, Previous Year and KPI Definition — applied to reinsurance service metrics.
Who it is for: reinsurance intermediaries, treaty analysts and specialty desks that report against targets and prior year.
- MTD and YTD Actual vs Target vs Previous Year with trend arrows.
- Month-selector dropdown that redraws the whole dashboard.
- A documented KPI Definition sheet for audit-ready consistency.
Concrete uses: track ceded premium and recovery performance month over month; benchmark this year’s treaty results against last year on one page; and standardise definitions across analysts so board packs reconcile. Because the engine matches pick 2, a group running both retail and reinsurance desks can keep one reporting rhythm. Price: $14.99. See the Reinsurance Services KPI Dashboard →
Best for: reinsurance and treaty desks that need a repeatable monthly scorecard.
7. Healthcare Insurance KPI Dashboard in Power BI

The Power BI counterpart to pick 4, for health and benefits teams that want interactive analysis rather than a fixed grid. It centres on the claims-payout ratio and customer satisfaction alongside premium performance.
Who it is for: health insurers and larger benefits agencies with Power BI who want to slice claims and satisfaction across segments.
- Claims-payout ratio analysis against premium.
- Premium, claims and customer-satisfaction KPIs in real time.
- Interactive filtering by plan, period or segment.
Concrete uses: isolate the plan whose claims-payout ratio is dragging the book; correlate satisfaction scores with renewal behaviour to protect retention above the 84% benchmark; and refresh the report on a schedule so leadership always sees current numbers. If you also manage the growth side of the house, layer in our sales KPIs to track in 2026. Price: $11.99. Get the Healthcare Insurance KPI Dashboard in Power BI →
Best for: health insurers that want interactive claims and satisfaction analytics.
8. Policy Advocacy Groups KPI Dashboard in Excel
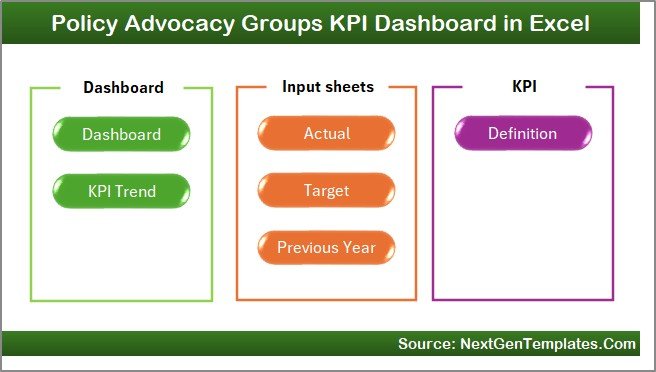
The specialist pick, for the policy and advocacy side of the insurance world rather than the sales desk. It measures campaign and engagement performance with the same MTD/YTD discipline as the KPI dashboards above.
Who it is for: policy advocacy groups, industry associations and membership organisations that report impact to a board.
- Interactive monthly dashboard with instant MTD and YTD results.
- Target-versus-actual tracking for campaigns and engagement.
- Year-over-year comparison with clear performance indicators.
Concrete uses: track engagement against a quarterly advocacy target; compare this year’s campaign reach with last year’s on one screen; and produce a board-ready page in minutes rather than rebuilding slides. It is the outlier in this list, but for association and advocacy teams it fills a gap no sales dashboard can. Price: $14.99. View the Policy Advocacy Groups KPI Dashboard →
Best for: advocacy and membership organisations reporting campaign impact.
How to choose between them
Match the tool to two things: the software your team already uses and the job you need done today.
- You want shared, live team access: pick a Google Sheets tool — the Policy Analytics Dashboard ($9.99) for a full agency view, or the Premium Tracker ($6.99) for a solo book.
- You run a formal monthly target review: choose an Excel KPI dashboard — Brokers, Reinsurance or Healthcare, all $14.99, all with the same MTD/YTD engine.
- Your data has outgrown a spreadsheet: move to Power BI — the Insurance KPI Dashboard ($11.99) for general lines or the Healthcare version ($11.99) for benefits.
- You measure advocacy, not sales: the Policy Advocacy Groups Dashboard ($14.99) is the only fit.
Still deciding on the wider stack? Our roundup of best-selling business templates and our industry template roundup for car dealerships show how the same dashboard patterns apply across sectors, as does our guide to the best travel agency and tour operator templates.
When an insurance agency template is NOT the right answer
A spreadsheet or dashboard is a reporting and analysis layer, not a system of record. Be honest about where it stops:
- You need policy binding, ACORD forms and carrier downloads. That is agency management system territory — Applied Epic, EZLynx, HawkSoft or AMS360. Those systems bill per user per month for a reason; a $14.99 template will never replace real-time carrier integration.
- You handle regulated PII at scale. A shared spreadsheet is not a compliance-grade store for sensitive client data. Keep records in a secure AMS and use these templates for aggregated KPIs only.
- You have more than a few thousand policies changing daily. Even the Power BI options assume a manageable refresh; very large, fast-moving books need a proper data warehouse behind the report.
- You need multi-user simultaneous data entry with audit trails. Google Sheets handles light collaboration, but true concurrent transactional entry belongs in dedicated software.
If none of those apply, a template is the faster, cheaper, more flexible choice — and you can always graduate later.
If your agency sells creative or media services instead of policies, see our ranked list of advertising and creative agency dashboard templates, which applies the same comparison to campaign KPIs and studio utilisation.
Frequently asked questions
What is an insurance dashboard template?
An insurance dashboard template is a pre-built spreadsheet or Power BI file that turns your policy, premium, commission and claims data into charts and KPI cards automatically. You enter or paste your data, and the dashboard updates so you can read agency performance at a glance without building reports by hand.
How much does an insurance agency template cost?
The eight templates in this guide range from $6.99 to $14.99 as one-time purchases. That compares with commercial agency management systems such as Applied Epic or EZLynx, which typically bill per user per month and can reach $50–$150 monthly, so a template pays for itself almost immediately.
Which format is best: Excel, Google Sheets or Power BI?
Choose Google Sheets for shared, real-time team access, Excel for a structured monthly target-versus-actual review, and Power BI when your data has grown large enough to need drill-down and scheduled refresh. All three formats are represented here, so you can match the tool to what your agency already runs.
Can these templates track policy renewals?
Yes. The Insurance Policy and Premium Tracker includes a Days-to-Renewal view that flags upcoming renewals, and the Policy Analytics Dashboard shows expired-policy counts. Sorting by renewal date each week is the single fastest way to protect retention and stop policies from lapsing unnoticed.
What is a good loss ratio for an insurance agency?
Most insurers target a loss ratio near 60%, meaning claims consume about 60 cents of every premium dollar, leaving room for expenses and profit under a combined ratio below 100%. The Healthcare Insurance dashboards here surface loss ratio directly so you can act before it drifts too high.
Do I need accounting software as well?
Usually yes. These dashboards report on premium, commission and claims performance, but they are not a general ledger. Most agencies pair a dashboard with accounting software for invoicing and reconciliation, then use the template to visualise KPIs and producer performance on top of that data.
Can I customise the KPIs and branding?
Yes. Every template lets you rename KPIs, adjust targets and edit labels, and the Excel and Google Sheets files let you change colours and add your logo. The KPI Definition sheets in the Excel dashboards also let you document exactly how each metric is calculated for your team.
Will these work for a solo agent or only large agencies?
Both. The $6.99 Insurance Policy and Premium Tracker is built for solo producers who just need renewal and premium discipline, while the Power BI dashboards scale to multi-branch agencies. Start small and upgrade to a full analytics dashboard as your book grows.
Are the templates a one-time purchase?
Yes. Each price shown is a single one-time purchase with no subscription, and you keep the file. That is the core cost advantage over per-seat agency management software, which charges every user every month for as long as you use it.
How do I get started after buying?
Open the file, replace the sample data on the Data sheet with your own policies, and the dashboard pages update automatically. Most agencies are up and running the same day. Watch walkthroughs on the NextGenTemplates YouTube channel to see each dashboard in action.
Get more insurance agency templates
Ready to run a tighter book? Start with our best overall pick, the Insurance Policy Analytics Dashboard in Google Sheets ($9.99), or grab the best-value Insurance Policy & Premium Tracker ($6.99). Prefer Excel or Power BI? Every option above is a one-time purchase between $6.99 and $14.99 — a fraction of a single month of agency management software.
See more industry dashboards in Power BI, browse marketing KPI dashboard templates for the growth side of your agency, and subscribe to the NextGenTemplates YouTube channel for setup tutorials.