

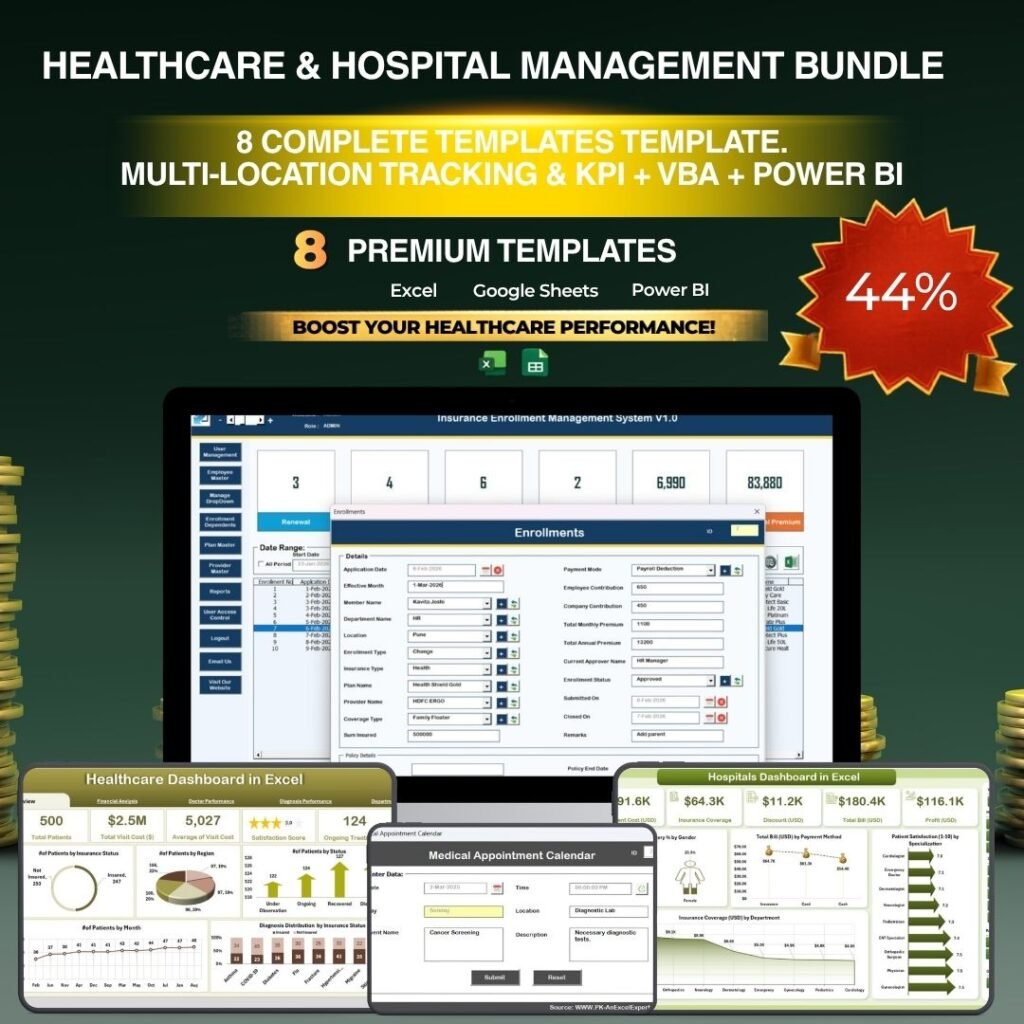
Healthcare Hospital Management Templates can turn scattered practice, clinic, veterinary, and hospital data into structured KPI reporting in hours instead of weeks. The need is not theoretical: CMS reported that U.S. health care spending reached $5.3 trillion in 2024, while the American Hospital Association counted 6,100 U.S. hospitals in FY 2024. With that scale, administrators need simple, repeatable ways to review visits, revenue, wait times, satisfaction, patient flow, readmissions, and departmental performance.
This guide compares eight paid NextGenTemplates dashboards for Excel and Power BI: Medical Practice, Veterinary Clinic, Hospital Patient Flow, and Hospitals KPI reporting, each available in a spreadsheet or Power BI format.
Want the metrics behind these tools? See our explainer on the 15 healthcare KPIs to track in 2026, each with its formula and benchmark range.
Key Features of These Healthcare Dashboard Templates
- Ready-to-use healthcare layouts: Each template starts with sample data, connected visuals, KPI cards, and structured fields.
- Excel and Power BI options: Choose Excel when your team wants workbook control, or Power BI when interactive reporting and slicers matter more.
- Operational and financial KPIs: Track visits, revenue, wait time, satisfaction, treatment cost, length of stay, readmissions, targets, and trends.
- Department-level analysis: Review departments, wards, admission types, physicians, veterinary services, diagnoses, and monthly performance.
- One-time purchases: These are downloadable templates, not monthly SaaS subscriptions.
 Launch offer
From your first Pivot Table to the Data Model, DAX, Power Query and a one-page KPI dashboard. 11h 51m of video by PK, with practice files, quizzes and a capstone.
Dashboard Pages Explained
The Medical Practice dashboards include Overview, Department Analysis, Patient Insights, Financial Review, and Operational KPIs. They are useful for outpatient clinics, specialty practices, and private medical offices that need revenue, visits, wait time, completion rate, and satisfaction views.
The Veterinary Clinic dashboards focus on pet visits, treatment insights, veterinarian performance, revenue breakdown, visit duration, bill per visit, consultation fees, and patient analysis. The Hospital Patient Flow dashboards go deeper into capacity and quality with admissions, discharges, bed type, wards, length of stay, wait time, readmissions, and satisfaction by attending physician. The Hospitals KPI dashboards are broader KPI scorecards for actual vs target tracking, MTD/YTD comparison, prior year comparison, and KPI definition governance.
Excel vs Power BI for Healthcare Reporting
| Decision Area | Excel Dashboard Templates | Power BI Dashboard Templates |
|---|---|---|
| Best fit | Small teams, analysts, and managers who already work in Excel | Teams that want interactive slicers, report pages, and cleaner visual exploration |
| Setup | Enter or paste data into workbook sheets and refresh pivots or formulas | Open the .pbix file, connect the data source, and refresh the model |
| Collaboration | Works well with OneDrive or SharePoint version control | Works best when published through Power BI Service permissions |
| Learning curve | Lowest for spreadsheet users | Moderate, especially for data model or refresh customization |
| Authority reference | Good for familiar spreadsheet control | Microsoft describes Power BI Desktop as a free Windows app for interactive reports and semantic models |
Who Should Use These Templates
These dashboards are built for medical practice managers, hospital administrators, veterinary clinic owners, clinical operations teams, healthcare consultants, finance analysts, quality improvement teams, and department heads who need clearer reporting without building a system from zero.
They are especially useful when leadership needs a clean monthly review, when data lives in spreadsheets, or when a team wants to pilot KPI reporting before investing in a larger BI implementation.
Use Cases
- Medical practice review: Monitor visits, revenue, wait time, patient satisfaction, and department performance.
- Veterinary operations: Track visit duration, treatment categories, consultation fees, billing, and veterinarian performance. For a full ranked comparison, see our guide to the 6 best veterinary clinic templates for 2026.
- Patient flow analysis: Review admission type, discharge patterns, ward usage, bed type, wait time, length of stay, and readmissions.
- Hospital KPI governance: Compare actuals against targets, monitor MTD and YTD performance, and document KPI definitions.
Advantages
The biggest advantage is speed. A blank workbook or empty Power BI report takes time to design, test, and format. A ready-made dashboard gives your team a working structure immediately. The second advantage is consistency: when KPI names, definitions, pages, and visuals are already arranged, managers can spend more time interpreting performance and less time assembling slides. The third advantage is flexibility, because every template can be adapted to your local departments, services, providers, and reporting cadence.
Opportunities for Improvement
Templates still depend on good source data. Before using any dashboard for decision-making, define the data owner, update frequency, KPI formulas, and privacy process. Avoid storing direct patient identifiers in reporting files unless your organization has approved controls. For Power BI, document the data refresh path and access permissions. For Excel, protect formulas and keep a dated backup before major changes.
Best Practices
- Start with five to ten KPIs that leadership actually reviews each month.
- Use consistent department, ward, provider, and service names across all source data.
- Separate raw data from dashboard pages so formulas and charts stay stable.
- Review trends and targets together; a good month may still miss the target.
- Use patient-flow dashboards for throughput and quality conversations, not only finance reviews.
- Keep a KPI definition sheet or documentation page for every recurring metric.
Running a dental office? See our ranked guide to the best dental practice management templates in Excel, Google Sheets and Power BI.
Hospitality teams face a similar reporting problem to hospitals: occupancy, length of stay and guest satisfaction. See our ranked list of hotel and resort dashboard templates for Excel, Power BI and Google Sheets.
Explore Relevant Templates
| Template | Platform | Best For | Sale Price |
|---|---|---|---|
| Medical Practice Dashboard in Power BI | Power BI | Interactive clinic performance reporting | $17.99 |
| Medical Practice Dashboard in Excel | Excel | Spreadsheet-based medical practice KPIs | $17.99 |
| Veterinary Clinic Dashboard in Power BI | Power BI | Clinic visits, treatments, vets, and revenue | $17.99 |
| Veterinary Clinic Dashboard in Excel | Excel | Veterinary reporting in a workbook | $17.99 |
| Hospital Patient Flow Dashboard in Power BI | Power BI | Admissions, capacity, quality, and flow | $17.99 |
| Hospital Patient Flow Dashboard in Excel | Excel | Patient flow analysis in Excel | $17.99 |
| Hospitals KPI Dashboard in Power BI | Power BI | Hospital scorecards and target tracking | $11.99 |
| Hospitals KPI Dashboard in Excel | Excel | MTD/YTD hospital KPI workbook reporting | $14.99 |
1. Medical Practice Dashboard in Power BI
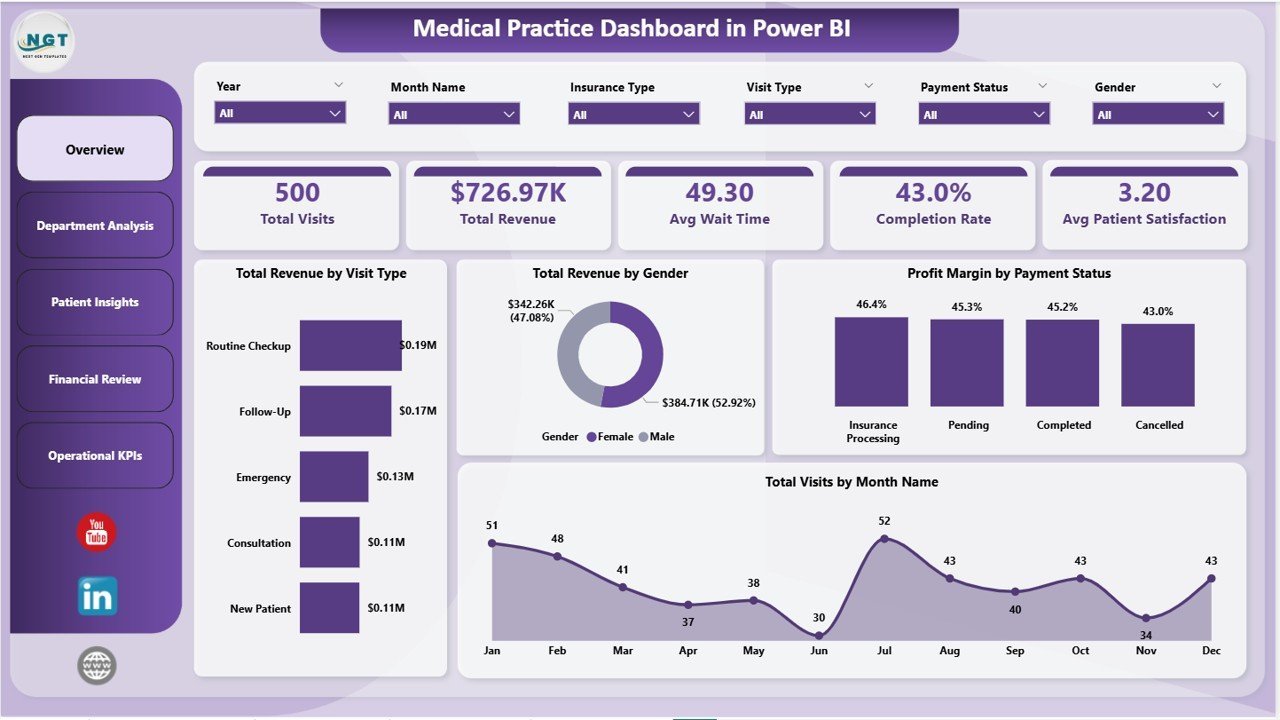
Use this Power BI template when a medical practice needs interactive pages for overview KPIs, department analysis, patient insights, financial review, and operational performance.
View Medical Practice Power BI Dashboard
2. Medical Practice Dashboard in Excel
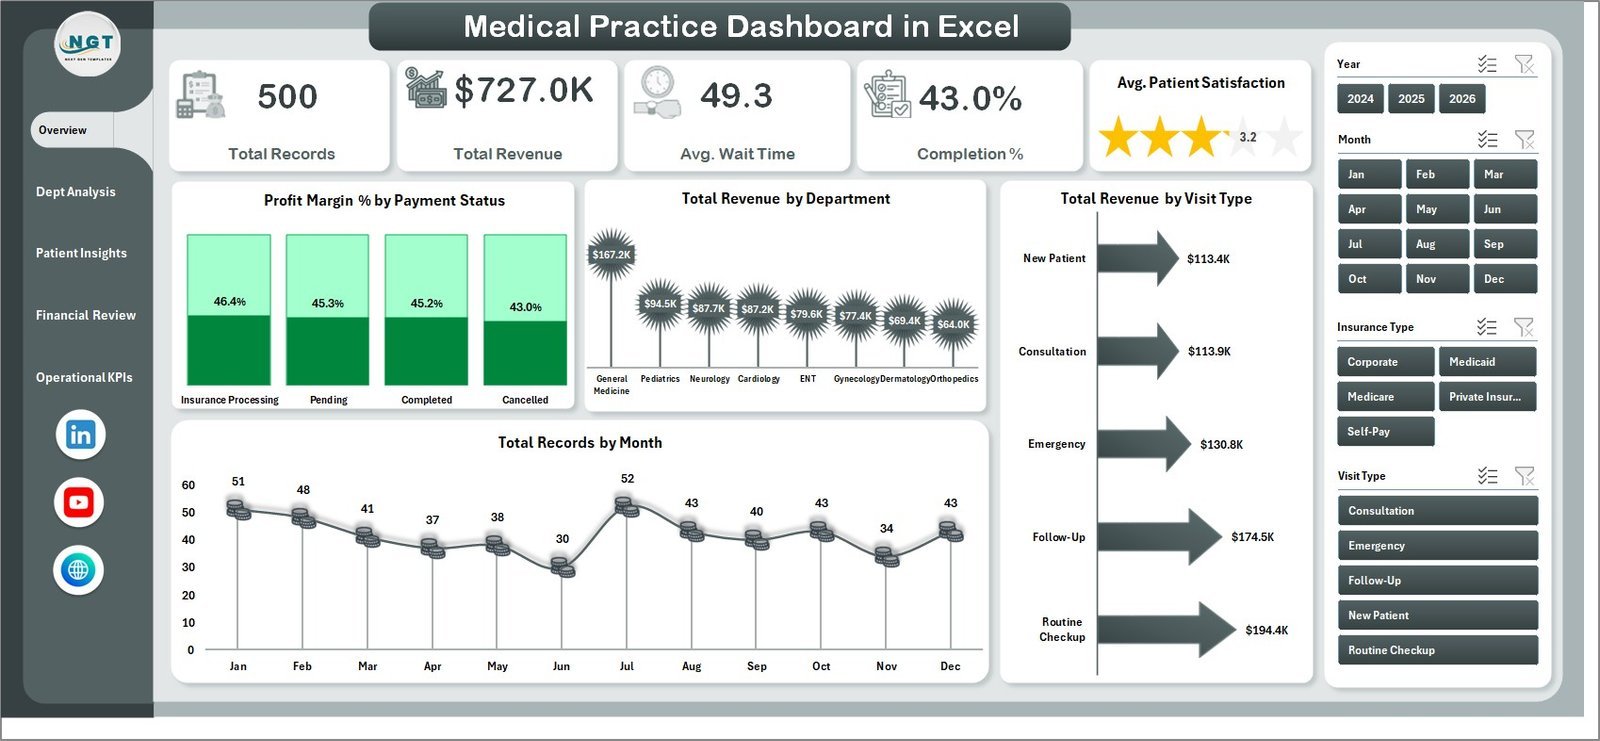
This Excel version is ideal for practices that want KPI cards, charts, data sheets, and support sheets inside a familiar workbook.
View Medical Practice Excel Dashboard
3. Veterinary Clinic Dashboard in Power BI
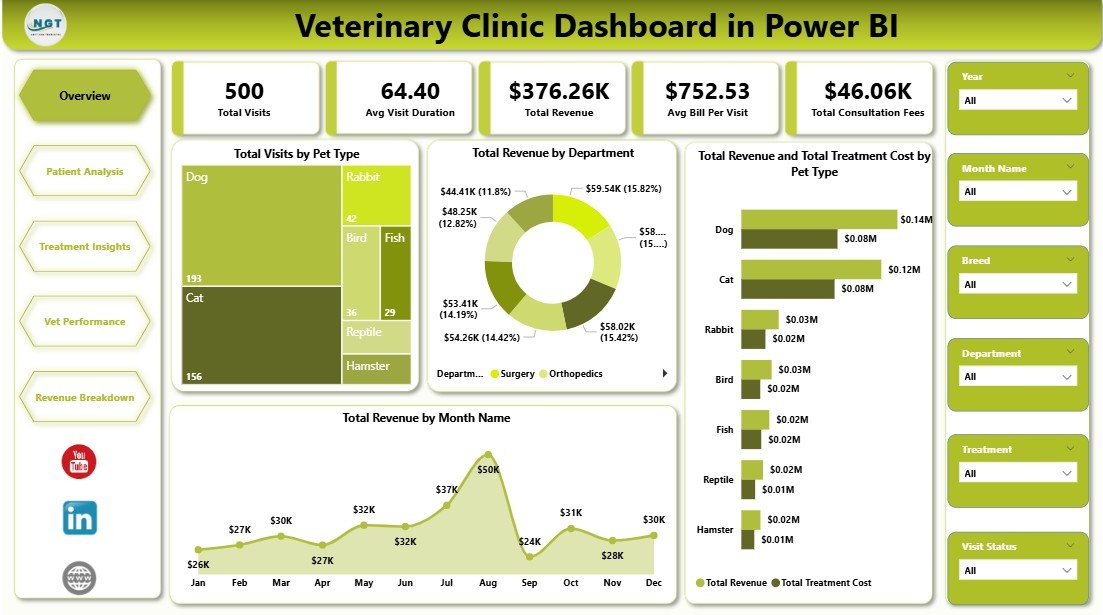
This Power BI dashboard helps veterinary teams review visits, treatment insights, vet performance, revenue breakdown, average bills, and consultation fees.
View Veterinary Power BI Dashboard
4. Veterinary Clinic Dashboard in Excel
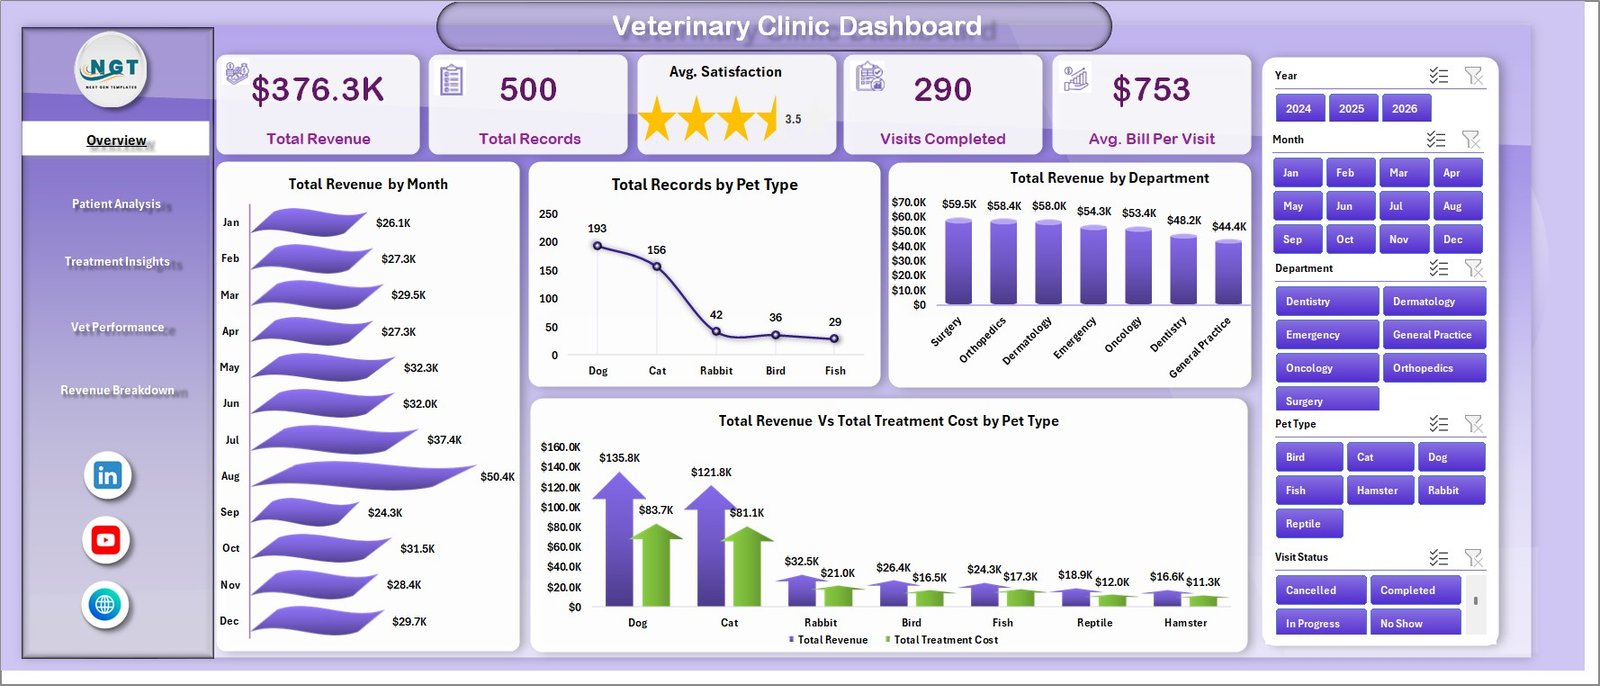
Choose the Excel version when the clinic wants pivot-driven reporting for revenue, records, satisfaction, completed visits, and average bill per visit.
View Veterinary Excel Dashboard
5. Hospital Patient Flow Dashboard in Power BI
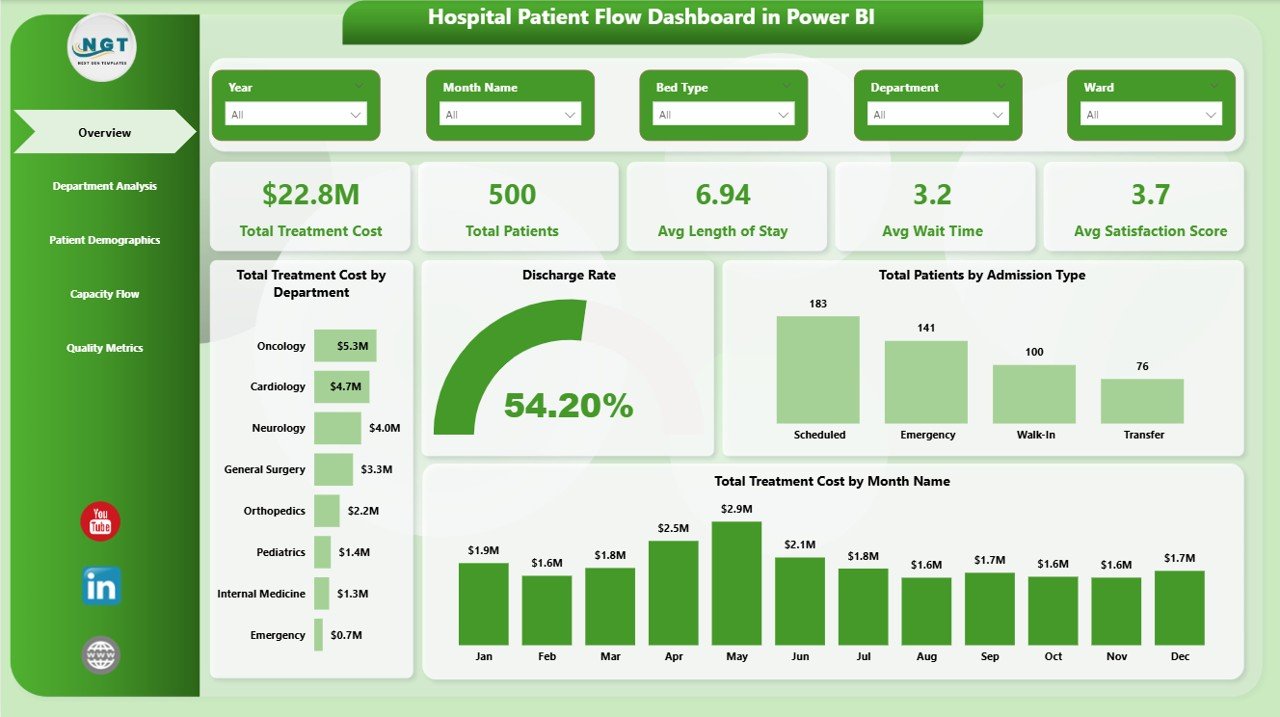
This dashboard is built for patient movement, capacity, treatment cost, length of stay, wait time, satisfaction, readmissions, and quality metrics.
View Patient Flow Power BI Dashboard
6. Hospital Patient Flow Dashboard in Excel
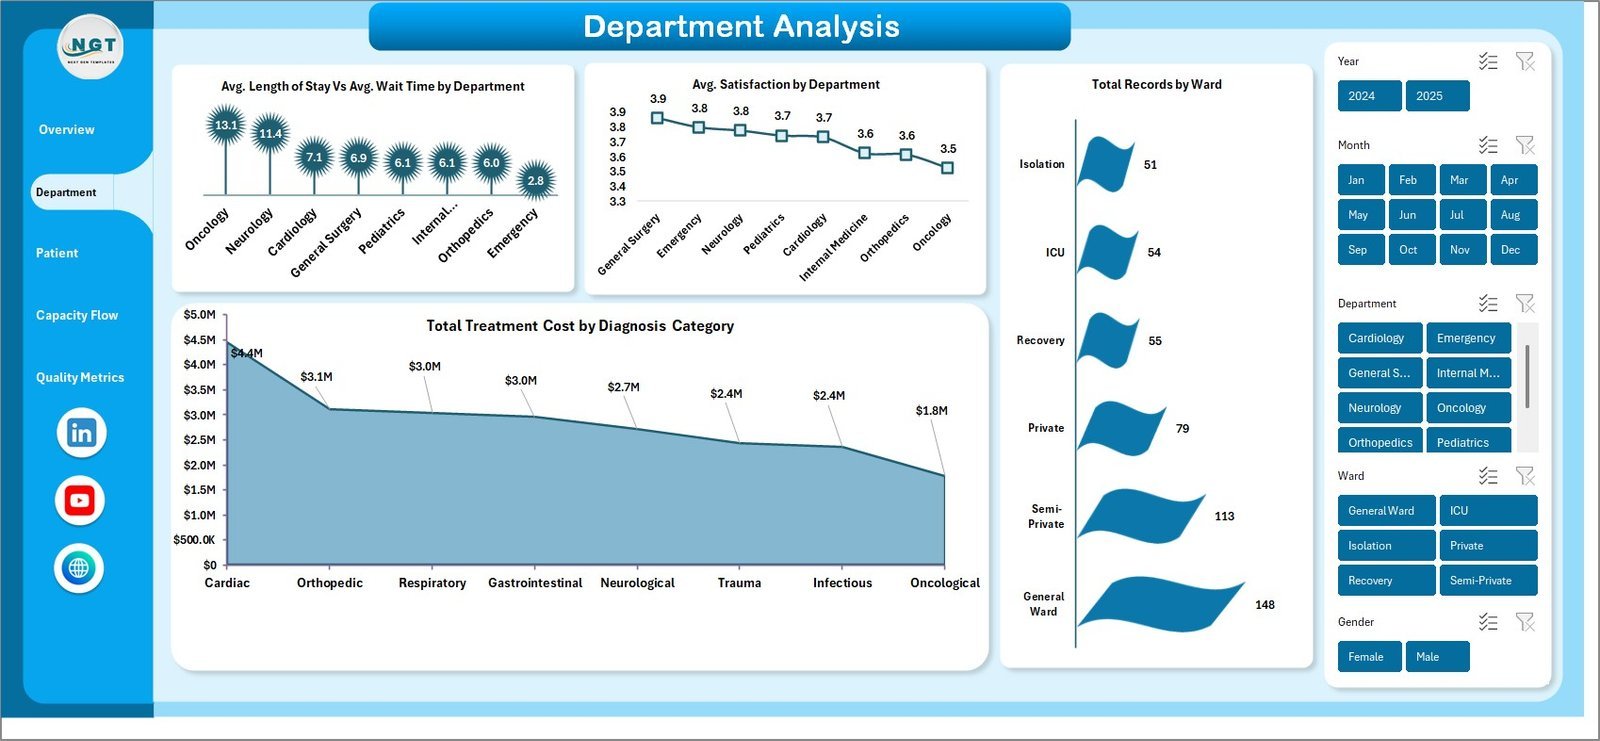
The Excel version supports hospital teams that prefer workbook-based capacity, demographics, department, and quality analysis.
View Patient Flow Excel Dashboard
7. Hospitals KPI Dashboard in Power BI
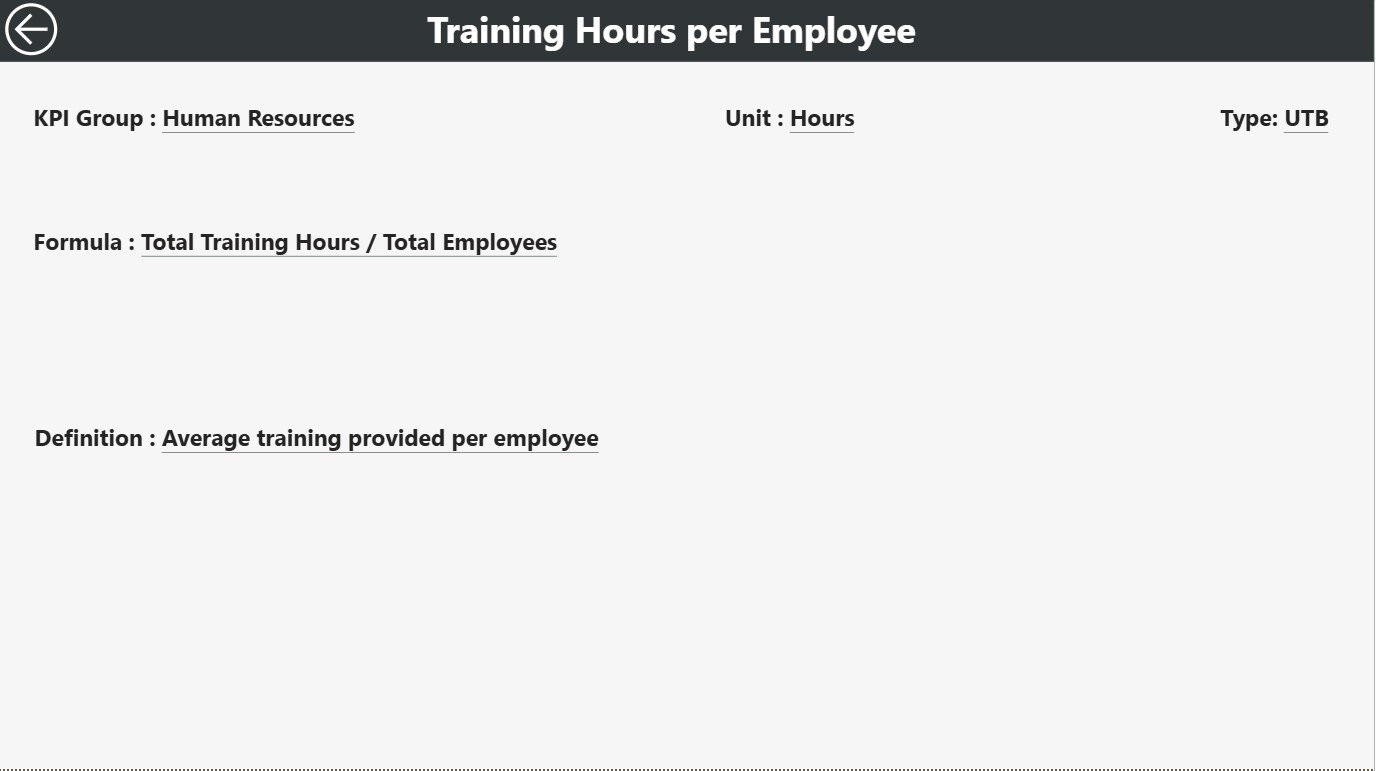
This scorecard-style Power BI template is useful for KPI trend review, actual vs target comparison, previous year benchmarking, and KPI definition transparency.
View Hospitals KPI Power BI Dashboard
8. Hospitals KPI Dashboard in Excel

Use this Excel KPI dashboard for MTD/YTD hospital reporting, customizable KPI definitions, target tracking, and leadership review packs.
View Hospitals KPI Excel Dashboard
Best Value Bundle Option
If you want a broader healthcare toolkit beyond these eight dashboard choices, the Healthcare & Hospital Management Bundle packages eight premium healthcare templates across Excel, Power BI, and VBA for $79.99. It is a strong option for teams that want dashboards plus operational tools such as hospital management, dental clinic management, appointment scheduling, and KPI tracking.
Looking after the building as well as the patients? Our guide to the best facility management templates covers maintenance requests, work orders, service SLAs and equipment upkeep for hospital and clinic sites.
Frequently Asked Questions
Which healthcare dashboard template should I start with?
Start with Medical Practice if you run a clinic, Veterinary Clinic if you manage pet-care services, Hospital Patient Flow if throughput and capacity are the focus, and Hospitals KPI if leadership needs a broad scorecard.
Are Excel or Power BI templates better for hospitals?
Excel is usually better for fast workbook control and smaller teams. Power BI is better when you need interactive filtering, report pages, and a cleaner executive analytics experience.
Do these templates include sample data?
Yes. The templates include sample data so users can understand the layout before replacing it with their own records.
Are these one-time purchases?
Yes. The individual dashboards listed here are downloadable paid templates on NextGenTemplates, with one-time pricing shown in the comparison table.
Can I customize the KPIs?
Yes. The templates are built to be customized. You can adapt KPI names, departments, categories, targets, and source data to match your organization.
About the Author
Built by PK – Microsoft Certified Professional with 15+ years of Excel, Google Sheets, and Power BI experience. Founder of NextGenTemplates, reaching 300K+ subscribers across YouTube channels. Every template is hand-built and tested before release.
Conclusion
Healthcare reporting works best when operational, financial, quality, and patient-flow metrics are visible in one place. These eight Excel and Power BI dashboards give medical practices, veterinary clinics, and hospitals a practical starting point for KPI reviews, performance meetings, and data-driven improvement. For tutorials and walkthroughs, visit the NextGenTemplates YouTube channel.
Best next step: choose the dashboard that matches your workflow, or review the Healthcare & Hospital Management Bundle if you want a wider healthcare template stack.
Last updated: July 6, 2026.
Related reading: Not sure which license you need? See Template Licensing Explained: Personal, Commercial and Team Use for a plain-English breakdown of personal, commercial and team use with a full pricing table.
Running a multi-location network outside healthcare? See the 6 best franchise management dashboard templates for 2026, covering royalty billing and outlet-level KPI tracking.