

The best Power BI Premium alternatives in 2026 are pre-built Excel, Google Sheets, Power BI and HTML dashboard templates that deliver the same executive reporting without a per-user or per-capacity subscription. For most small teams, a one-time template between $7.99 and $17.99 replaces the modules they actually use — dashboards, KPIs and refreshable reports — at a fraction of Premium’s recurring cost.
Last updated: August 2026
Key takeaways
- Power BI Premium Per User lists at roughly $24 per user per month, and the capacity path (now Microsoft Fabric F64) starts near $5,000 per month — verify current figures on Microsoft’s official pricing page.
- Small teams churn off Premium for three reasons: seat cost that scales with headcount, paid modules nobody opens, and the admin overhead of capacity governance.
- The Augmented Analytics Dashboard in Power BI ($17.99, one-time) is our best overall pick — enterprise BI polish in the same tool, no subscription.
- The Data Analytics Dashboard Report in Excel ($7.99) is the best-value swap for a team that just needs charts, slicers and a refreshable data model.
- Power BI Premium is still the right call for real-time streaming, multi-terabyte models, paginated report distribution to thousands, and strict row-level-security governance — a template cannot replace that.
Why small teams leave Power BI Premium in 2026
Power BI Premium is priced for enterprises, and its public pricing shows it. Microsoft’s current published rates put Power BI Pro at about $14 per user per month and Power BI Premium Per User (PPU) at about $24 per user per month, while the former Premium capacity SKUs have been folded into Microsoft Fabric, where the free-viewer-enabled F64 capacity lists at roughly $5,000 per month pay-as-you-go. Always confirm the live numbers on the official Power BI pricing page, because Microsoft has revised these figures more than once.
For a five-person operations team, PPU alone is roughly $1,440 a year, every year, with nothing owned at the end. Three churn triggers show up again and again:
- Seat cost that scales with headcount. Every new analyst, every stakeholder who wants to click a slicer, is another paid seat. Premium’s free-viewer benefit only kicks in at the F64 capacity tier, which is a five-figure annual commitment most small teams cannot justify.
- Paid modules nobody opens. Premium bundles AI, paginated reports, dataflows, deployment pipelines and advanced governance. A team that only builds a monthly KPI deck is paying for a suite it never touches.
- Admin overhead. Capacity planning, workspace governance, gateway management and refresh scheduling need an owner. That is a hidden salary cost on top of the license, and small teams rarely have a dedicated BI admin.
A pre-built template flips the model: pay once, own the file, edit it in software you already have. Below we rank eight templates that cover the reporting jobs teams actually leave Premium to keep doing — and show exactly which Premium feature each one replaces.
Power BI Premium features vs the NGT template that covers them
| Power BI Premium feature | NGT template that covers it | Format | Price |
|---|---|---|---|
| Executive analytics workspace / augmented analytics | Augmented Analytics Dashboard in Power BI | Power BI | $17.99 |
| Refreshable data model + interactive report | Data Analytics Dashboard Report in Excel | Excel | $7.99 |
| Incident / operational reporting app | Office Incident Report Dashboard in Power BI | Power BI | $17.99 |
| Same incident reporting, no Power BI seat | Office Incident Report Dashboard in Excel | Excel | $17.99 |
| HR / people analytics content pack | Employee Recognition Dashboard Report in Excel | Excel | $17.99 |
| Marketing / channel analytics report | YouTube Channel Analytics Dashboard in Excel | Excel | $17.99 |
| Embedded / web-published dashboard | Etsy Seller Analytics Dashboard in HTML | HTML | $12.99 |
| Shareable web dashboard, no license to view | YouTube Channel Analytics Dashboard in HTML | HTML | $12.99 |
Power BI Premium alternatives compared
| Template | Format | Best for | Price |
|---|---|---|---|
| Augmented Analytics Dashboard in Power BI (Best overall) | Power BI | Staying in Power BI without a Premium bill | $17.99 |
| Data Analytics Dashboard Report in Excel (Best value) | Excel | Refreshable analytics on any PC | $7.99 |
| Office Incident Report Dashboard in Power BI | Power BI | EHS / operations incident tracking | $17.99 |
| Office Incident Report Dashboard in Excel | Excel | Incident reporting without a Power BI seat | $17.99 |
| Employee Recognition Dashboard Report in Excel | Excel | HR / people analytics | $17.99 |
| YouTube Channel Analytics Dashboard in Excel | Excel | Marketing channel reporting | $17.99 |
| Etsy Seller Analytics Dashboard in HTML | HTML | Web-embedded e-commerce metrics | $12.99 |
| YouTube Channel Analytics Dashboard in HTML | HTML | Zero-license shareable web dashboard | $12.99 |
How we picked these
We searched the full NextGenTemplates catalog of several hundred paid dashboards and shortlisted templates that map directly onto the jobs Power BI Premium is bought to do: executive dashboards, refreshable data models, operational reporting, HR and marketing analytics, and web-shareable dashboards. We prioritized products that are genuinely enterprise-grade in layout and interactivity, span more than one format so a leaving team can self-select, and carry a one-time price under $20. We excluded single-chart freebies, novelty trackers and anything that could not stand in for a real Premium report. Every template below is a paid product with a live product page, current USD pricing and downloadable files you own outright.
The 8 best Power BI Premium alternatives for 2026
1. Augmented Analytics Dashboard in Power BI — best overall
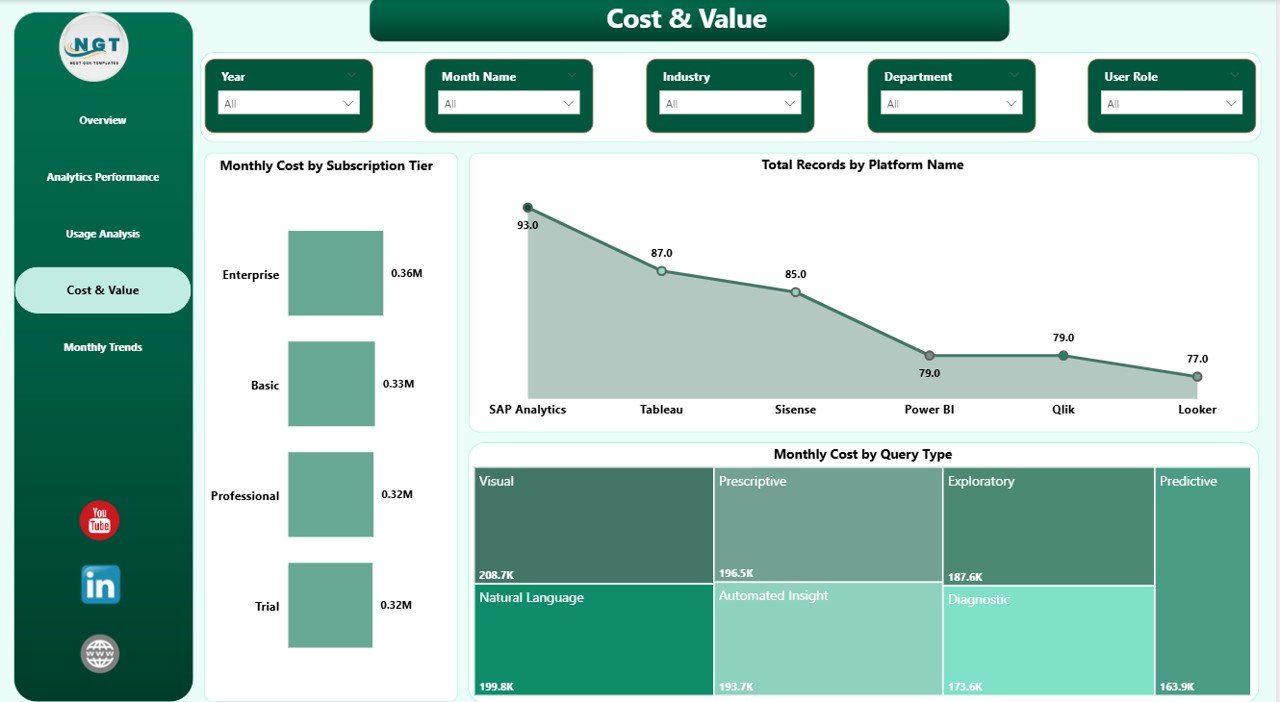
What it is: A polished, enterprise-styled Power BI report that gives you the augmented-analytics look and feel of a Premium workspace — decomposition-style visuals, KPI cards and drillable pages — as a one-time file rather than a subscription.
Who it is for: Teams that like Power BI Desktop but refuse to pay Premium Per User or stand up a Fabric capacity just to publish one executive report.
What is inside:
- A pre-built semantic model with date table and DAX measures
- Multi-page layout with synced slicers and a KPI overview page
- Custom theme and branded chrome you can restyle in minutes
- Sample data you swap for your own with a single query edit
Because Power BI Desktop is free, this template lets a five-person team run a real BI report for $17.99 total instead of about $120 a month in PPU seats. Swap the data source, refresh, and export to PDF for stakeholders who do not have a Power BI login. For most teams leaving Premium, this is the closest one-to-one replacement — same tool, same file format, none of the recurring cost. See our wider Power BI dashboard templates ranked by industry guide for more in the same tool.
Best for: Staying inside Power BI while cutting the licensing bill to zero. Get it for $17.99 →
2. Data Analytics Dashboard Report in Excel — best value
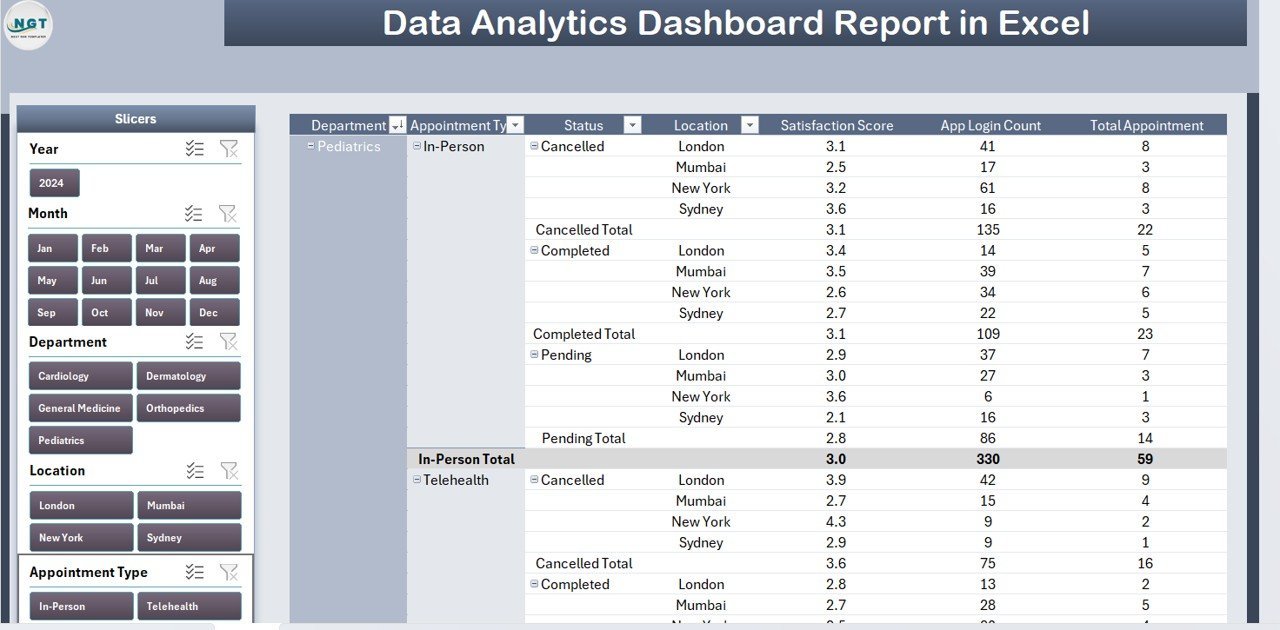
What it is: A refreshable analytics dashboard built entirely in Excel — pivot-driven charts, slicers and a clean summary page that behaves like a lightweight BI report.
Who it is for: Teams whose stakeholders already have Microsoft 365 and just need charts, filters and a repeatable monthly refresh — no BI platform required.
What is inside:
- A structured data sheet feeding pivot tables and charts
- Slicers and timelines for interactive filtering
- KPI summary cards at the top of the report
- A print-ready layout for PDF distribution
At $7.99 this is the cheapest way to replace a basic Premium report. Everyone who can open Excel can open it — no per-viewer seat, no capacity, no gateway. Drop 12 months of numbers into the data sheet and the whole report redraws. It is the honest answer for a team that was over-buying Premium for what amounts to a monthly KPI deck. Pair it with a formal Google Sheets reporting alternative if part of your team lives in Sheets.
Best for: The lowest-cost, widest-reach swap for a simple Premium report. Get it for $7.99 →
3. Office Incident Report Dashboard in Power BI
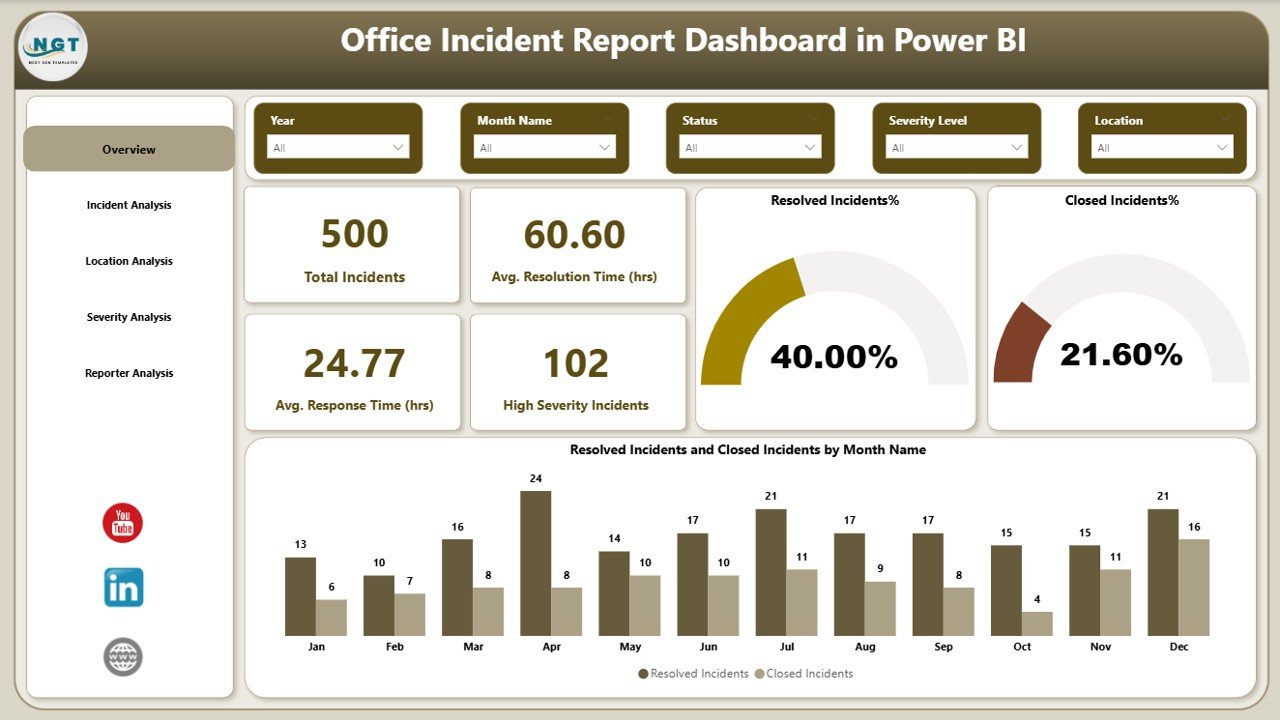
What it is: A ready-made EHS and operations incident dashboard in Power BI — total incidents, resolution and response times, severity breakdowns and monthly trends.
Who it is for: Safety, facilities and operations teams that would otherwise build an incident app inside a Premium workspace.
What is inside:
- KPI cards for total incidents, average resolution and response hours
- Severity and status slicers wired across the report
- Resolved-vs-closed trend visuals by month
- A data model you point at your own incident log
A team tracking 500 incidents a year gets the same categorical breakdowns and gauges Premium would give them, for a single $17.99 payment. Because it is a standard PBIX-style project, you can publish it to the free Power BI service tier or simply share exported pages. This is a strong pick when the reason you were on Premium was one operational report, not a whole BI estate.
Best for: EHS and operations incident tracking in Power BI. Get it for $17.99 →
4. Office Incident Report Dashboard in Excel
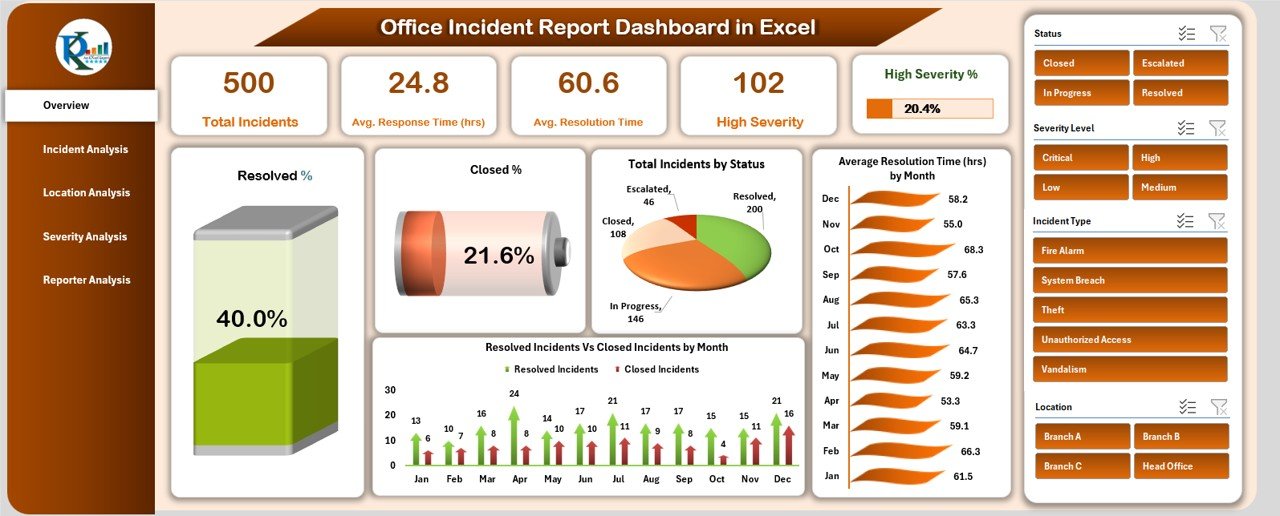
What it is: The same incident-reporting logic as the Power BI version, rebuilt in Excel so it runs on any machine with Office and needs no BI licence to view.
Who it is for: Smaller safety and admin teams who want incident analytics but have no Power BI footprint at all.
What is inside:
- An incident log sheet with dropdown-driven data entry
- Auto-updating KPI cards and severity charts
- Month-over-month trend and resolution analysis
- A clean, printable summary dashboard
Choosing this over the Power BI edition removes the last dependency on Microsoft’s BI stack entirely — no service, no seats, no capacity. It is ideal for organizations that were only using Premium because “that is where the incident report lived.” At $17.99 it pays for itself against a single month of one PPU seat, and everyone in the building can open it.
Best for: Incident reporting with zero Power BI dependency. Get it for $17.99 →
5. Employee Recognition Dashboard Report in Excel
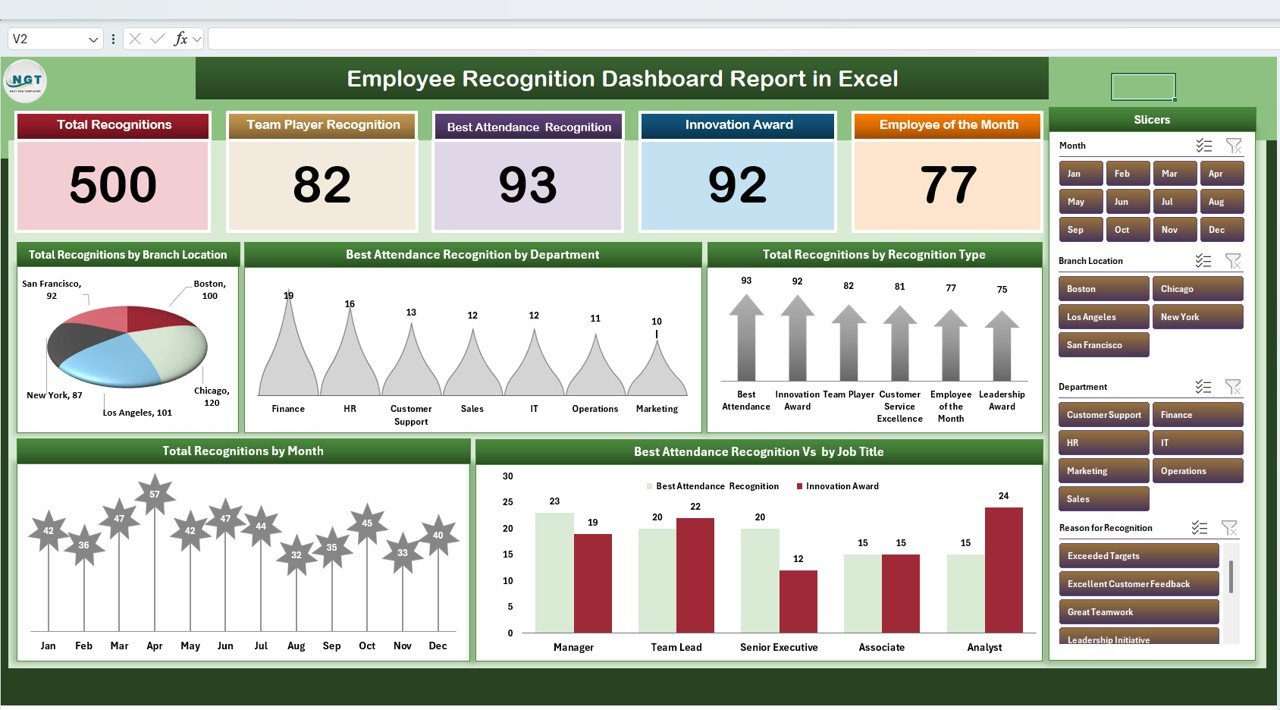
What it is: A people-analytics dashboard tracking recognition, awards and engagement metrics — the kind of HR content pack a company might otherwise build on a Premium workspace.
Who it is for: HR and people teams that need a shareable engagement report without buying seats for every manager who wants to read it.
What is inside:
- Recognition counts by department, program and period
- Top-performer and award-type breakdowns
- Trend charts for participation over time
- Slicer-driven filtering by team and month
HR reporting is a classic case of Premium over-purchase: a handful of dashboards read by managers who each would need a paid viewer seat. This Excel report is distributed as a file — email it, embed it, or export a PDF. For deeper people-metrics comparisons, our BambooHR alternatives in Excel roundup covers adjacent HR templates worth pairing with it.
Best for: HR engagement and recognition reporting. Get it for $17.99 →
6. YouTube Channel Analytics Dashboard in Excel
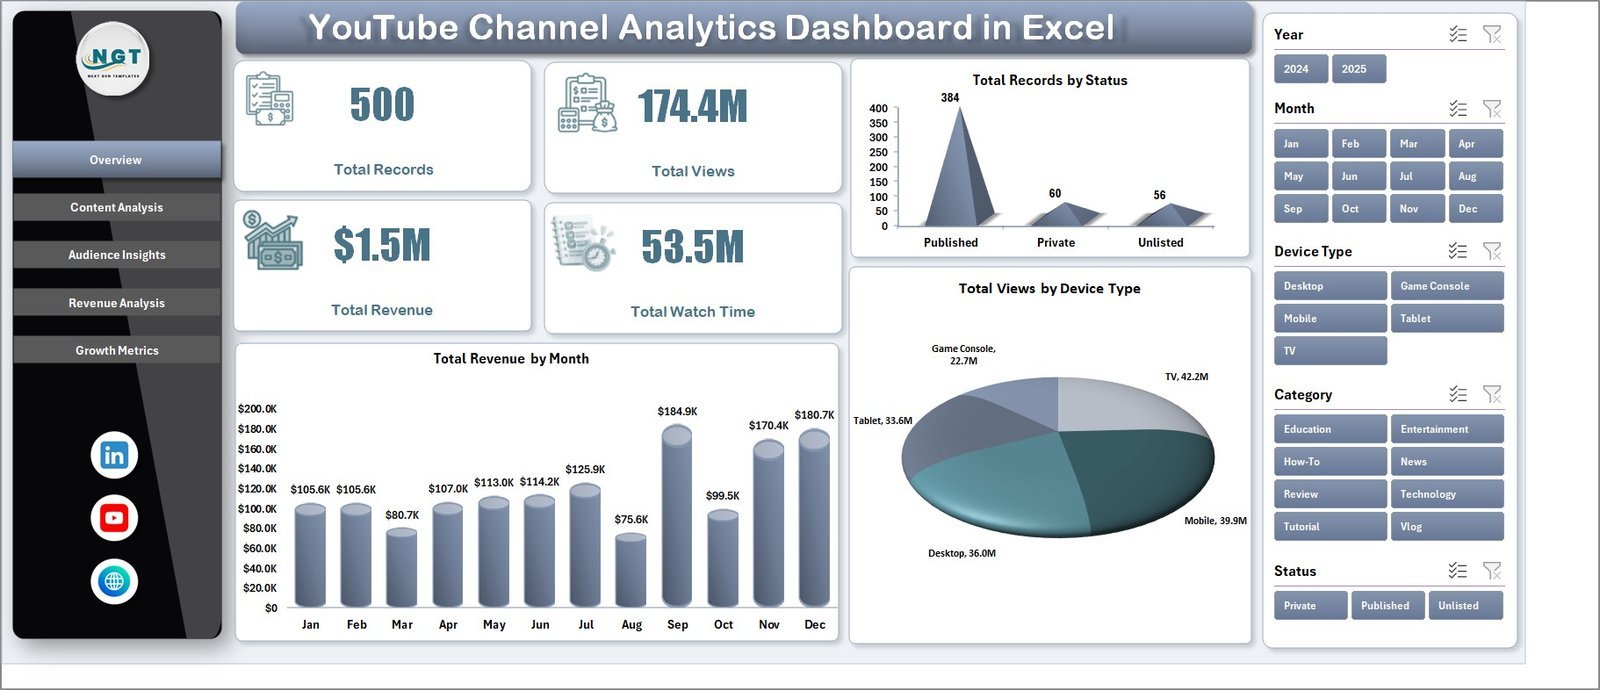
What it is: A marketing-analytics dashboard for channel performance — views, watch time, subscriber growth and top-video breakdowns — in a refreshable Excel workbook.
Who it is for: Marketing and content teams that need a recurring channel report but do not want to model social data inside an enterprise BI platform.
What is inside:
- KPI cards for views, watch time and subscriber change
- Top-content and traffic-source breakdowns
- Monthly trend charts with slicer filtering
- A tidy import sheet for exported analytics data
Marketing dashboards change constantly, and paying a per-user Premium bill so three marketers can eyeball a channel report is poor economics. Drop your exported YouTube Studio data into the sheet and the report rebuilds. At $17.99 it replaces a recurring analytics module you were renting. It also pairs naturally with the HTML edition below when you need to publish the same metrics to the web.
Best for: Recurring marketing channel reporting in Excel. Get it for $17.99 →
7. Etsy Seller Analytics Dashboard in HTML

What it is: A self-contained HTML dashboard for e-commerce metrics — sales, orders, revenue and product performance — that opens in any browser with no software licence at all.
Who it is for: Sellers and small e-commerce teams who want a shareable web dashboard without paying to embed Premium content or buy viewer seats.
What is inside:
- Interactive charts rendered directly in the browser
- Revenue, order-volume and best-seller KPI tiles
- Editable data arrays you point at your own numbers
- A responsive layout that works on mobile and desktop
Power BI Premium’s embedded and web-publishing features are exactly what teams pay the most for. An HTML dashboard sidesteps that entirely: host it, share the link, and anyone can view it free. At $12.99 it is the cheapest path to a public-facing analytics view. This is a genuinely different distribution model from Power BI, and for many small sellers it is the better one.
Best for: Web-embedded e-commerce metrics with no licence to view. Get it for $12.99 →
8. YouTube Channel Analytics Dashboard in HTML
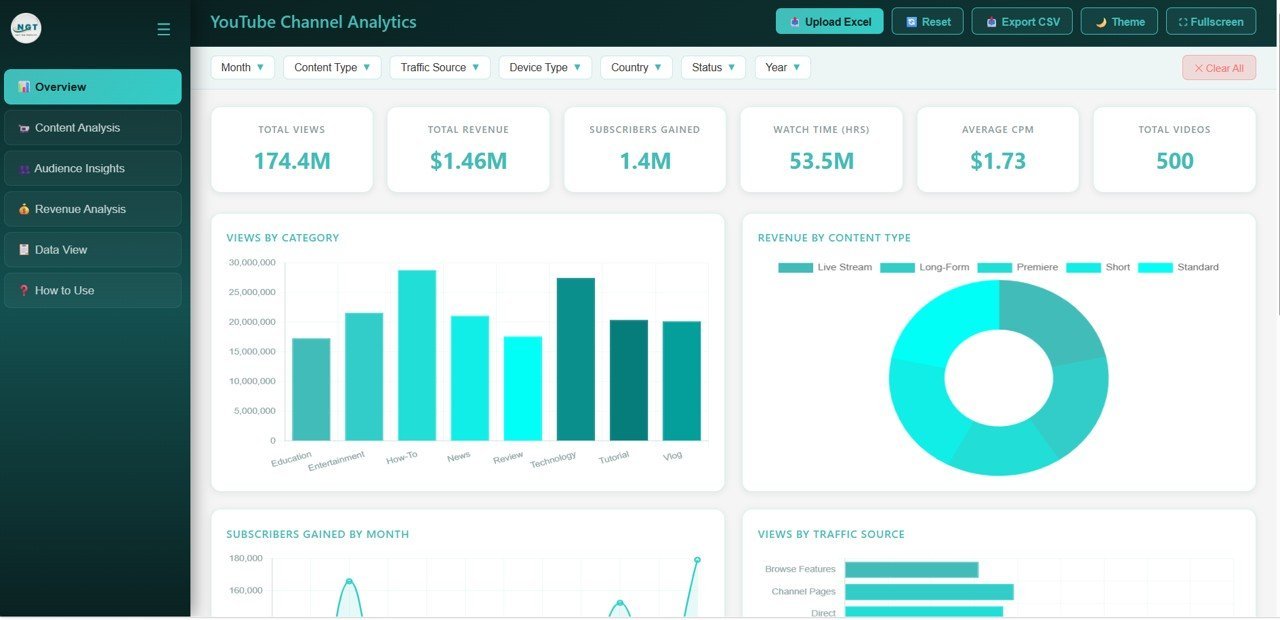
What it is: The channel-analytics report as a browser-based HTML dashboard — the same views, watch-time and growth metrics, published as a link anyone can open.
Who it is for: Agencies and content teams that report to clients or stakeholders who will never have a Power BI login.
What is inside:
- Browser-native charts for views, watch time and subscribers
- Top-video and traffic-source panels
- Editable data so you refresh it in a text editor
- A clean, brandable single-page layout
When the whole point of Premium was “let the client see the dashboard,” an HTML file does that for free, forever, with no seat count. Host it on any web server or share it as a file. At $12.99 it rounds out the set as the zero-friction way to distribute analytics. For teams weighing browser dashboards against BI platforms, our Qlik Sense alternatives comparison is a useful next read.
Best for: Zero-license shareable web reporting. Get it for $12.99 →
How to choose between them
Match the template to how your audience will consume the report:
| Your situation | Pick this |
|---|---|
| You want to stay in Power BI, just not pay Premium | Augmented Analytics Dashboard in Power BI ($17.99) |
| Everyone has Excel and you just need charts + refresh | Data Analytics Dashboard Report in Excel ($7.99) |
| You track operational incidents | Office Incident Report Dashboard (Power BI or Excel, $17.99) |
| You report HR / engagement metrics | Employee Recognition Dashboard in Excel ($17.99) |
| You report marketing channel performance | YouTube Channel Analytics Dashboard (Excel $17.99 / HTML $12.99) |
| Viewers must open it in a browser, no licence | Any HTML dashboard ($12.99) |
Quick rule of thumb: choose Power BI format if your team already builds in it, Excel if you want the widest reach at the lowest cost, and HTML if you need to publish to people who will never log in to a BI tool. When in doubt, start with the $7.99 Excel report — it is the least you can spend to prove the concept before committing further.
When Power BI Premium is still the right call
These templates are honest replacements for the reporting jobs most small teams do, but they are not a substitute for the enterprise platform itself. Stay on — or move to — Power BI Premium when you genuinely need what it is built for:
- Real-time and streaming data. Live dashboards with push datasets and sub-minute refresh are a platform capability. A static template cannot stream.
- Very large models. Multi-gigabyte or multi-terabyte semantic models, incremental refresh and aggregations need Premium/Fabric capacity that Excel and HTML cannot host.
- Paginated reports at scale. Pixel-perfect, subscription-delivered paginated reports to hundreds or thousands of recipients are a Premium feature with no template equivalent.
- Enterprise governance. Row-level security across many roles, deployment pipelines, audit logging and centralized data lineage are why large organizations pay for Premium in the first place.
- A shared enterprise data model. If dozens of reports must reference one certified dataset with managed refresh, you want the platform, not a folder of files.
If two or more of those describe you, keep Premium and use these templates only as quick side reports. If none of them do, you are almost certainly over-paying — and a one-time template is the cheaper, simpler answer. For more platform-level comparisons, see our Domo alternatives and Oracle Fusion reporting alternatives.
Frequently asked questions
What is the cheapest Power BI Premium alternative?
The cheapest capable alternative is a one-time dashboard template. The Data Analytics Dashboard Report in Excel costs $7.99 once and needs no subscription, seat or capacity. Against Power BI Premium Per User at roughly $24 per user per month, a single Excel template pays for itself in the first fortnight for even a one-person team.
How much does Power BI Premium actually cost in 2026?
Microsoft’s published pricing puts Power BI Premium Per User at about $24 per user per month, while the former Premium capacity has moved to Microsoft Fabric, where the F64 tier that unlocks free viewers lists near $5,000 per month. Prices change, so confirm the current figures on Microsoft’s official Power BI pricing page before budgeting.
Can Excel really replace Power BI for dashboards?
For most small-team reporting, yes. Excel with pivot tables, slicers, timelines and KPI cards covers refreshable charts, interactive filtering and printable summaries. It cannot match Power BI for very large models, streaming data or enterprise governance, but for a monthly KPI deck read by a handful of people, a well-built Excel dashboard does the same job at a fraction of the cost.
Do these templates need a Power BI licence to open?
Only the two Power BI templates use Power BI Desktop, which is free to download. The Excel templates need Microsoft Excel, and the HTML dashboards open in any web browser with no software licence at all. None of the eight require a paid Power BI Pro or Premium subscription to build or view.
Is a one-time template better value than a Power BI Premium subscription?
For teams that only use a few reports, yes. A $7.99–$17.99 template is a single payment you own forever, versus roughly $24 per user per month indefinitely for Premium Per User. The subscription wins only when you need Premium’s platform features — streaming, huge models, paginated distribution or strict governance — that a template cannot provide.
Can I share these dashboards with people who do not have a licence?
Yes. Excel files can be emailed or exported to PDF, and HTML dashboards open in any browser via a shared link with no login. This sidesteps one of Power BI Premium’s biggest costs — paying for viewer seats — because your audience needs nothing installed to read the report.
Are the Power BI templates full projects I can edit?
Yes. The Power BI templates ship as editable projects with a semantic model, DAX measures and multi-page layouts. You replace the sample data with your own source, refresh, and restyle the theme. You are not locked into the demo data; treat them as a professionally built starting point you customise.
Which format should I choose — Power BI, Excel or HTML?
Choose Power BI if your team already works in it and wants that look without the licence, Excel for the widest reach at the lowest price, and HTML when you need to publish a dashboard to viewers who will never log in to a BI tool. Many teams buy more than one format to cover different audiences.
Will using templates instead of Premium hurt my reporting quality?
Not for standard reporting. These templates are professionally designed with proper KPI cards, trends and interactivity. Quality only suffers if you actually need Premium-only capabilities — real-time streaming, terabyte-scale models or enterprise governance — in which case the platform, not a template, is the right tool.
Get more Power BI Premium alternative templates
You do not need a five-figure BI subscription to ship professional dashboards. Start with the Augmented Analytics Dashboard in Power BI at $17.99 if you want to stay in Power BI, or the Data Analytics Dashboard Report in Excel at just $7.99 if you want the widest-reach, lowest-cost swap. Every template is a one-time purchase you own outright — no seats, no capacity, no renewal.
Browse more options in our Power BI dashboard templates ranked by industry guide, compare adjacent platforms in the Looker Studio alternatives roundup, and watch build walkthroughs on the NextGenTemplates YouTube channel.
Managing procurement spend rather than BI licences? See our Coupa alternative procurement templates for affordable spend-analysis and PO tools in Excel, Sheets and Power BI.
Switching construction software too? See our guide to Buildertrend alternatives in Excel and Google Sheets for six home-builder templates that replace scheduling, budgeting and reporting for a one-time fee.
Related: Toast POS alternatives 2026: 6 restaurant analytics templates in Excel & Sheets.
Managing builds instead of dashboards? Compare our pick of Procore alternatives for construction teams — eight Excel, Google Sheets and Power BI templates that replace Procore’s cost and reporting modules from $6.99.
Weighing a paid platform against templates you buy once? See the full five-year maths in our one-time purchase vs subscription software cost comparison.