

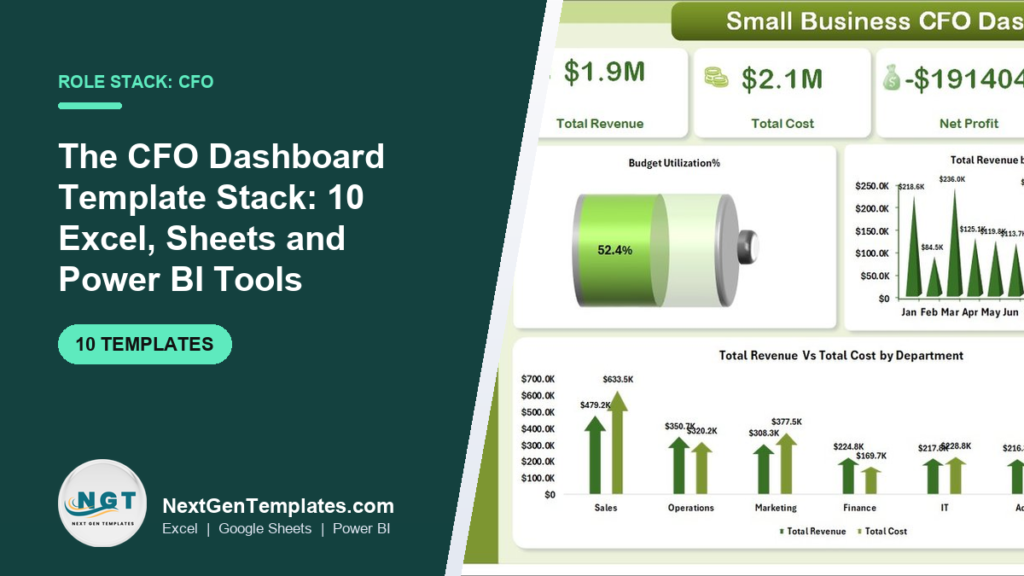
A good CFO dashboard stack covers four jobs: plan cash, track receivables and revenue, report financial health, and present to the board. Our pick for the core is the Small Business CFO Dashboard in Excel ($17.99, paid once). For the whole stack, the CFO’s Financial Command Toolkit bundles 10 finance templates for $62.99.
Last updated: October 2026
Related guide: If you only need one finance report rather than a full stack, start with our finance dashboard Excel templates every CFO should see.
Key takeaways
- A CFO dashboard is not one file. It is a small stack of 4 to 10 templates, each doing one job: plan, track, report or present.
- The best overall CFO dashboard template in Excel is the Small Business CFO Dashboard in Excel at $17.99, with 5 dashboard pages and 18 charts.
- Bought one by one, the 10 templates in this guide cost $203.91. The CFO’s Financial Command Toolkit covers the core finance jobs for $62.99, 44% less than its own parts.
- A cash-forecasting SaaS such as Float starts at $130 a month on its published pricing, which is more than this whole template stack costs once.
- Templates beat software for a finance team of one to five people. Once you need live bank feeds, approvals and audit trails across entities, buy software instead.
CFO dashboard templates compared
Every template in this guide, side by side. The “Job” column is where it sits in the stack. “What it replaces” is the tool or task a CFO can usually drop once the template is running.
| # | Template | Format | Job | Best for | What it replaces | Price |
|---|---|---|---|---|---|---|
| 1 | Small Business CFO Dashboard (Best overall) | Excel | Report | The one-page monthly CFO view | Hand-built monthly management pack | $17.99 |
| 2 | CFO’s Financial Command Toolkit (Best value) | Excel + Sheets + Power BI | All four | Standing up a finance function fast | 10 separate template purchases | $62.99 |
| 3 | Cash Flow Analysis Pack | Excel (+ Sheets, Power BI, PPT) | Plan | 12-month and 13-week cash forecasts | Cash-forecasting SaaS subscription | $19.00 |
| 4 | Cash Flow KPI Dashboard | Excel | Track | Monthly cash KPI tracking | Ad-hoc bank-balance spreadsheets | $12.99 |
| 5 | Accounts Receivable KPI Dashboard | Excel | Track | DSO, aging and collections | Collections add-on reports | $12.99 |
| 6 | Revenue Tracking KPI Dashboard | Excel | Track | Revenue vs target by line | BI seat for revenue reporting | $14.99 |
| 7 | Financial Health KPI Dashboard | Excel | Report | Liquidity, solvency and return ratios | Manual ratio workbook | $14.99 |
| 8 | Small Business CFO Dashboard | Power BI | Present | Interactive board and investor reviews | Slide decks rebuilt every month | $17.99 |
| 9 | Finance KPI Dashboard | Google Sheets | Report | Shared MTD/YTD view for the team | Emailed Excel attachments | $12.99 |
| 10 | Financial Planning KPI Dashboard | Excel | Plan | Budget, debt and investment plan | Separate budget and debt sheets | $14.99 |
How we picked these
We searched the full NextGenTemplates finance and accounting catalogue across Excel, Google Sheets, Power BI and HTML. We kept only paid templates that answer a question a CFO is actually asked: how much cash do we have, when will it run short, who owes us, are we on target, and how healthy is the balance sheet.
We dropped personal-budget trackers, single-industry dashboards and anything that duplicates another pick. Every price below is the live store price in October 2026. We then grouped the survivors by the job they do, because a CFO buys capability, not files.
What a CFO dashboard stack actually needs to do
Most “CFO dashboard examples” online show a single page with revenue, profit and cash. That page is the output. Behind it, a working finance lead does four separate jobs every month, and each one needs a different tool.
- Plan: forecast cash 13 weeks and 12 months out, set budgets and model scenarios.
- Track: watch the numbers that move weekly, such as cash, receivables and revenue against target.
- Report: turn the month’s close into ratios and a one-page view the CEO reads.
- Present: show the board and lenders an interactive view they can question live.
The 10 templates below are ranked overall, but each one is tagged with its job, so you can build the stack in the order you need it.
The 10 best CFO dashboard templates for 2026
1. Small Business CFO Dashboard in Excel: best overall
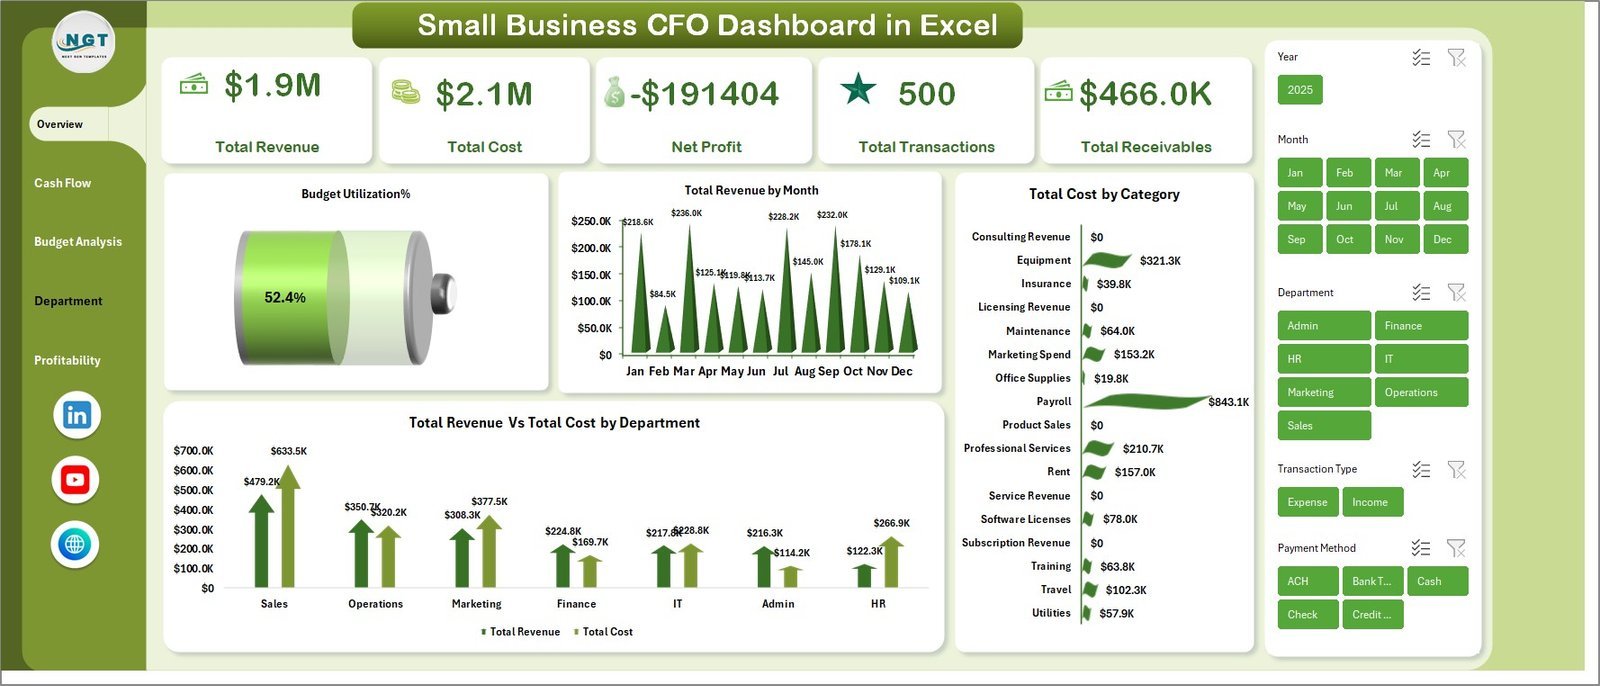
Job: Report. This is the CFO dashboard template in Excel we would buy first. It is why this template is #1: it is the only pick here built around the CFO’s own monthly questions rather than one function. It has 5 dashboard pages (Overview, Cash Flow, Budget Analysis, Department Spend and Profitability), a Data Sheet and a Support Sheet.
- 5 KPI cards: Total Revenue, Total Cost, Net Profit, Total Transactions and Total Receivables.
- 18 dynamic charts across revenue trends, cost breakdowns and budget utilisation.
- Cash flow page with receivables, payables, payment status and payment method.
- Budget vs actual and department spend views.
Use it for: the monthly management pack, a department-head budget review, and the first slide of a board deck. Paste the month’s transactions into the Data Sheet and every card and chart updates.
Price: $17.99, one-time. Get the Small Business CFO Dashboard in Excel.
Best for: owner-managed businesses and fractional CFOs who want one trusted monthly view.
2. CFO’s Financial Command Toolkit: best value

Job: all four. This bundle packs 10 finance templates across Excel, Google Sheets and Power BI. It covers cash flow, budget vs actual, expense analytics, invoicing, reimbursements, loan portfolio and profit analysis.
- Cash flow tracking with an automated waterfall chart and closing balances.
- Monthly budget vs actual tracker with slicers and variance visuals.
- A Power BI expense dashboard with current-year vs prior-year variance.
- Three platforms: Excel for modelling, Sheets for sharing, Power BI for executive reporting.
The maths: the ten templates cost $111.90 bought individually. The bundle is $62.99, a saving of $48.91, or 44%. The ten average about $11.19 each, so once you need six or more of them, the bundle is cheaper than buying separately.
Price: $62.99, one-time. Get the CFO’s Financial Command Toolkit.
Best for: a new finance lead who has to stand up reporting in weeks, not quarters.
3. Cash Flow Analysis Pack
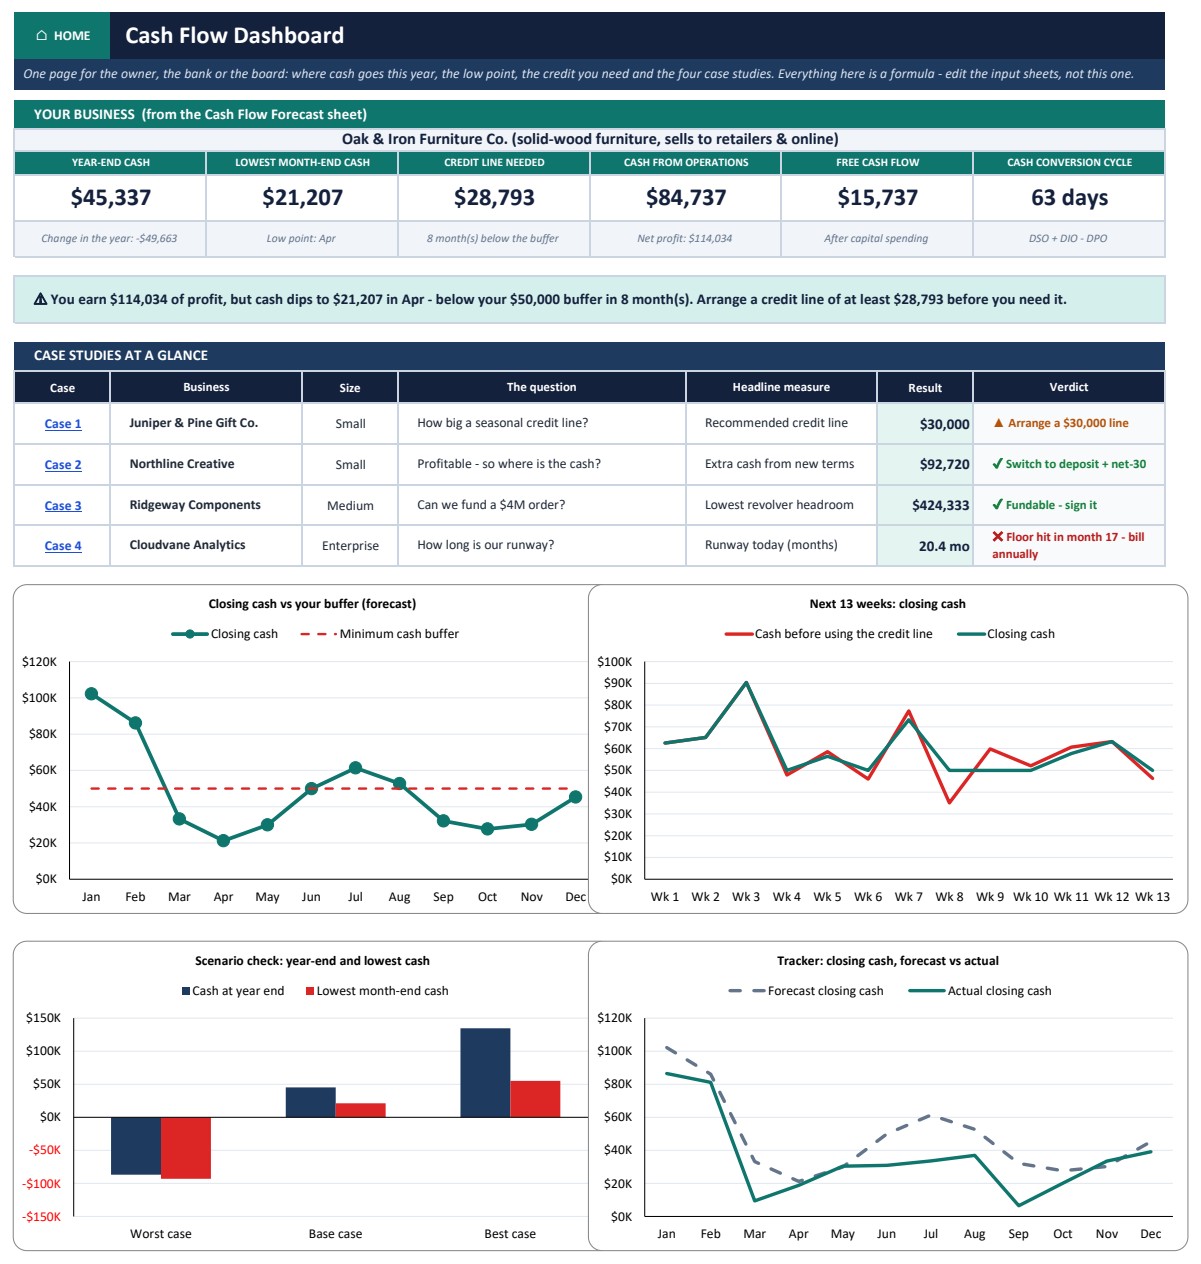
Job: Plan. This is the deepest planning tool in the stack. It is a 16-sheet Excel model, a Google Sheets copy, a Power BI explorer, a 16-slide PowerPoint deck and a 10-page PDF guide. Every result is a live formula, with no macros or add-ins.
- 12-month cash flow forecast that shows the low point and the credit line you need.
- 13-week direct-method cash forecast with an automatic credit line.
- Cash flow statement built from two balance sheets, with 6 checks.
- Working capital, scenarios and sensitivity grids with driver ranking.
Worked example: in the sample company, net profit is $114,034, yet operations generate only $84,737 of cash. The bank balance dips to $21,207 in April, and a $28,793 credit line covers the gap. That is the conversation a CFO needs to have with the bank before April, not during it.
Price: $19.00. Get the Cash Flow Analysis Pack.
Best for: lender conversations, the 13-week cash call and scenario planning.
4. Cash Flow KPI Dashboard in Excel
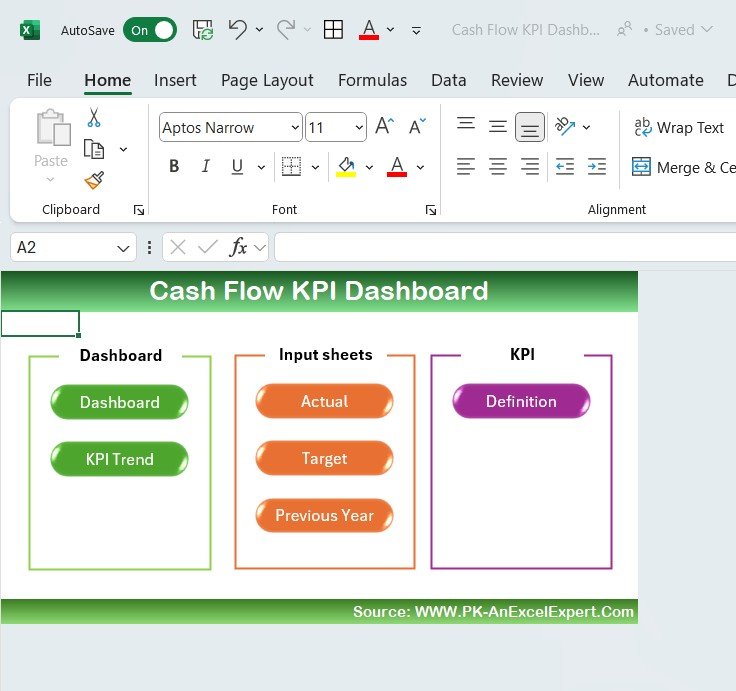
Job: Track. The pack above forecasts. This dashboard tracks what actually happened. It tracks cash flow from operations, total expenses, net cash and working capital, with automated calculations and dynamic charts.
- Incoming vs outgoing cash at a glance.
- KPIs you can add or remove to match your business.
- Charts refresh as new rows are entered.
Use it for: a weekly cash huddle, and comparing actual net cash against the 13-week forecast so you can see where your forecast was wrong.
Price: $12.99. Get the Cash Flow KPI Dashboard in Excel.
Best for: finance managers who report cash every week.
5. Accounts Receivable KPI Dashboard in Excel
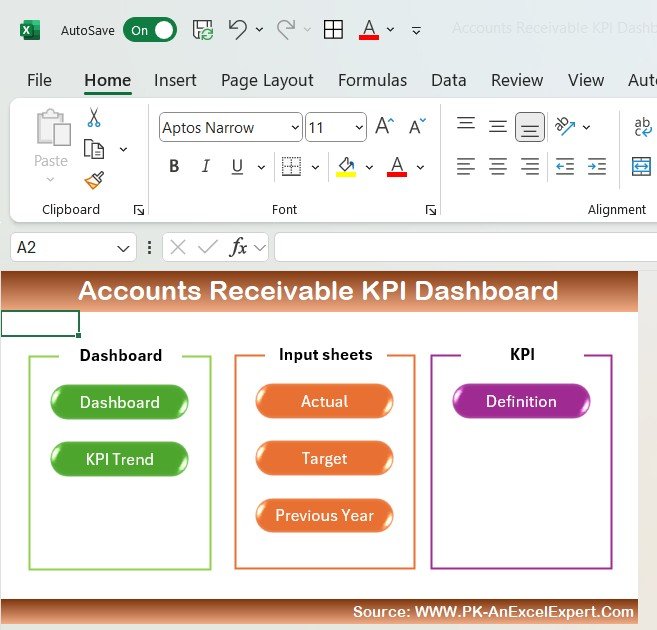
Job: Track. Receivables are where small-business cash usually goes missing. This dashboard tracks outstanding balances, overdue accounts, aging, collection efficiency and days sales outstanding (DSO). Filters let you drill into a period, customer or account type.
Why it matters: on $1.2 million of annual revenue, every 10 days of DSO is roughly $33,000 of cash sitting with customers (1,200,000 ÷ 365 × 10). Cutting DSO from 55 to 45 days frees that cash without borrowing a dollar.
Price: $12.99. Get the Accounts Receivable KPI Dashboard in Excel.
Best for: B2B companies on 30 to 60 day invoice terms.
6. Finance and Accounting Revenue Tracking KPI Dashboard in Excel
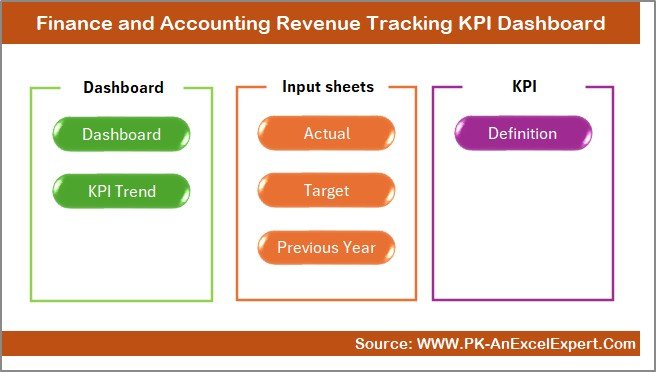
Job: Track. This tracks total revenue and revenue by department, product or service. It includes monthly and year-to-date performance, year-over-year growth and target vs actual.
- Spot which line is behind target before the quarter closes.
- Compare this month with the same month last year to strip out seasonality.
- Give sales leaders a revenue view that matches finance’s numbers.
Price: $14.99. Get the Revenue Tracking KPI Dashboard in Excel. For a deeper sales view, see our sales dashboard templates for Excel, Google Sheets and Power BI.
Best for: businesses with three or more revenue lines.
7. Finance and Accounting Financial Health KPI Dashboard in Excel

Job: Report. This is the ratio page. It tracks liquidity, solvency and efficiency ratios, net profit margin, return on assets and return on equity. It also covers operating cash flow, free cash flow, the cash conversion cycle and debt ratios.
Use it for: covenant checks before a lender review, a quarterly health summary for the owner, and spotting a slipping current ratio two quarters early.
Price: $14.99. Get the Financial Health KPI Dashboard in Excel.
Best for: businesses with bank debt or investors who ask for ratios.
8. Small Business CFO Dashboard in Power BI
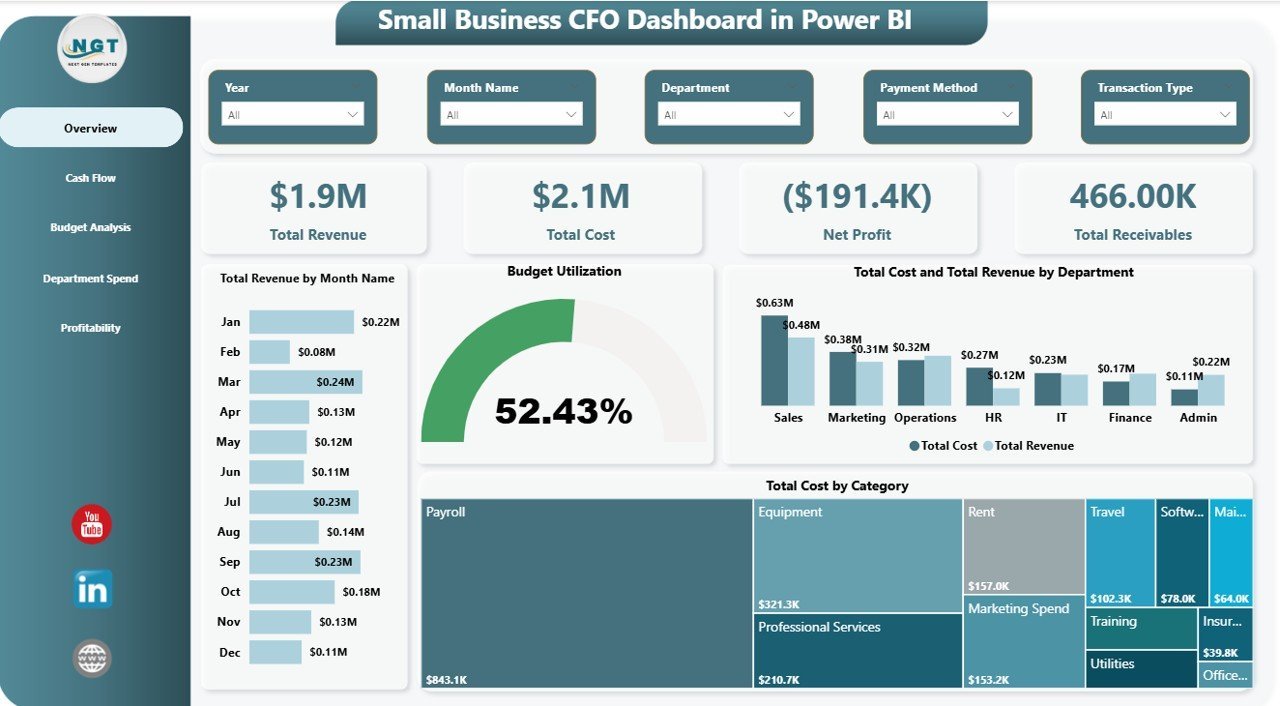
Job: Present. This is the same CFO dashboard as #1, rebuilt in Power BI for live, interactive reviews. It has 5 pages (Overview, Cash Flow, Budget Analysis, Department Spend and Profitability). KPI cards cover Total Revenue, Total Cost, Net Profit and Total Receivables, with dynamic slicers.
Use it for: board meetings where a director asks “what about Marketing in Q2?” and you click a slicer instead of promising a follow-up email.
Price: $17.99. Get the Small Business CFO Dashboard in Power BI. For more report options, see our premium Power BI templates under $20.
Best for: CFOs who already use Power BI Desktop.
9. Finance KPI Dashboard in Google Sheets
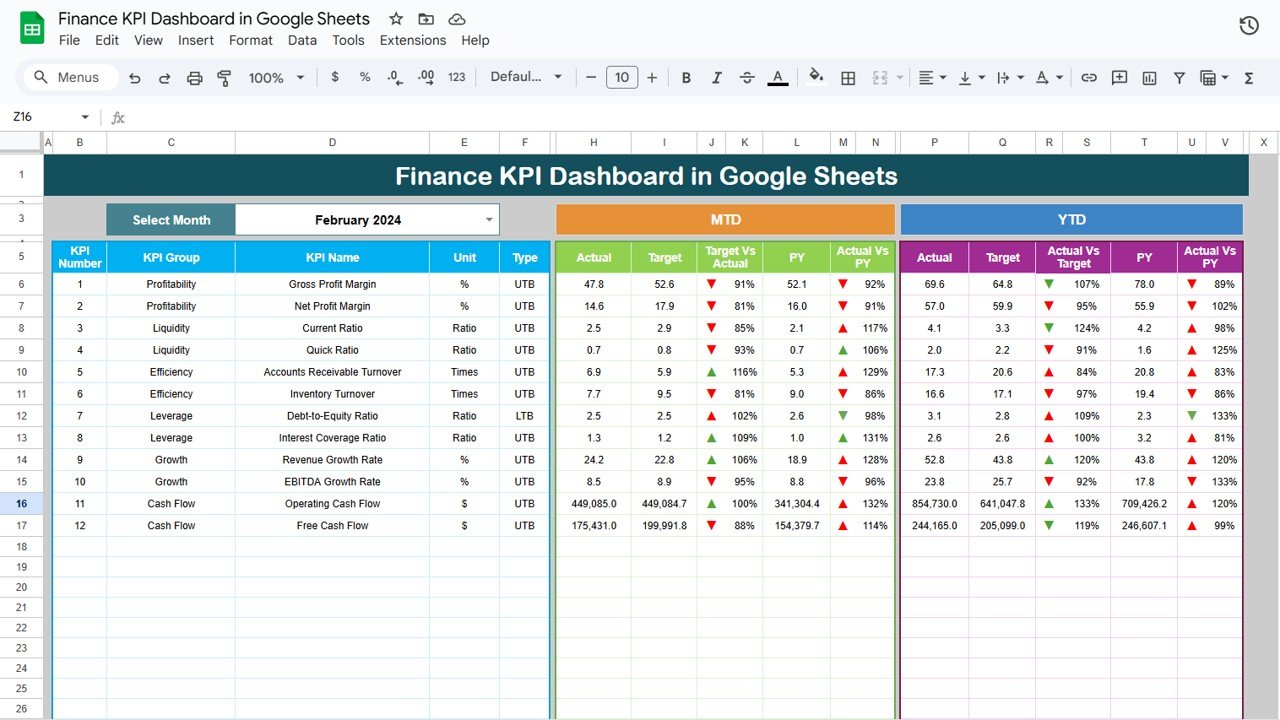
Job: Report (shared). When department heads need to see the numbers without emailed attachments, use Google Sheets. This dashboard tracks revenue, expenses, profit margins, cash flow, ROI and debt-to-equity. It has MTD and YTD comparison, goal vs actual, and alerts for underperforming areas.
Use it for: one shared link for the leadership team, budget owners checking their own variance, and remote finance teams.
Price: $12.99. Get the Finance KPI Dashboard in Google Sheets. More shareable options are in our Google Sheets templates for teams.
Best for: Google Workspace companies.
10. Financial Planning KPI Dashboard in Excel
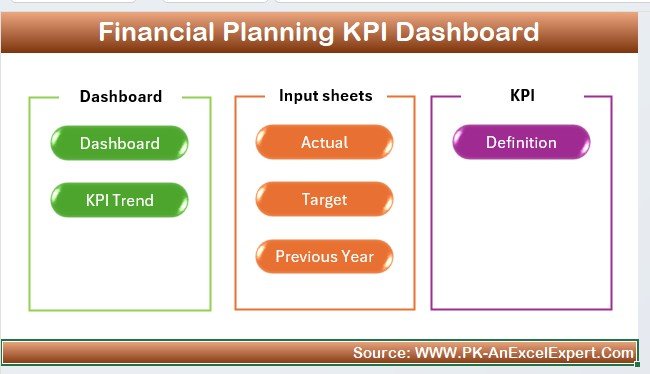
Job: Plan. This is a lighter planning dashboard. It covers income and expense tracking, planned vs actual budgets, investment performance and debt repayments. It is ranked last because it leans towards planners and owner-level finances rather than company-wide FP&A. For an owner-operator whose business and personal finances overlap, that can be exactly right.
Price: $14.99. Get the Financial Planning KPI Dashboard in Excel.
Best for: sole owners and small-firm finance advisers.
Building the whole stack? The CFO’s Financial Command Toolkit puts 10 finance templates in Excel, Google Sheets and Power BI into one download for $62.99, 44% less than buying them one by one. Add the Small Business CFO Dashboard in Excel ($17.99) as your monthly cover page.
Which CFO KPIs should the dashboard show?
Whichever templates you choose, the CFO dashboard should answer the same eight questions. Here are the formulas and the ranges finance teams commonly use as a first check. Your industry and lenders may set different thresholds.
| CFO KPI | Formula | Common reference range | Template that tracks it |
|---|---|---|---|
| Cash runway | Cash ÷ average monthly net burn | 12+ months for loss-making firms | Cash Flow Analysis Pack |
| Days sales outstanding (DSO) | Receivables ÷ revenue × days in period | Close to your invoice terms (e.g. 30-45 days) | Accounts Receivable KPI Dashboard |
| Cash conversion cycle | DIO + DSO − DPO | Lower is better; negative is excellent | Cash Flow Analysis Pack, Financial Health KPI |
| Current ratio | Current assets ÷ current liabilities | About 1.2 to 2.0 | Financial Health KPI Dashboard |
| Net profit margin | Net profit ÷ revenue | Varies widely by industry | Small Business CFO Dashboard |
| Budget variance | (Actual − budget) ÷ budget | Investigate beyond ±5-10% | Small Business CFO Dashboard, Toolkit |
| Revenue vs target | Actual revenue ÷ target revenue | 100%+ on a YTD basis | Revenue Tracking KPI Dashboard |
| Debt-to-equity | Total debt ÷ shareholder equity | Check your loan covenant | Financial Health KPI, Finance KPI (Sheets) |
30-day CFO dashboard rollout plan
Do not install ten templates on day one. This order gets cash under control first and the board view last.
| Days | Job | Template | Done when |
|---|---|---|---|
| 1-5 | Plan | Cash Flow Analysis Pack | 13-week forecast loaded, low point and credit line known |
| 6-10 | Track | Accounts Receivable KPI + Cash Flow KPI | Aging list owned by someone, weekly cash review booked |
| 11-15 | Track | Revenue Tracking KPI | Targets by revenue line agreed with sales |
| 16-22 | Report | Small Business CFO Dashboard (Excel) + Financial Health KPI | Last month’s close produces the one-page pack and ratios |
| 23-26 | Report (shared) | Finance KPI Dashboard (Google Sheets) | Budget owners can see their own variance |
| 27-30 | Present | Small Business CFO Dashboard (Power BI) | Board pack presented live from the dashboard |
How to choose between them
- Need one file only? Buy the Small Business CFO Dashboard in Excel.
- Worried about running out of cash? Start with the Cash Flow Analysis Pack before any reporting.
- Customers pay late? Add the Accounts Receivable KPI Dashboard next.
- Need six or more finance templates? The Toolkit is cheaper than buying them separately.
- Board uses Power BI or wants to click around? Add the Power BI CFO dashboard.
- Team lives in Google Workspace? Use the Google Sheets Finance KPI Dashboard as the shared layer.
Running a wider leadership stack? The same plan, track, report approach works for people metrics in our HR dashboard templates in Excel. It also works for delivery in our project management dashboard templates. For your operations partner, see the COO operations dashboard template stack.
When a template is NOT the right answer
Templates are the right tool for a finance team of one to five people closing one entity in Excel. They stop being right in these situations:
- Live bank and ledger feeds. If you need cash positions refreshed hourly from several banks, use a connected tool. Float’s published pricing starts at $130 a month for its Essentials plan.
- Multi-entity consolidation. Intercompany eliminations and currency translation across 5+ entities belong in FP&A software or your ERP.
- Audit trails and approvals. If auditors need to see who changed a budget and when, a spreadsheet’s version history is not enough.
- Nobody owns the file. A template still needs someone to paste in data each month. If no one will, no dashboard will help.
If none of those apply, a one-time CFO dashboard template in Excel will cover most of the job at a fraction of a yearly software bill. Want to compare against Microsoft’s own tier? See our guide to Power BI Premium alternatives.
Running the close rather than the whole finance function? Our financial controller Excel templates stack covers the close calendar, audit tracking and the monthly KPI pack.
Frequently asked questions
What should a CFO dashboard include?
A CFO dashboard should include cash balance and runway, revenue against target, net profit margin, budget vs actual by department, receivables and DSO, and a few balance-sheet ratios such as the current ratio and debt-to-equity. Keep the front page to 5-8 KPIs and put detail on drill-down pages.
Is there a CFO dashboard template for Excel?
Yes. The Small Business CFO Dashboard in Excel costs $17.99 one-time and includes 5 pages: Overview, Cash Flow, Budget Analysis, Department Spend and Profitability. It has 5 KPI cards and 18 charts. You paste your transactions into its Data Sheet and every page updates automatically.
What are the most important CFO KPIs?
The most important CFO KPIs are cash runway, operating cash flow, days sales outstanding, the cash conversion cycle, net profit margin, budget variance, revenue against target and the current ratio. Together they show whether the business is profitable, liquid and on plan, which are the three questions a board asks first.
Excel, Google Sheets or Power BI for a CFO dashboard?
Use Excel for modelling and the monthly close, because formulas and forecasts are easiest there. Use Google Sheets when many people need to view the same numbers. Use Power BI for interactive board presentations. Many CFOs use all three, which is why the CFO’s Financial Command Toolkit includes every format.
How much does a CFO dashboard cost?
A template-based CFO dashboard costs $12.99 to $19 per file as a one-time purchase. The 10-template CFO’s Financial Command Toolkit costs $62.99. Cash-forecasting and FP&A software usually bills monthly instead. Float, for example, publishes plans starting at $130 a month.
Can a template replace FP&A software?
For a single entity with a small finance team, often yes. Templates cover forecasting, budget vs actual, KPI tracking and board reporting. They do not replace live bank feeds, multi-entity consolidation, approval workflows or audit trails. Once you need those, FP&A software is worth its subscription.
How do I build a 13-week cash flow forecast?
List expected receipts and payments for each of the next 13 weeks, starting from today’s bank balance. Then carry the closing balance forward each week. The Cash Flow Analysis Pack does this with a direct-method 13-week sheet, and it draws an automatic credit line when cash falls below your minimum balance.
How often should a CFO dashboard be updated?
Update cash and receivables weekly, because they move fastest and cause the most damage when missed. Update revenue, profit, budget variance and ratios monthly after the close. Board and investor dashboards are usually refreshed monthly or quarterly, in line with the reporting calendar.
Do these CFO templates need macros?
No. The Cash Flow Analysis Pack states that every result is a live formula with no macros or add-ins. The CFO’s Financial Command Toolkit is plug-and-play: you replace the sample data and the KPI cards, charts and variance calculations refresh. That makes them safe to share with auditors and lenders.
Get the complete CFO template stack
Best value: the CFO’s Financial Command Toolkit includes 10 finance templates in Excel, Google Sheets and Power BI for $62.99, one payment and no subscription.
Best single file: the Small Business CFO Dashboard in Excel for $17.99.
See more finance tools in our finance and accounting template collection, or browse the 25 best-selling business templates. Watch the walkthroughs on the NextGenTemplates YouTube channel.