

The best Pipedrive alternative in Excel or Google Sheets is a one-time sales pipeline template that tracks deals, stages and forecasts without a per-seat subscription. Our top pick is the Sales KPI Dashboard in Excel ($12.99, paid once), which replaces Pipedrive’s core pipeline reporting for the price of roughly one day on a Lite seat.
Last updated: August 2026
Related guide: For task boards rather than sales pipelines, see Trello alternatives: 8 kanban board templates in Excel & Sheets.
Key takeaways
- Pipedrive now runs four plans – Lite ($14), Growth ($39), Premium ($49) and Ultimate ($79) per seat per month billed annually – so a five-person team on Growth pays about $2,340 a year, every year.
- All 8 templates in this guide are one-time purchases between $9.99 and $14.99 with no per-seat fee and no annual renewal.
- Best overall is the Sales KPI Dashboard in Excel ($12.99); best value is the Sales Funnel KPI Dashboard in Google Sheets ($9.99).
- Spreadsheets win on cost and control but lose on automation, email sync and mobile deal entry – we say exactly when to stay on Pipedrive.
- Coverage spans Excel, Google Sheets and Power BI so you can match the tool your team already lives in.
 Launch offer
SUMIFS, XLOOKUP, FILTER, LAMBDA and checking AI-written formulas, with real business projects. 11h 47m of video by PK, with practice files, quizzes and a capstone.
Why teams leave Pipedrive – and what it actually costs
Pipedrive is a genuinely good CRM. Small sales teams still churn off it, and when we looked at the reasons they nearly always came down to three things.
1. Seat cost compounds. In 2025 Pipedrive retired its old five-tier lineup (Essential, Advanced, Professional, Power, Enterprise) and moved to four plans. As published on the official Pipedrive pricing page, those plans are Lite at $14, Growth at $39, Premium at $49 and Ultimate at $79 per seat per month on annual billing – and roughly $24 to $99 per seat on monthly billing. The per-seat model is fine for two people. At five seats on Growth you are paying about $195 a month, or $2,340 a year, and that bill arrives again next year whether or not you added a single feature.
2. You pay for modules you never open. Revenue forecasting, workflow automation, project management, phone support, unlimited custom fields – the higher tiers bundle a lot. Most micro-teams use pipeline stages, deal values and a weekly forecast, then leave 70% of the product untouched while paying for the whole thing.
3. Admin overhead. Someone has to own the CRM: manage seats, tidy duplicate contacts, rebuild reports when a field changes, and re-train every new hire. For a team of three, that overhead can cost more hours than the selling it supports.
A spreadsheet template flips all three. You pay once, you own the file, every column is visible and editable, and there is nothing to administer beyond the sheet itself. The trade-off is real and we cover it in the honest-limits section below – but for a lot of small teams the maths is one-sided.
Pipedrive vs the NGT template that covers it
Here is the head-to-head. On the left, what you are paying Pipedrive for; on the right, the NGT template that covers the same job and its one-time price.
| What Pipedrive charges for | NGT template that covers it | One-time price |
|---|---|---|
| Pipeline stages & deal tracking | Sales KPI Dashboard in Excel | $12.99 |
| Funnel conversion by stage | Sales Funnel KPI Dashboard in Google Sheets | $9.99 |
| Contact / account reporting | CRM KPI Dashboard in Power BI | $11.99 |
| Cloud, multi-user sales tracking | Sales KPI Dashboard in Google Sheets | $12.99 |
| Revenue forecasting (seasonal) | Seasonal Sales KPI Dashboard in Excel | $14.99 |
| Multi-source funnel analytics | Sales Funnel KPI Dashboard in Power BI | $11.99 |
| Post-sale / retention tracking | After-Sales Service KPI Dashboard in Excel | $12.99 |
| Budget seasonal forecasting | Seasonal Sales KPI Dashboard in Google Sheets | $9.99 |
Pipedrive alternative templates compared
Every template in this guide, side by side. Two rows are flagged: one best overall and one best value.
| Template | Format | Best for | Price |
|---|---|---|---|
| Sales KPI Dashboard (Best overall) | Excel | Full pipeline + KPI reporting in one file | $12.99 |
| Sales Funnel KPI Dashboard (Best value) | Google Sheets | Free-to-run funnel & conversion tracking | $9.99 |
| CRM KPI Dashboard | Power BI | Account & contact reporting at scale | $11.99 |
| Sales KPI Dashboard | Google Sheets | Cloud, real-time team collaboration | $12.99 |
| Seasonal Sales KPI Dashboard | Excel | Seasonal & retail revenue forecasting | $14.99 |
| Sales Funnel KPI Dashboard | Power BI | Multi-source funnel analytics | $11.99 |
| After-Sales Service KPI Dashboard | Excel | Retention & post-sale metrics | $12.99 |
| Seasonal Sales KPI Dashboard | Google Sheets | Budget seasonal tracking in the cloud | $9.99 |
How we picked these
We searched the NextGenTemplates catalogue of roughly 6,900 published products for sales, pipeline, funnel and CRM templates in Excel, Google Sheets and Power BI, then filtered to the ones that reproduce the jobs a small team actually uses Pipedrive for: stage-by-stage deal tracking, conversion by funnel step, revenue forecasting and contact reporting. We excluded single-industry dashboards that would only fit one niche, anything without editable KPI logic, and free files that lack the depth to run a real pipeline. Every template below is a paid, one-time product with visible formulas you can adapt – because a Pipedrive replacement that you cannot customise is not a replacement.
The 8 best Pipedrive alternative templates for 2026
1. Sales KPI Dashboard in Excel – best overall
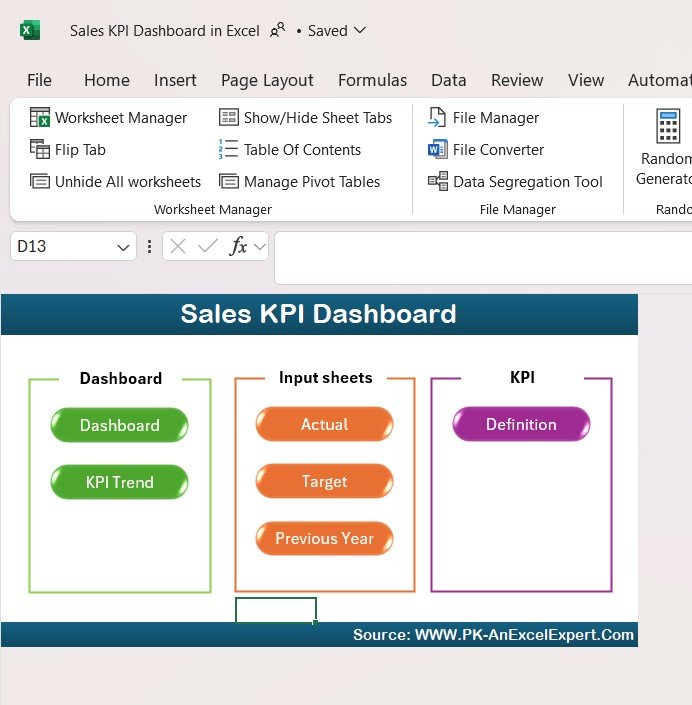
This is the closest single-file substitute for Pipedrive’s core. It brings pipeline value, win rate, revenue against target and the KPIs a sales manager checks every Monday into one Excel dashboard with an Actual/Target input model.
Who it is for: a founder or sales lead who wants Pipedrive’s numbers without the login, and whose team already works in Excel.
What is inside:
- Dashboard, KPI Trend and Definition tabs with a clean input area for Actuals and Targets
- Pre-built formulas for win rate, average deal size, revenue vs target and growth
- Charts that update the moment you type a new number – no pivot rebuild
- A worksheet-manager utility ribbon for navigating and cleaning the file
A three-person team replacing a $39/seat Growth plan saves about $1,400 in year one alone, and the file keeps working with no renewal. Use it to run a weekly forecast, a monthly QBR, or a rep-by-rep scorecard. It is our best sales dashboard Excel template for switchers because it needs zero setup beyond entering your own stages.
Best for: teams that want the single most complete Pipedrive-to-spreadsheet swap. $12.99 – view the template.
2. Sales Funnel KPI Dashboard in Google Sheets – best value
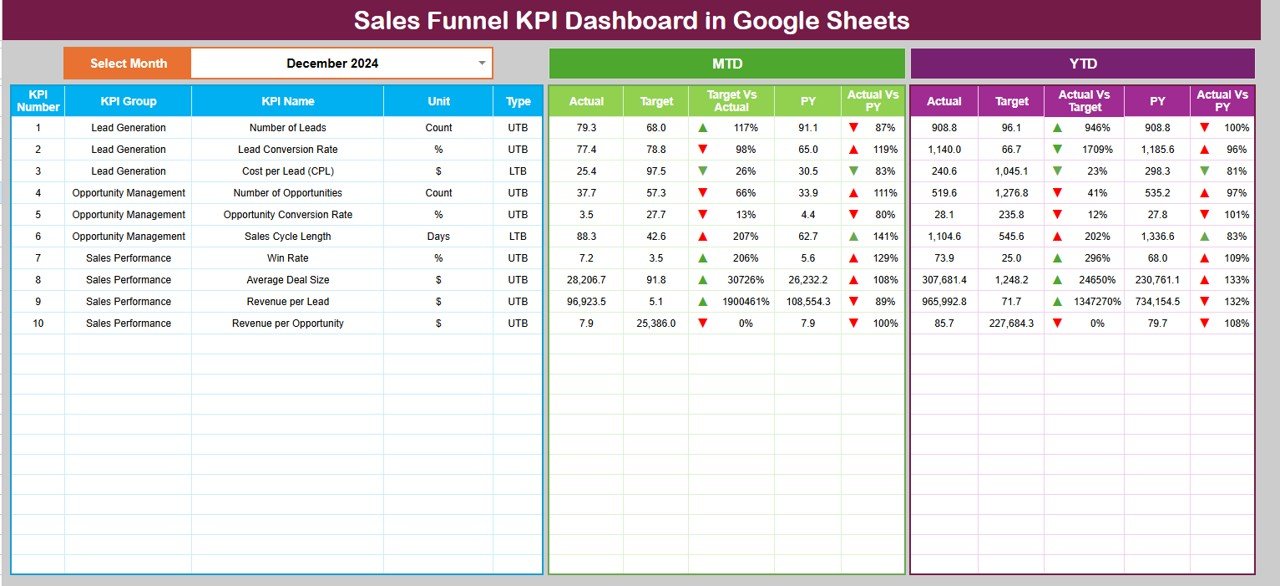
Pipedrive’s funnel view is one of its most-used screens. This Google Sheets template reproduces it – leads, qualified, proposal, won – with conversion rate between every stage, and it runs on a free Google account.
Who it is for: a distributed or remote team that wants a shared, live pipeline link without paying for either Pipedrive or Microsoft 365.
What is inside:
- Stage-by-stage funnel with automatic drop-off and conversion percentages
- KPI cards for total pipeline value, win rate and average velocity
- Cloud-native sharing – give reps edit access, managers view-only
- Trend and analysis tabs to spot where deals stall
At $9.99 once, it is the cheapest full-pipeline tool here and the lowest-friction switch: send the sheet link, done. A five-seat team leaving Growth recovers the purchase price in under two days of avoided subscription cost. Pair it with our project management dashboard templates if sales and delivery share a workspace.
Best for: remote teams and the tightest budgets. $9.99 – view the template.
3. CRM KPI Dashboard in Power BI

When you outgrow a single sheet but not your budget, Power BI gives you Pipedrive-grade reporting with interactive slicers. This template models CRM activity – contacts, accounts, deals and conversion – into a filterable report.
Who it is for: a team that has data in a CSV export or database and wants the polished, drillable reporting Pipedrive charges Premium and Ultimate seats for.
What is inside:
- Semantic model with a date table and pre-built DAX measures
- Slicers for owner, stage, region and period
- KPI cards with period-over-period deltas
- Drill-through detail pages for any account or rep
Load a weekly export and the report refreshes – no per-seat charge to view it inside your organisation. It is a strong fit if you already publish to Power BI; see our Power BI dashboard templates ranked by industry for the wider range.
Best for: account-level reporting and drill-down analysis. $11.99 – view the template.
4. Sales KPI Dashboard in Google Sheets
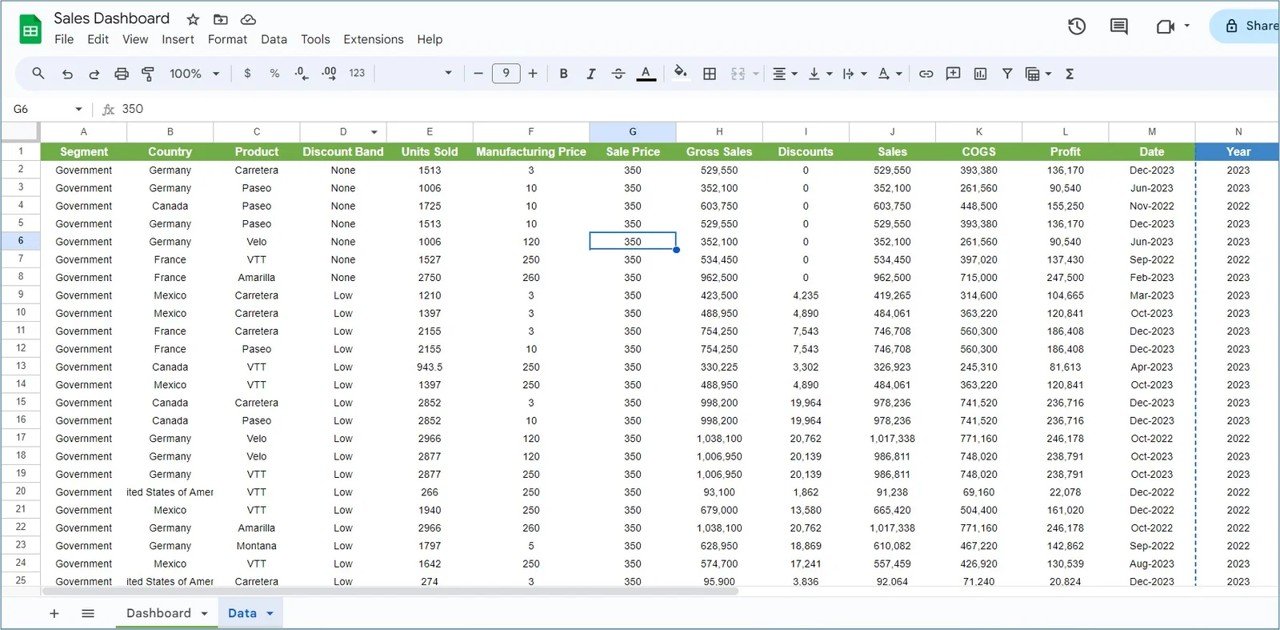
The cloud twin of our best-overall pick. Same KPI logic – revenue vs target, win rate, average deal size – but living in Google Sheets so the whole team edits one live copy in real time.
Who it is for: teams that value collaboration over Excel’s raw power and want Pipedrive’s shared-visibility feel for a one-time price.
What is inside:
- Actual vs Target input model with instant KPI recalculation
- Charts for trend, target attainment and rep performance
- Native Google sharing, comments and version history
- Dropdown-driven categories that expand as you add data
Because Google Sheets is free, the only cost is the $12.99 file. Managers get a single source of truth without chasing versions over email, and there is no seat to revoke when someone leaves. A good companion to a shared HR dashboard if you run people and sales from the same stack.
Best for: real-time collaboration in the cloud. $12.99 – view the template.
5. Seasonal Sales KPI Dashboard in Excel
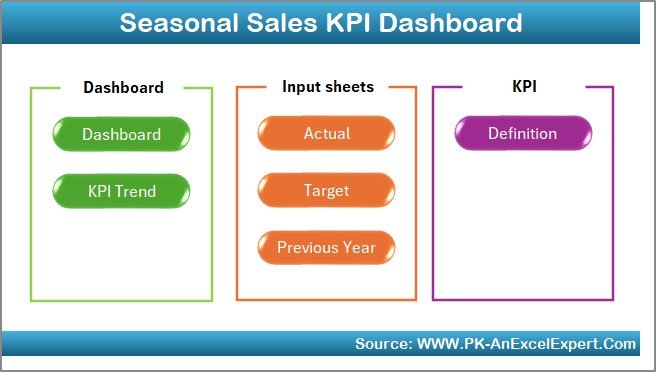
Pipedrive’s forecasting sits behind its pricier plans. If your revenue swings by season – retail, hospitality, gifting, tourism – this Excel dashboard is built for exactly that pattern, comparing periods and surfacing peak-vs-trough performance.
Who it is for: any business whose sales cycle is calendar-driven and needs to plan inventory, staffing and cash around the peaks.
What is inside:
- Season-over-season and month-over-month comparison views
- Target attainment and variance KPIs
- Peak-period detection and year-on-year growth
- Charts sized for a one-page management review
At $14.99 it is the priciest template here and still a rounding error next to a single Premium seat. Use it to answer “are we ahead of last Q4?” without exporting anything from a CRM. It pairs naturally with the seasonal Google Sheets version below for teams split across platforms.
Best for: seasonal and retail revenue forecasting. $14.99 – view the template.
6. Sales Funnel KPI Dashboard in Power BI
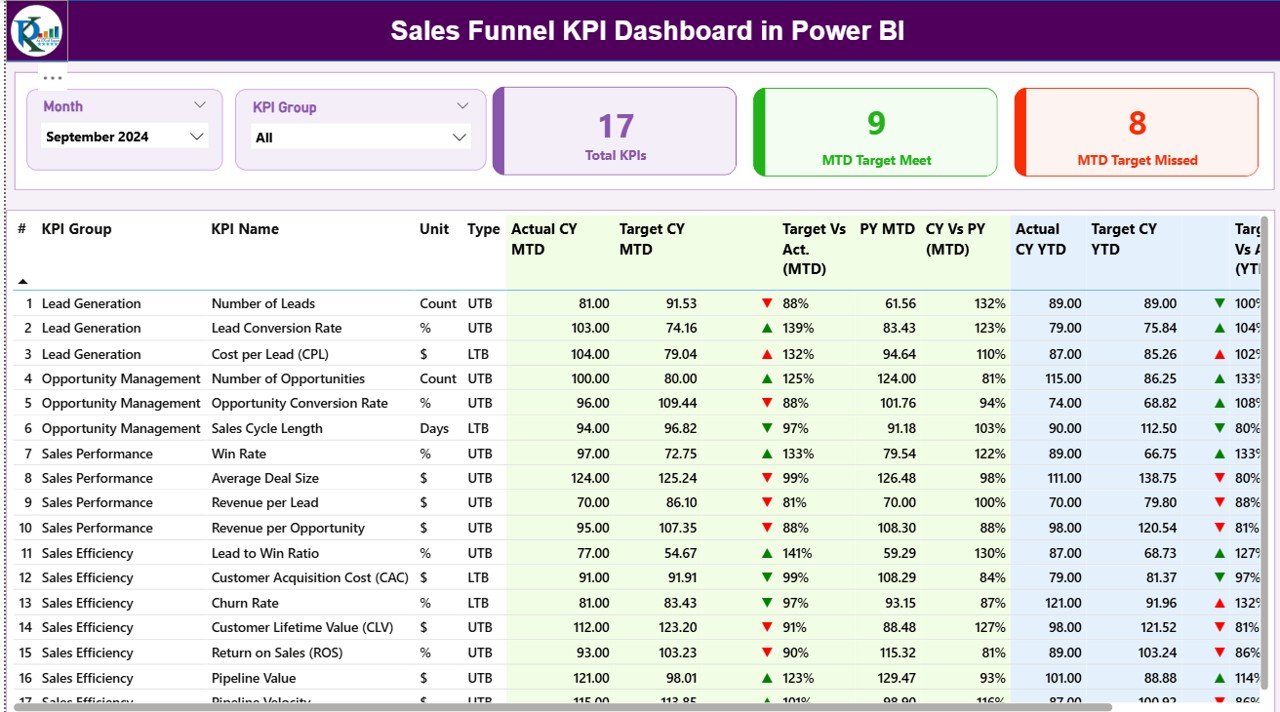
The funnel, upgraded to a fully interactive Power BI report. Where the Google Sheets funnel is perfect for one team, this handles multiple lead sources, campaigns and regions in one model you can slice on the fly.
Who it is for: teams pulling leads from several channels – ads, web, referral, outbound – who need to see conversion by source, not just overall.
What is inside:
- Funnel visual with stage conversion and drop-off measures
- Source, campaign and owner slicers
- Velocity and win-rate KPIs with trend sparklines
- Tooltip and drill-through pages for deep dives
Refresh from an export and every stakeholder can explore it without a Pipedrive seat. If your funnel questions are “which channel converts best?” rather than “how many deals this week?”, this is the tool. Reporting-heavy teams often run it alongside a CRM KPI dashboard for the full picture.
Best for: multi-source funnel analytics. $11.99 – view the template.
7. After-Sales Service KPI Dashboard in Excel
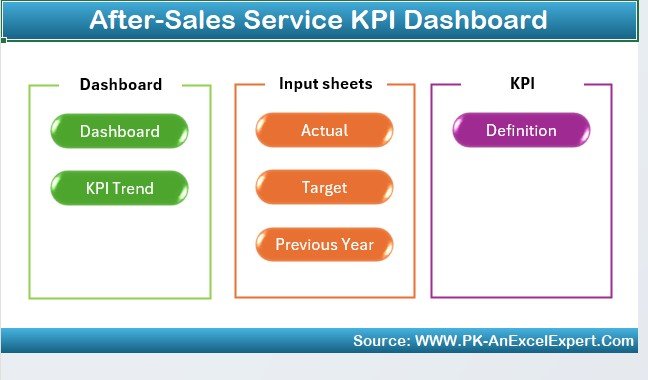
Closing the deal is half the job. This dashboard covers the half Pipedrive’s core pipeline ignores – what happens after the sale: service tickets, resolution time, satisfaction and repeat-purchase signals that drive retention.
Who it is for: teams where renewals and upsells matter as much as new logos, and who want post-sale metrics next to their pipeline.
What is inside:
- Service KPIs: resolution time, first-response, backlog and CSAT
- Retention and repeat-rate tracking
- Actual vs Target model consistent with the sales dashboards
- One-page management view with trend charts
Run it beside template #1 and you have the whole customer lifecycle in Excel for under $26 total, one time. It answers the question that predicts next quarter’s revenue: are the customers we won last quarter still happy? Retention-focused teams also lean on our performance review templates to tie service quality to individual reps.
Best for: retention and post-sale service metrics. $12.99 – view the template.
8. Seasonal Sales KPI Dashboard in Google Sheets
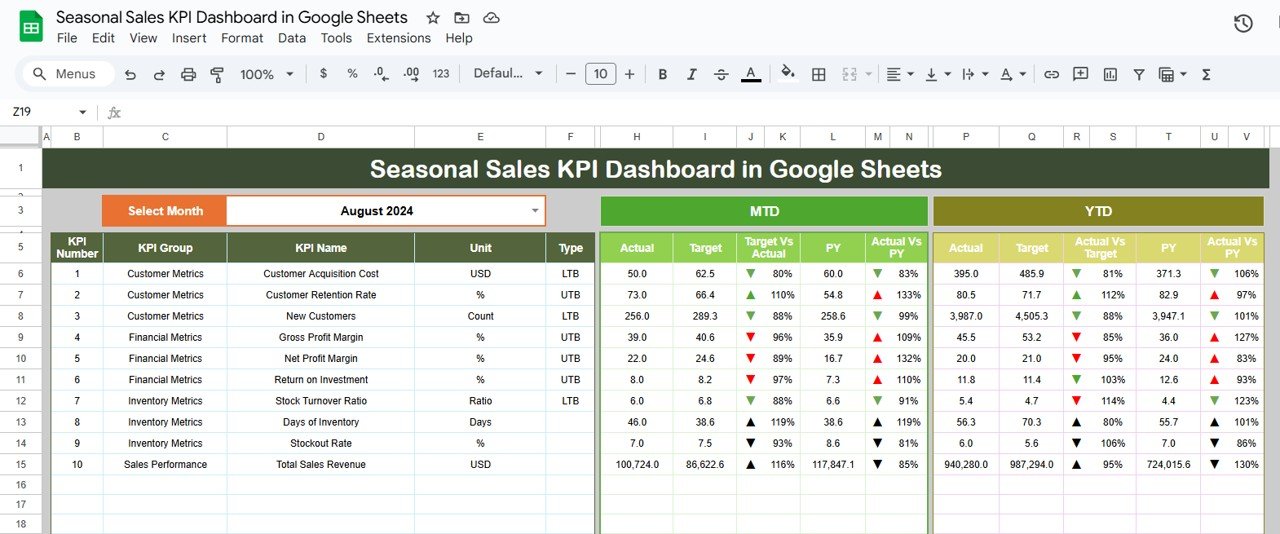
The cloud, budget edition of template #5. Same season-over-season forecasting logic in Google Sheets at $9.99, so a distributed team can plan for peaks together without any subscription at all.
Who it is for: lean, remote or multi-location businesses with seasonal demand who want shared forecasting on the cheapest possible footing.
What is inside:
- Season and month comparison with variance to target
- Peak-period and growth KPIs
- Live cloud sharing for planning meetings
- Auto-expanding dropdown categories
It is the lowest-cost way to add real forecasting to a pipeline that Pipedrive would charge a Premium seat for. Combine it with the Google Sheets sales dashboard (#4) and you have cloud pipeline plus cloud forecasting for $22.98 once, versus $39-plus every month per seat.
Best for: budget seasonal forecasting in the cloud. $9.99 – view the template.
How to choose between them
Match the template to how your team already works, not the other way round:
| If you… | Buy this | Price |
|---|---|---|
| Live in Excel and want the closest all-in-one swap | Sales KPI Dashboard in Excel | $12.99 |
| Are remote and want a free-to-run shared link | Sales Funnel KPI Dashboard (Google Sheets) | $9.99 |
| Need drillable reporting across many accounts | CRM KPI Dashboard (Power BI) | $11.99 |
| Have seasonal revenue to forecast | Seasonal Sales KPI Dashboard (Excel) | $14.99 |
| Care about retention after the sale | After-Sales Service KPI Dashboard | $12.99 |
Still unsure? Start with the $9.99 Google Sheets funnel. It is the cheapest way to prove a spreadsheet pipeline works for your team, and you can add the Excel or Power BI depth later for the price of a few coffees.
When a template is NOT the right answer
We would rather keep a customer than sell the wrong thing, so here is the honest version. Stay on Pipedrive – or another dedicated CRM – when any of these is true:
- You need automation and email sync. A spreadsheet will not log emails, trigger sequences, or move a deal automatically when a reply lands. If your process depends on workflow automation, Pipedrive’s Growth plan and up earn their fee.
- You have reps entering deals from their phones all day. Pipedrive’s mobile app and offline capture beat any spreadsheet on a phone. Field sales teams should not fight a mobile grid.
- You need a shared, permissioned database with an audit trail. Ten-plus users editing concurrently, with role-based access and change history, is what a real CRM is for. A single sheet gets fragile past a handful of heavy editors.
- You want native integrations. Pipedrive plugs into calendars, VoIP, marketing tools and quoting systems out of the box. Rebuilding that with spreadsheets is possible but rarely worth it.
The sweet spot for these templates is one to about eight people who want visibility, forecasting and reporting – not marketing automation. If that is you, the maths and the control both point to a one-time file. If it is not, Pipedrive is a fair price for what it does. For heavier internal tooling, our Excel VBA systems sit between a template and full software.
Frequently asked questions
What is the best Pipedrive alternative in Excel?
The Sales KPI Dashboard in Excel ($12.99) is the best Pipedrive alternative in Excel for most small teams. It reproduces Pipedrive’s core pipeline reporting – win rate, deal value, revenue vs target – in a single file you buy once, with no per-seat fee and no annual renewal to worry about.
How much does Pipedrive cost in 2026?
Pipedrive runs four plans on annual billing: Lite at $14, Growth at $39, Premium at $49 and Ultimate at $79 per seat per month. Monthly billing is higher, roughly $24 to $99 per seat. Always confirm current figures on Pipedrive’s official pricing page, as tiers and prices change.
Can a spreadsheet really replace a CRM?
For teams of roughly one to eight who need pipeline visibility, forecasting and reporting, yes – a well-built template covers it. What a spreadsheet cannot replace is automation, email sync, mobile deal capture and permissioned multi-user databases. If those matter to you, keep a dedicated CRM.
Do these templates work in Google Sheets and Excel?
Each template is built for a specific platform. This guide includes three Excel dashboards, three Google Sheets dashboards and two Power BI reports, so you can pick the format your team already uses. The Sales KPI Dashboard, for example, comes in both Excel and Google Sheets versions.
Is there a free Pipedrive alternative?
Google Sheets itself is free, so the only cost of the Google Sheets templates here is the one-time file – $9.99 for the Sales Funnel or Seasonal dashboards. There is no ongoing subscription. Pipedrive does not offer a permanent free plan, only a trial, so a paid-once template is often cheaper within the first month.
How do I move my Pipedrive data into a template?
Export your deals from Pipedrive to CSV, then paste the columns – deal name, stage, value, owner, close date – into the template’s input tab. The dashboards recalculate automatically. For Power BI templates you connect the CSV as a data source and refresh. Budget an hour for the first import.
Will I lose Pipedrive’s automation if I switch?
Yes – that is the main trade-off. Spreadsheet templates do not send emails, trigger sequences or auto-advance deals. You gain one-time pricing, full control and no seat limits; you give up workflow automation and email sync. Teams that rely on automation should stay on Pipedrive or run both in parallel.
Which template is best for a remote sales team?
The Sales Funnel KPI Dashboard in Google Sheets ($9.99) or the Sales KPI Dashboard in Google Sheets ($12.99). Both are cloud-native, so you share one live link, set edit or view permissions per person, and everyone sees the same numbers in real time without installing anything.
Are one-time templates cheaper than Pipedrive over a year?
Almost always for small teams. A single five-seat Growth plan is about $2,340 a year. Every template in this guide is a one-time $9.99 to $14.99. Even buying three of them costs under $40 once, versus a subscription that renews every year per seat.
Can I customise these dashboards?
Yes. Every template has visible, editable formulas – rename stages, add KPIs, change targets, restyle charts. That was a selection criterion: a Pipedrive replacement you cannot adapt is not a replacement. You own the file outright and can modify it as your process evolves.
Get more sales pipeline templates
Leaving Pipedrive does not mean leaving structure behind – it means owning it. For under the price of one seat-month you can run your entire pipeline, funnel and forecast on a file you paid for once. Start with the Sales KPI Dashboard in Excel ($12.99) if you live in Excel, or the Sales Funnel KPI Dashboard in Google Sheets ($9.99) if you want the cheapest cloud switch. Browse the full range of sales dashboard templates to mix and match formats.
Prefer to see the templates in action first? Watch build walk-throughs and tutorials on our YouTube channel: youtube.com/@NextGenTemplates.
Related: Moving off another platform? See our Smartsheet alternatives — 8 work management templates in Excel & Google Sheets.
Also worth reading: Once the pipeline is off subscription, the books are next — see Xero alternatives — 8 accounting templates in Excel & Sheets for cash flow, P&L and reconciliation templates from $1.99.
New to buying templates? See our guide to editable vs locked templates and what to demand from a vendor.
With your sales pipeline running, track its health with the metrics that matter – see the 15 sales KPIs to track in 2026, each with its formula, benchmark range and the mistake teams make.
Before you commit to a pipeline template, make sure you are tracking the right numbers: our explainer on the 12 sales pipeline metrics to track in 2026 gives the exact formula and benchmark range for each one.
Related: 10 AR & AP metrics (DSO/DPO) to track in 2026 – the receivables and payables KPIs to watch, with formulas, benchmarks and 8 ready-made dashboard templates.