

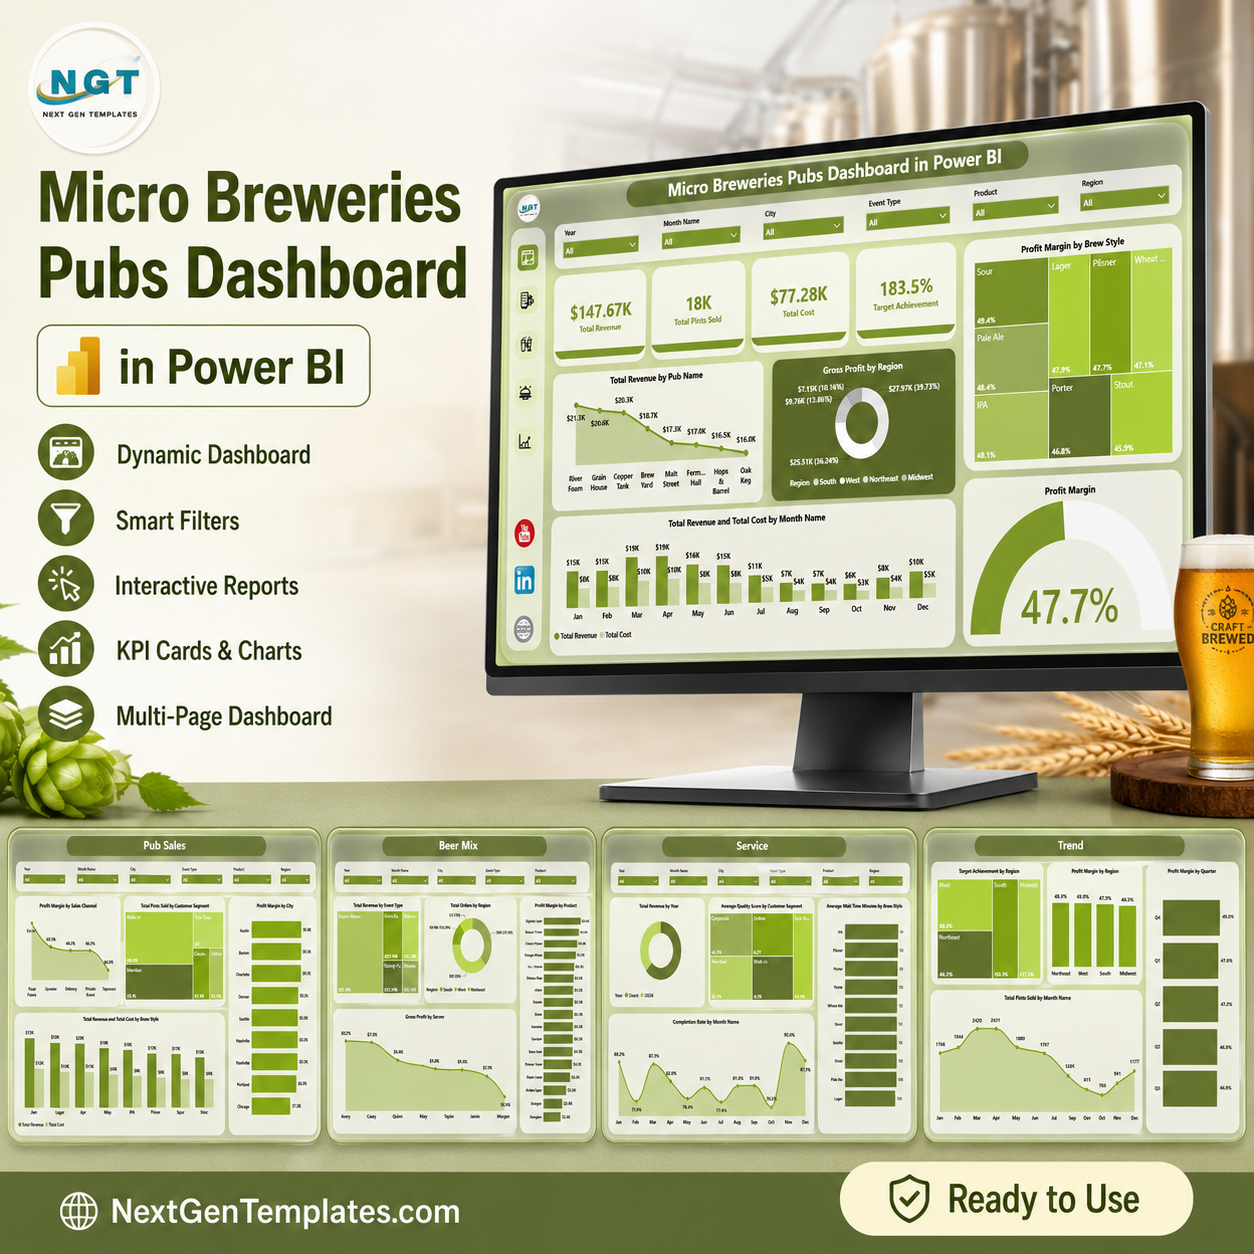
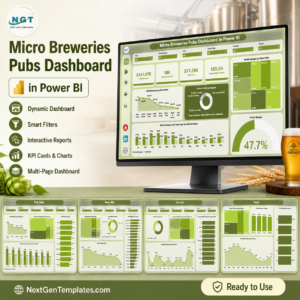
Micro Breweries Pubs Dashboard in Power BI gives brewery owners, pub managers, taproom operators, and food and beverage analysts a ready .pbix reporting file with 5 Power BI report pages, 4 executive KPI cards, 17 focused visuals, and slicer-driven filtering. Pub and microbrewery margins can change quickly when pints sold, product cost, brew style mix, service speed, and regional targets move in different directions. This dashboard turns those moving parts into one review-ready Power BI report. Built by PK, trusted by 300K+ learners across YouTube channels, it is a one-time download with no monthly SaaS subscription.
Key Features of Micro Breweries Pubs Dashboard in Power BI
- 5 Power BI pages: Overview Page, Pub Sales, Beer Mix, Service, and Trend.
- Executive KPI cards: Total Revenue, Total Pints Sold, Total Cost, and Target Achievement.
- Interactive slicers: Filter pub and brewery performance quickly by location, period, region, brew style, product, channel, and customer segment.
- Revenue and cost views: Compare Total Revenue and Total Cost across months, brew styles, years, and event types.
- Profitability analysis: Review gross profit and profit margin by region, city, sales channel, brew style, server, and quarter.
- Power BI-ready structure: Open the .pbix file in Power BI Desktop and replace the sample data connection with your own source.
What’s Inside the Micro Breweries Pubs Dashboard in Power BI
1 – Overview Page
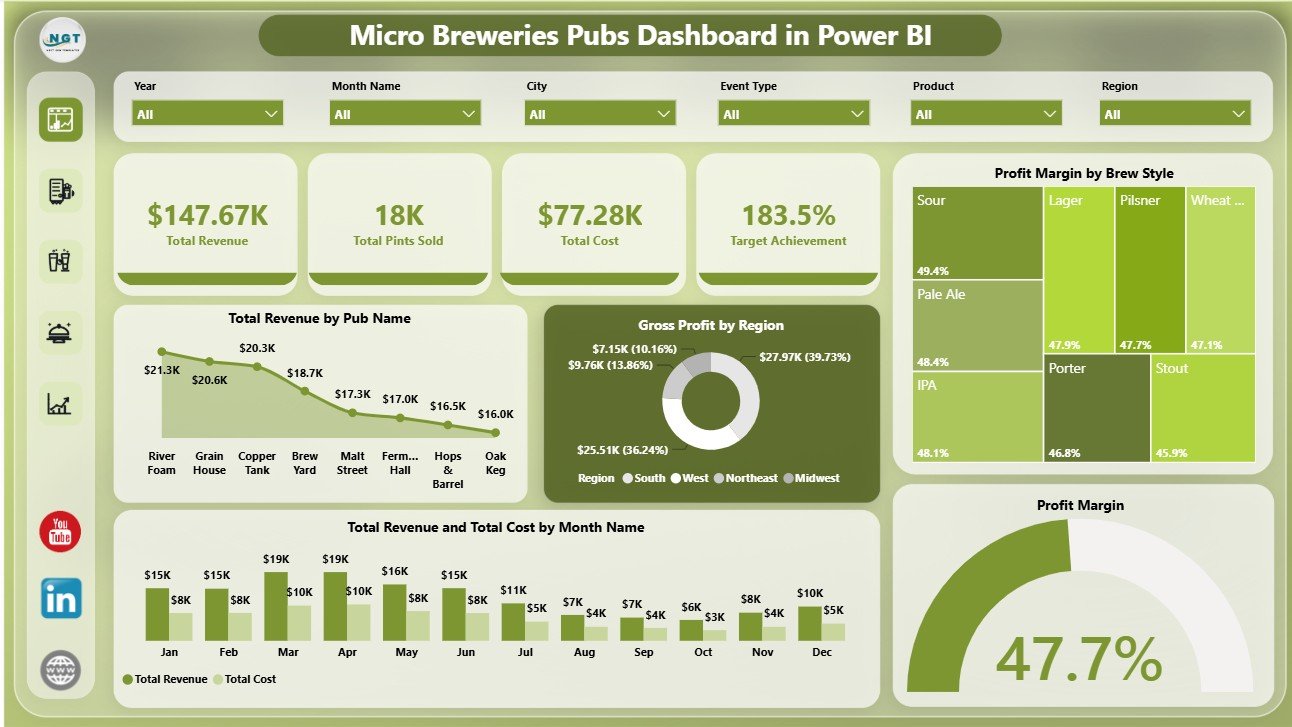
The Overview Page gives a high-level snapshot of microbrewery and pub performance. The top cards show Total Revenue, Total Pints Sold, Total Cost, and Target Achievement, helping managers understand sales scale, drink volume, cost pressure, and progress against target in one screen.
Total Revenue by Pub Name: This chart ranks pub locations by revenue. It helps owners compare outlets and spot pubs that may need pricing, menu, promotion, or staffing support.
Gross Profit by Region: This visual shows which regions are producing the strongest profit contribution. It is useful for regional sales reviews and location-level improvement planning.
Profit Margin by Brew Style: This chart compares margin across beer styles. It helps identify whether popular brews are also profitable enough to support production and tap allocation decisions.
Total Revenue and Total Cost by Month Name: This combined view shows revenue beside cost by month. It helps reveal seasonality, cost spikes, and months where sales growth did not convert into healthier margins.
Profit Margin: This visual gives a quick margin signal for management review. It helps teams connect revenue performance with true profitability instead of only looking at sales volume.
2 – Pub Sales
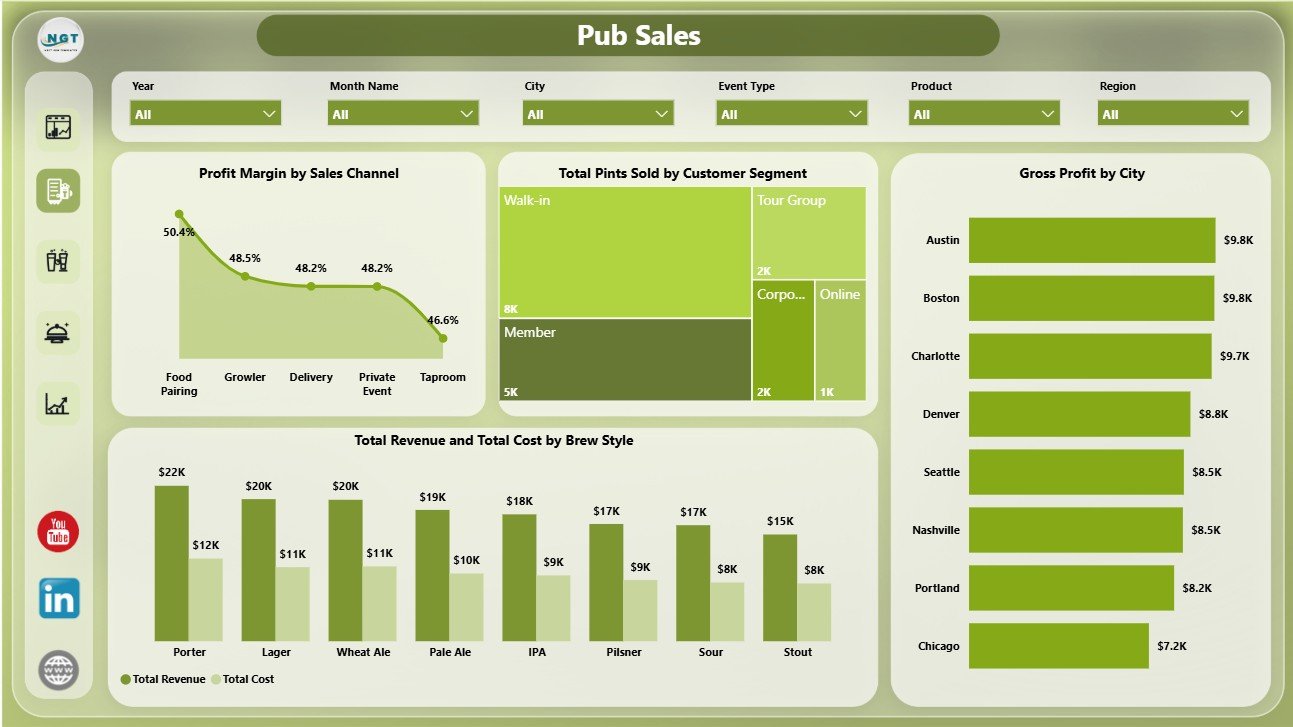
The Pub Sales page focuses on sales channel, customer segment, city, and brew style performance. Profit Margin by Sales Channel compares how channels convert sales into profit. Total Pints Sold by Customer Segment shows which customer groups drive beer volume. Gross Profit by City highlights stronger and weaker city markets. Total Revenue and Total Cost by Brew Style connects product mix with cost control.
3 – Beer Mix
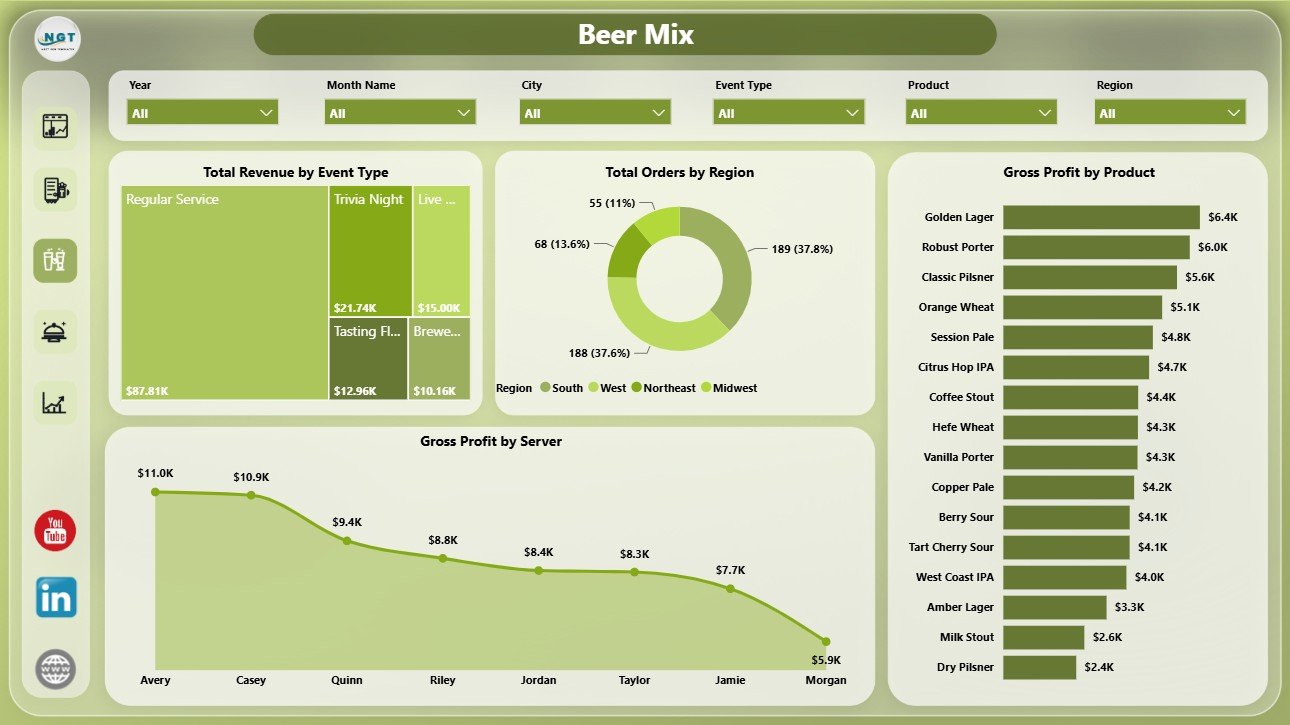
The Beer Mix page helps managers review event, region, product, and server contribution. Total Revenue by Event Type shows which events generate the most sales. Total Orders by Region compares order activity by territory. Gross Profit by Product identifies the beer or menu items producing the best return. Gross Profit by Server supports coaching, staffing, and service-performance discussions.
4 – Service
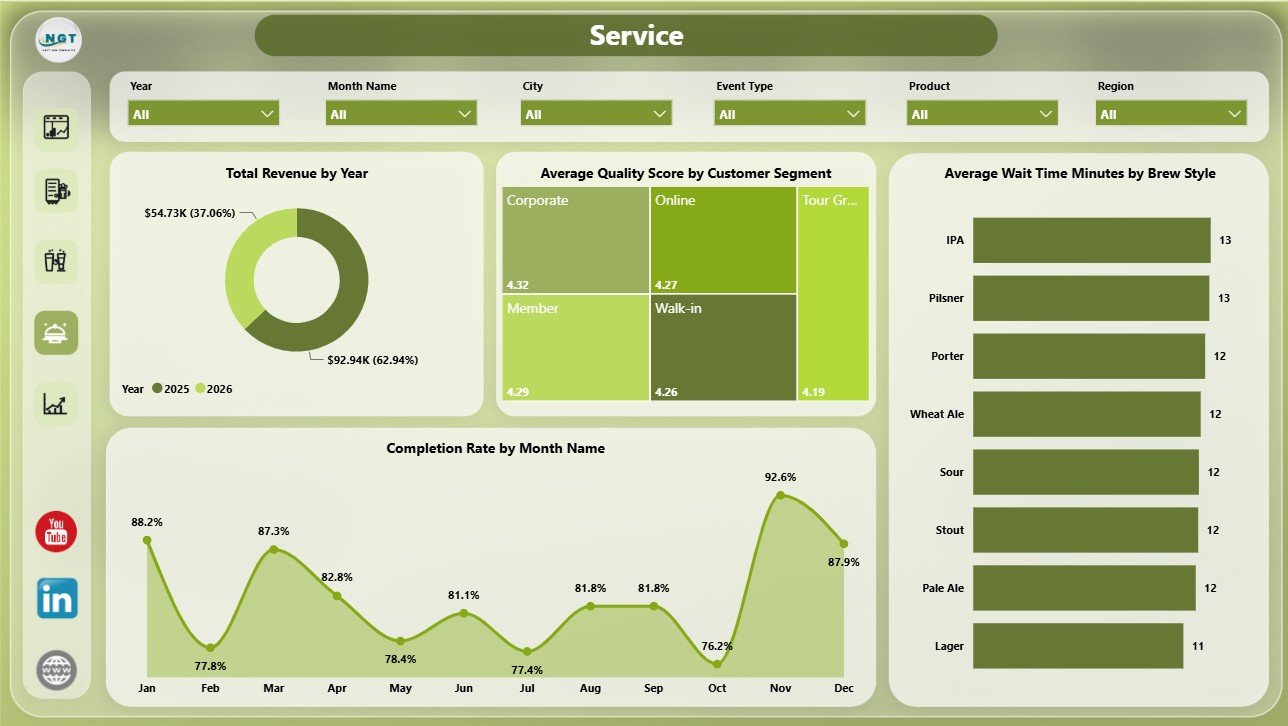
The Service page connects revenue, quality, wait time, and completion performance. Total Revenue by Year gives a yearly sales trend. Average Quality Score by Customer Segment shows how customer groups experience product and service quality. Average Wait Time Minutes by Brew Style highlights styles linked to longer service times. Completion Rate by Month Name tracks monthly execution and service consistency.
5 – Trend
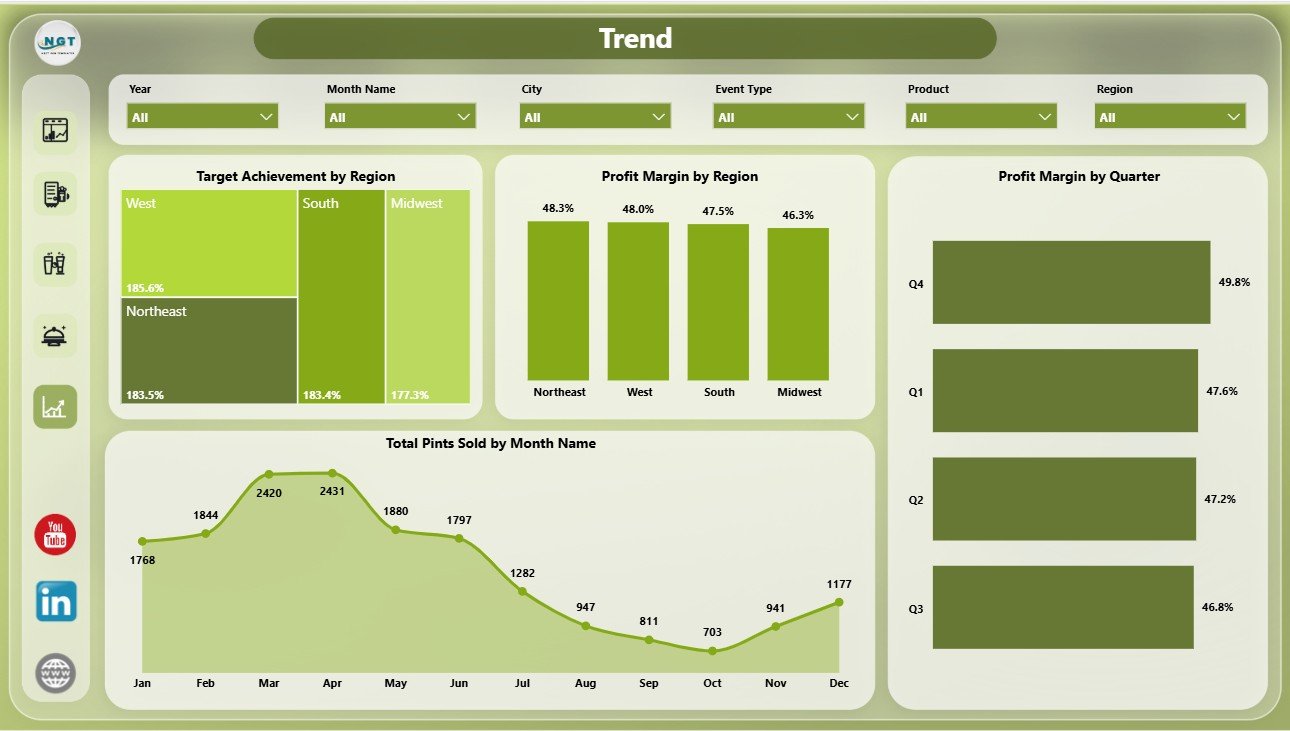
The Trend page is designed for region and time-based performance review. Target Achievement by Region compares actual progress against targets. Profit Margin by Region highlights geographic margin differences. Profit Margin by Quarter shows whether profitability is improving or slipping through the year. Total Pints Sold by Month Name helps managers understand demand seasonality.
Micro Breweries Pubs Dashboard in Power BI vs. Tableau vs. Paid Brewery SaaS – Where This Fits
| Feature | This Power BI dashboard | Tableau or Qlik alternative | Paid brewery or pub SaaS |
|---|---|---|---|
| Cost | $17.99 sale price, one-time | License and build cost | Recurring monthly subscription |
| Platform | Power BI Desktop and Power BI Service | BI platform setup required | Vendor-hosted system |
| Setup time | Open .pbix and replace sample source | Build model and visuals | Implementation and onboarding |
| Real-time team collaboration | Available when published to Power BI Service | Available by plan | Usually included by plan |
| Mobile access | Available through Power BI apps after publishing | Available by plan | Usually included |
| Customizable fields | Editable visuals, model, DAX, labels, and theme | Editable with BI skills | Depends on vendor permissions |
| Share with link | Available through Power BI Service permissions | Available by plan | Depends on seats and plan |
| Year-1 cost at 5 users | $17.99 plus any Microsoft licensing needed | Often hundreds or thousands | Often hundreds or thousands |
| Pub and beer analytics | Revenue, cost, pints, profit, margin, targets, events, service, quality, and trends | Must be built or adapted | May require premium reporting |
Who This Template Is For – and Who It’s Not For
This template is for microbrewery owners, pub managers, taproom supervisors, hospitality finance teams, food and beverage analysts, regional managers, and Power BI consultants who need a ready reporting model for pub and brewery performance.
It is not a POS system, payment terminal, inventory barcode app, recipe management tool, payroll system, or live booking engine. It works best as a Power BI reporting layer after your sales, cost, service, and product data is available in a structured source.
How to Use the Micro Breweries Pubs Dashboard in Power BI
- Download and unzip the product file.
- Open the .pbix file in Power BI Desktop.
- Review the sample pages, cards, visuals, slicers, model, and measures.
- Use Transform Data to connect the report to your own Excel, CSV, database, or exported POS data.
- Keep key fields consistent so visuals and slicers continue to work.
- Refresh the model and review each report page.
- Publish to Power BI Service if you want controlled sharing with managers or team members.
Real-World Use Cases
Elena, taproom manager: checks Total Pints Sold by Month and Profit Margin by Brew Style before planning seasonal taps and tasting promotions.
Marcus, microbrewery owner: compares Total Revenue and Total Cost by Month with Gross Profit by Product to decide which beers deserve more production capacity.
Priya, hospitality analyst: uses region, city, server, sales channel, and event visuals to prepare a monthly operating review for a multi-location pub group.
Frequently Asked Questions
What does this Power BI dashboard track?
It tracks total revenue, total pints sold, total cost, target achievement, gross profit, profit margin, orders, quality score, wait time, completion rate, pub, city, region, brew style, product, event type, server, sales channel, customer segment, month, quarter, and year.
Do I need Power BI Pro to use it?
No. You can open and edit the .pbix file in free Power BI Desktop. Power BI Pro is only needed if you want to publish and share through Power BI Service.
Can I connect my own pub or brewery data?
Yes. Replace the sample source through Power BI’s Transform Data area and refresh the model. Keep the field structure aligned with the template for the fastest setup.
Can I customize the visuals and DAX measures?
Yes. The .pbix file is editable, so you can change visuals, colors, labels, pages, relationships, and measures if you are comfortable with Power BI.
Is this a brewery production system?
No. It is a Power BI analytics dashboard. It does not replace POS, inventory, recipe, payroll, booking, or production management software.
Is this a subscription?
No. It is a one-time downloadable Power BI template from NextGenTemplates.
About the Author
Built by PK – Microsoft Certified Professional with 15+ years of Excel, Google Sheets, and Power BI experience. Founder of NextGenTemplates, reaching 300K+ subscribers across YouTube channels. Every template is hand-built and tested before release.
Explore Related Templates
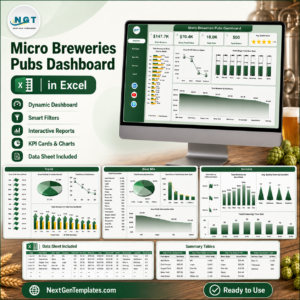
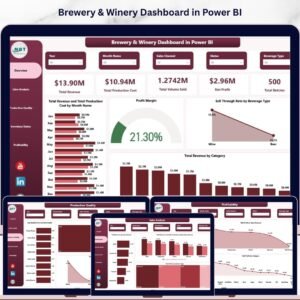
You may also like Micro Breweries Pubs Dashboard in Excel, Brewery & Winery Dashboard in Power BI, and Restaurant Order Data Entry System in Excel. Browse more Power BI Dashboard templates or the full Power BI templates category.
Download the Micro Breweries Pubs Dashboard in Power BI and start reviewing revenue, cost, pints, profit margin, service quality, and regional trends in one editable Power BI file.
Last updated: July 9, 2026.




























Reviews
There are no reviews yet.