

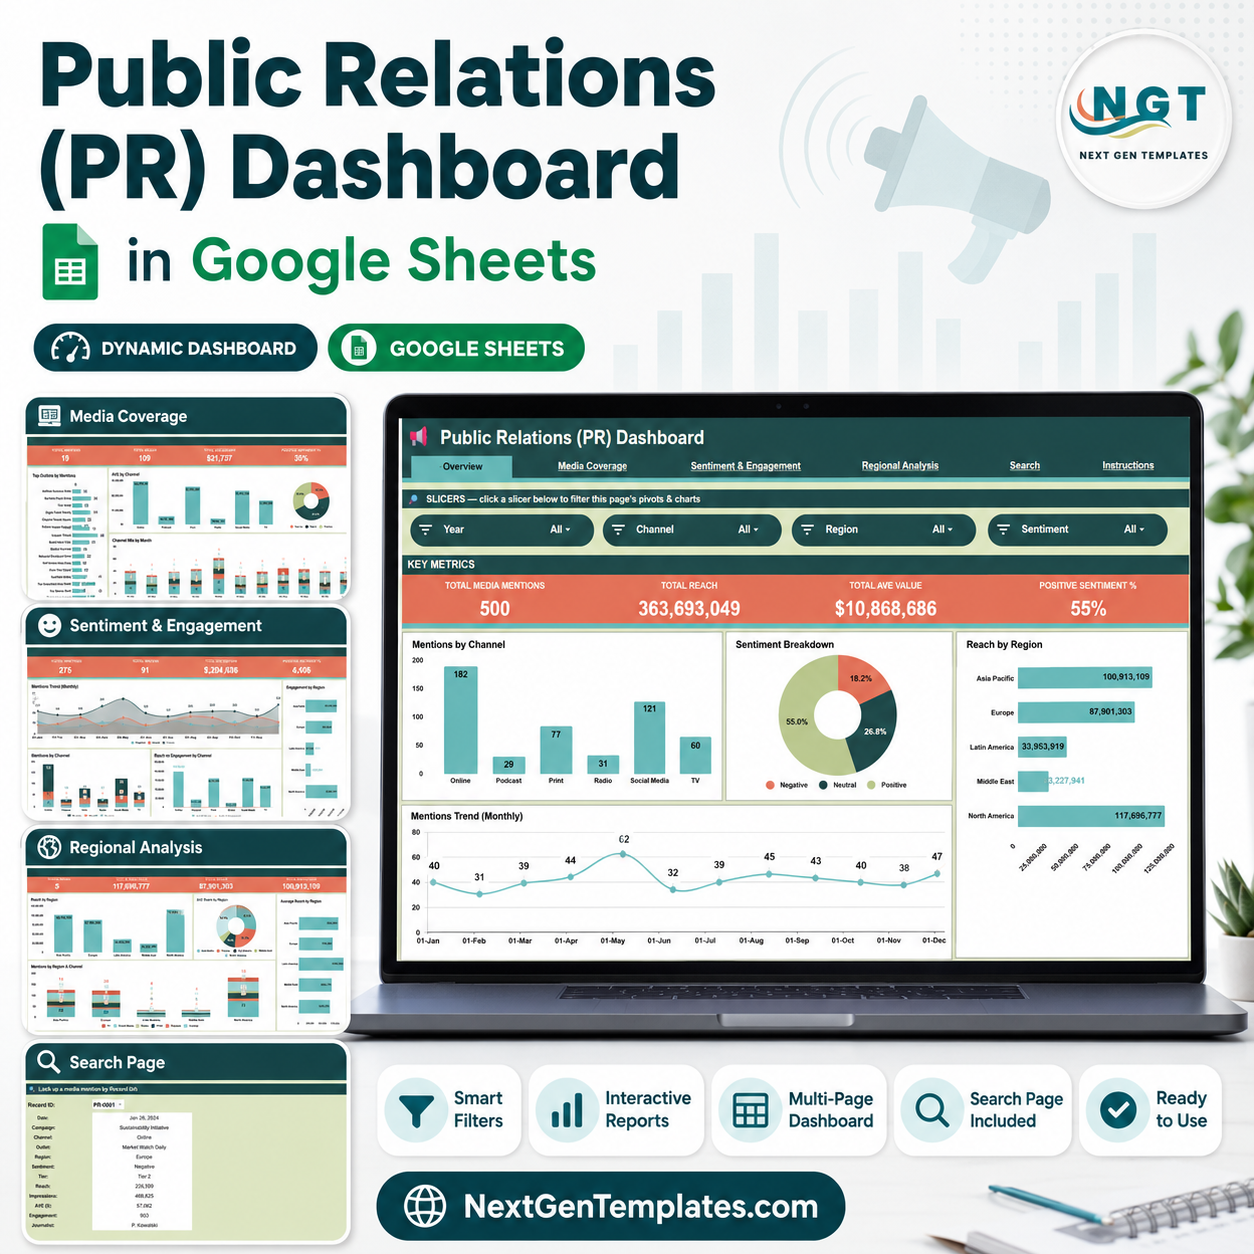
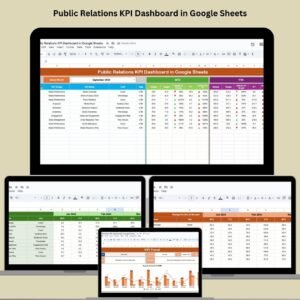
Public Relations (PR) Dashboard in Google Sheets turns one structured PR data sheet into 6 working tabs: 4 KPI cards, 16 analysis charts, multiple slicers, a Record ID search sheet, and an editable data tab. Track Total Media Mentions, Total Reach, Total AVE Value, and Positive Sentiment % in minutes instead of rebuilding manual reports for every campaign review. More than 8,400 teams in 40+ countries use NextGenTemplates for spreadsheet and BI templates. Your purchase is backed by a 7-day file-match review if the delivered template does not match this description.
Key Features of Public Relations (PR) Dashboard in Google Sheets
- 6 Google Sheets tabs: Overview, Media Coverage, Sentiment & Engagement, Regional Analysis, Search Sheet, and Data Sheet.
- 4 executive cards: Total Media Mentions, Total Reach, Total AVE Value, and Positive Sentiment %.
- 16 dashboard charts: Review mentions, sentiment, reach, AVE, outlet tier, engagement, region, channel, and month-level trends.
- Interactive slicers: Filter the dashboard quickly by campaign, channel, outlet, region, sentiment, tier, or date-based fields.
- Record lookup: Search by Record ID and view the selected media mention details without filtering the full data sheet.
- Editable data format: Replace the sample data with your own PR records while keeping the same column structure.
What’s Inside the Public Relations (PR) Dashboard in Google Sheets
Overview Page
The Overview page gives PR managers a fast campaign health snapshot. The top cards summarize Total Media Mentions, Total Reach, Total AVE Value, and Positive Sentiment %, so teams can review visibility, potential media value, and brand tone in one view.
Media Mentions by Channel: Shows how mentions are distributed across channels such as online media, print, TV, radio, social, or podcasts. Use it to see which channels are creating the most coverage and where outreach may need support.
Mentions by Sentiment: Breaks mentions into positive, neutral, and negative categories. This helps communications teams understand whether coverage volume is also creating the right brand perception.
Reach by Region: Compares audience reach across regions. It is useful when campaign goals include regional visibility or market-specific PR performance.
Media Mentions by Month: Tracks mention volume over time. Use it to spot campaign peaks, quiet periods, and month-over-month movement after launches or announcements.
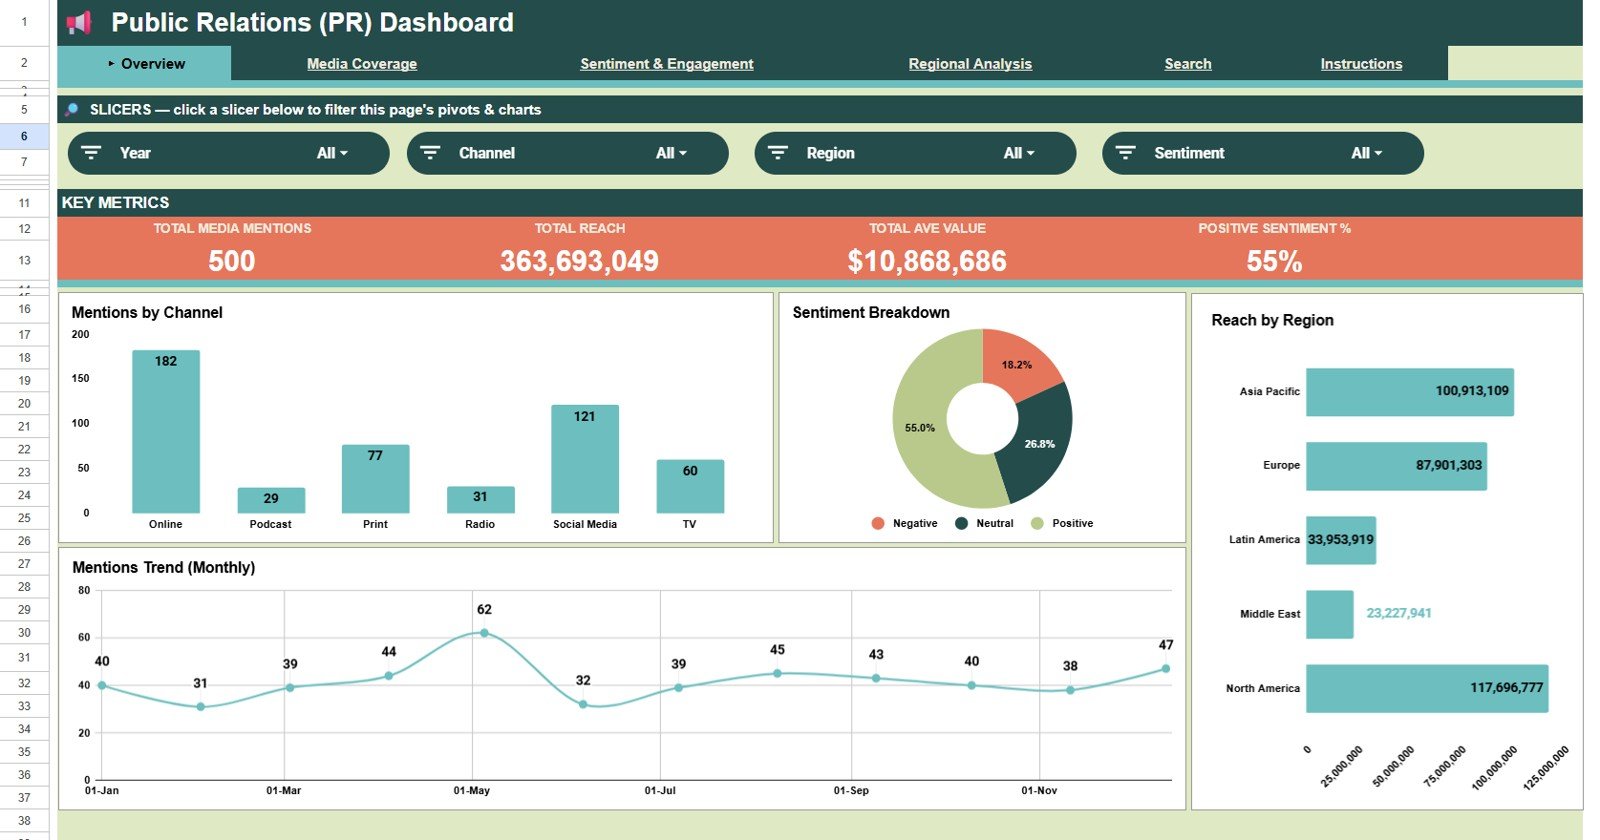
Public Relations (PR) Dashboard in Google Sheets
Media Coverage
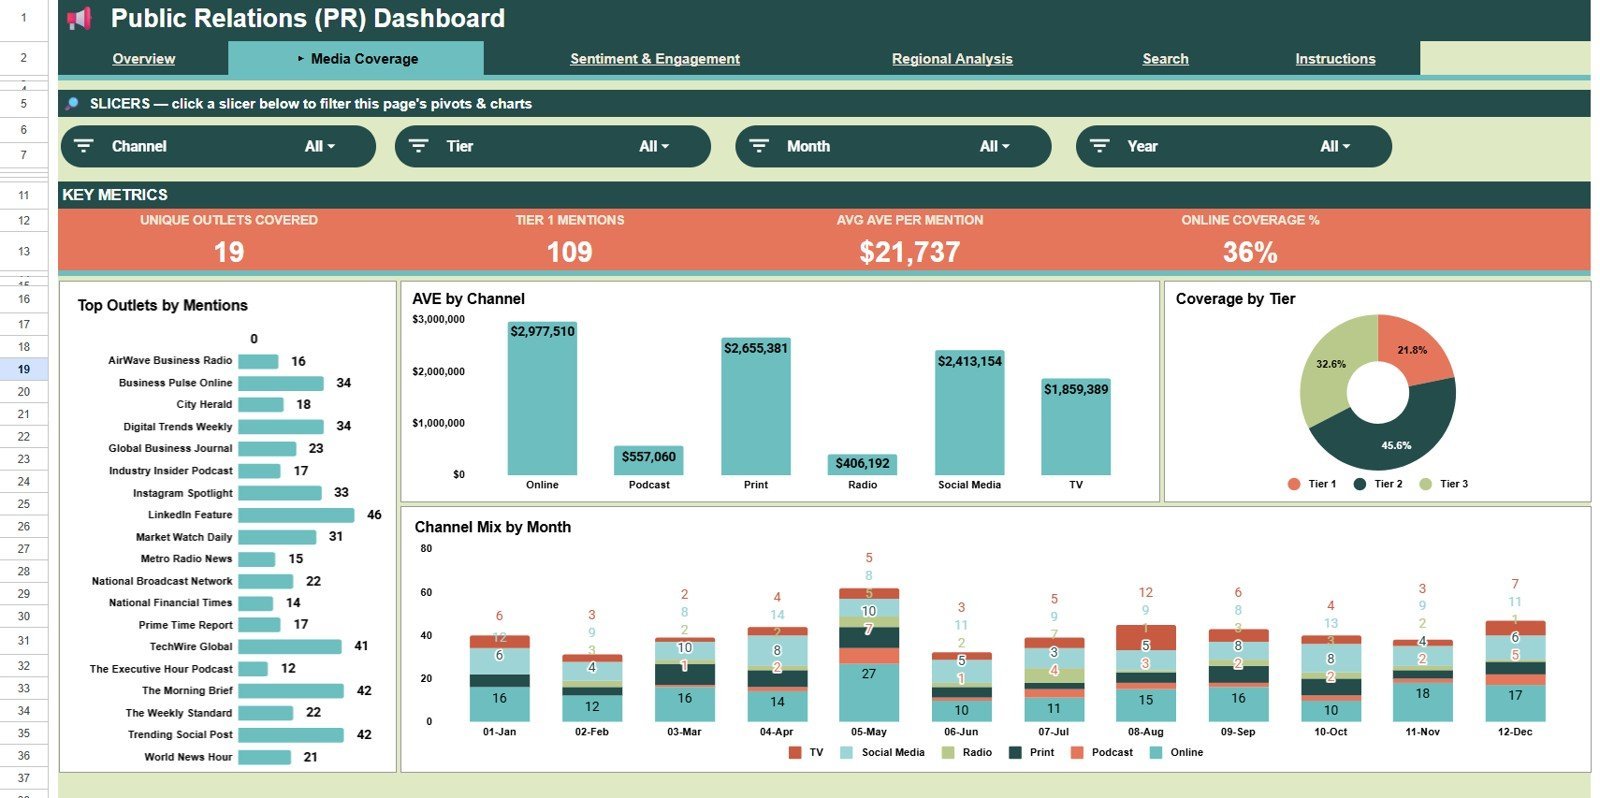
The Media Coverage tab focuses on outlet and channel performance. Mentions by Outlet shows which publications or media sources are creating the most coverage. AVE by Channel compares Advertising Value Equivalency across coverage channels so teams can understand value contribution.
Coverage by Tier separates top-tier, mid-tier, and lower-tier coverage for quality review. Channel Mix by Month shows how the media mix changes over time, helping PR teams evaluate whether outreach is becoming broader or too dependent on one channel.
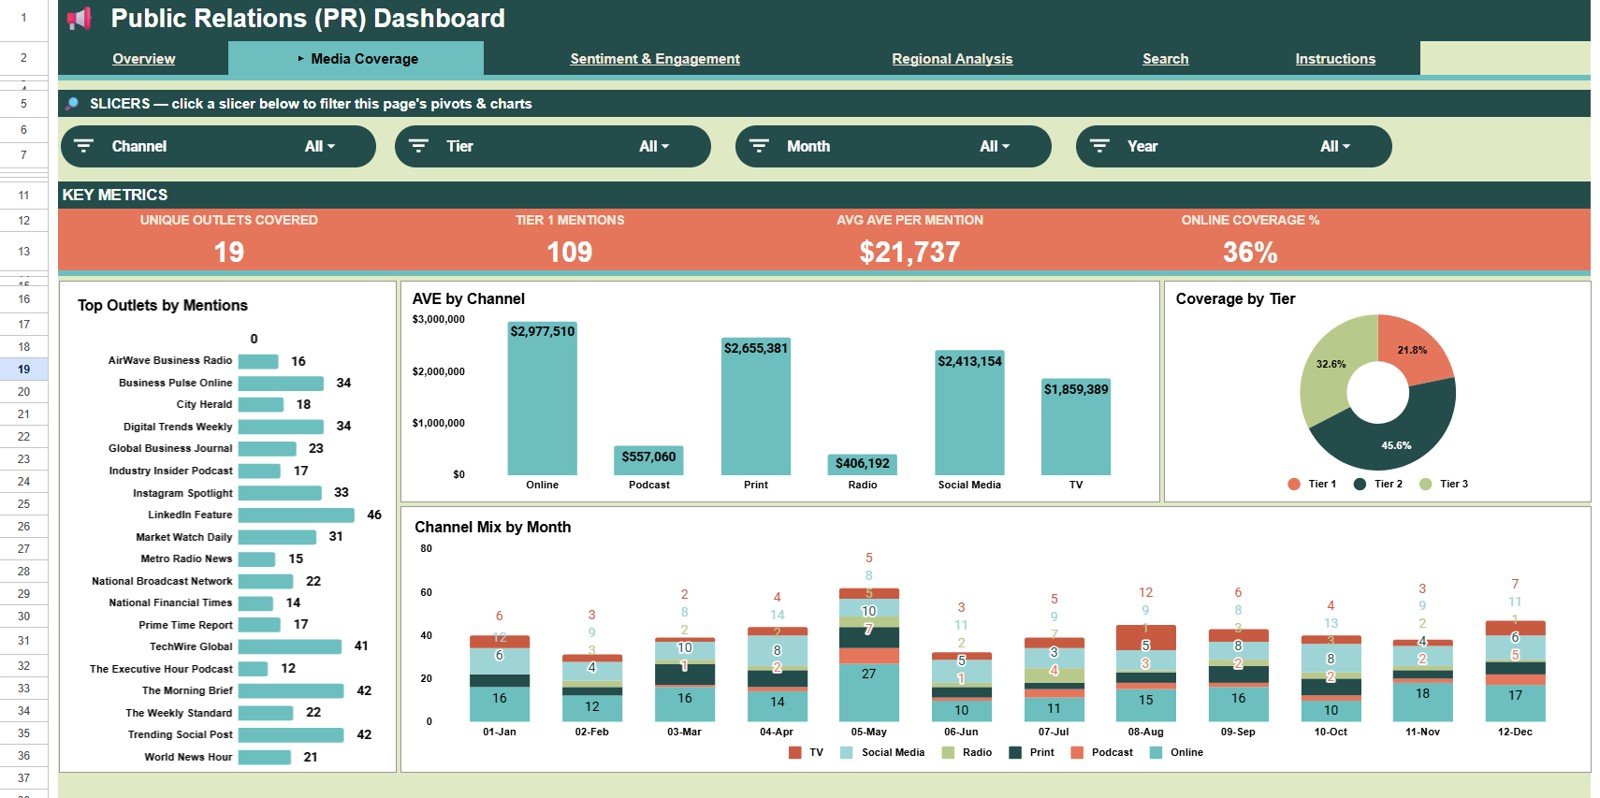
Media Coverage
Sentiment & Engagement
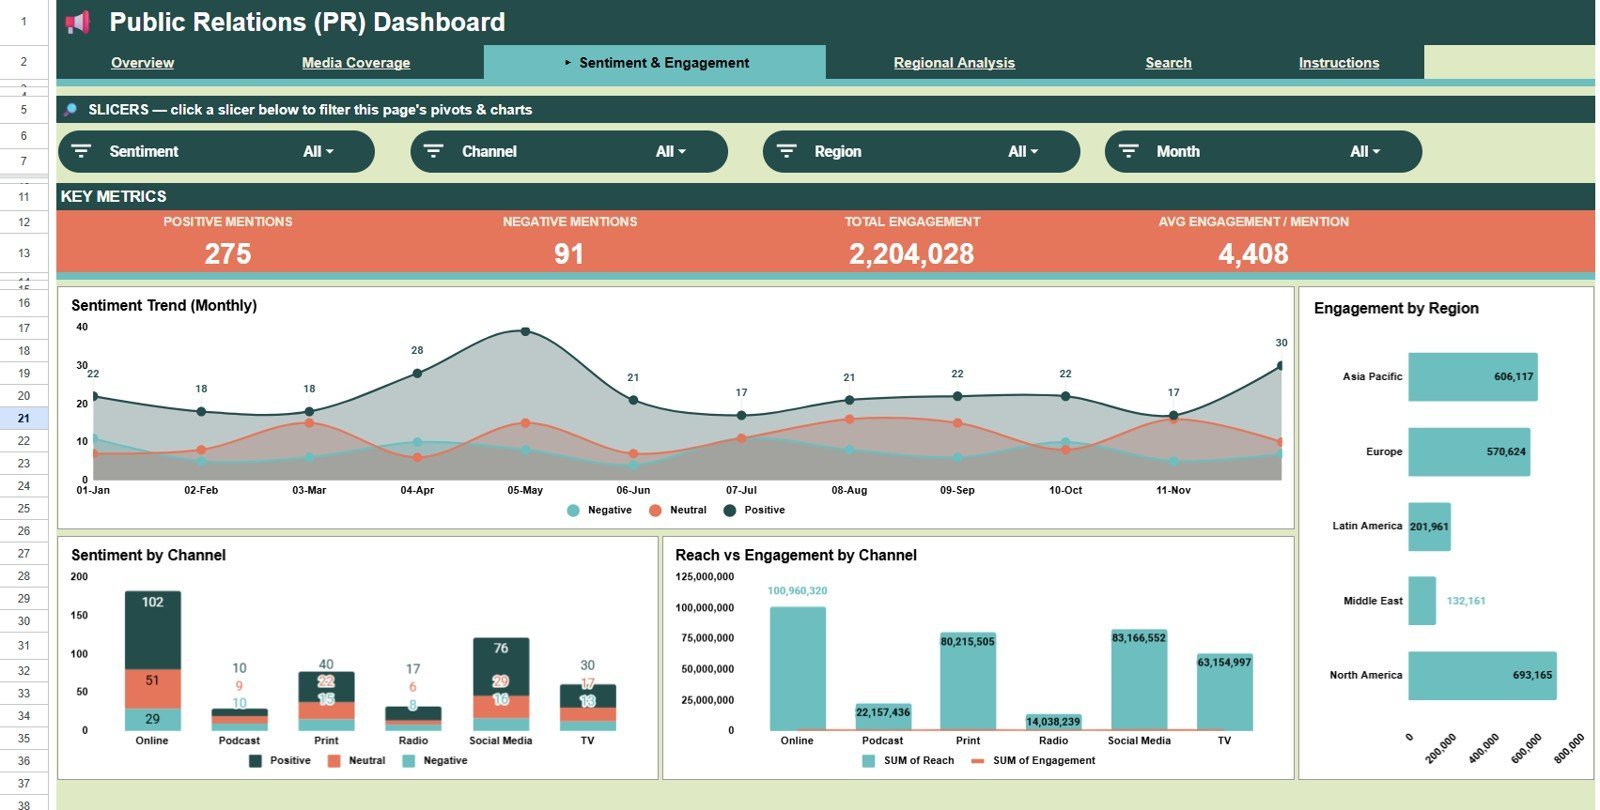
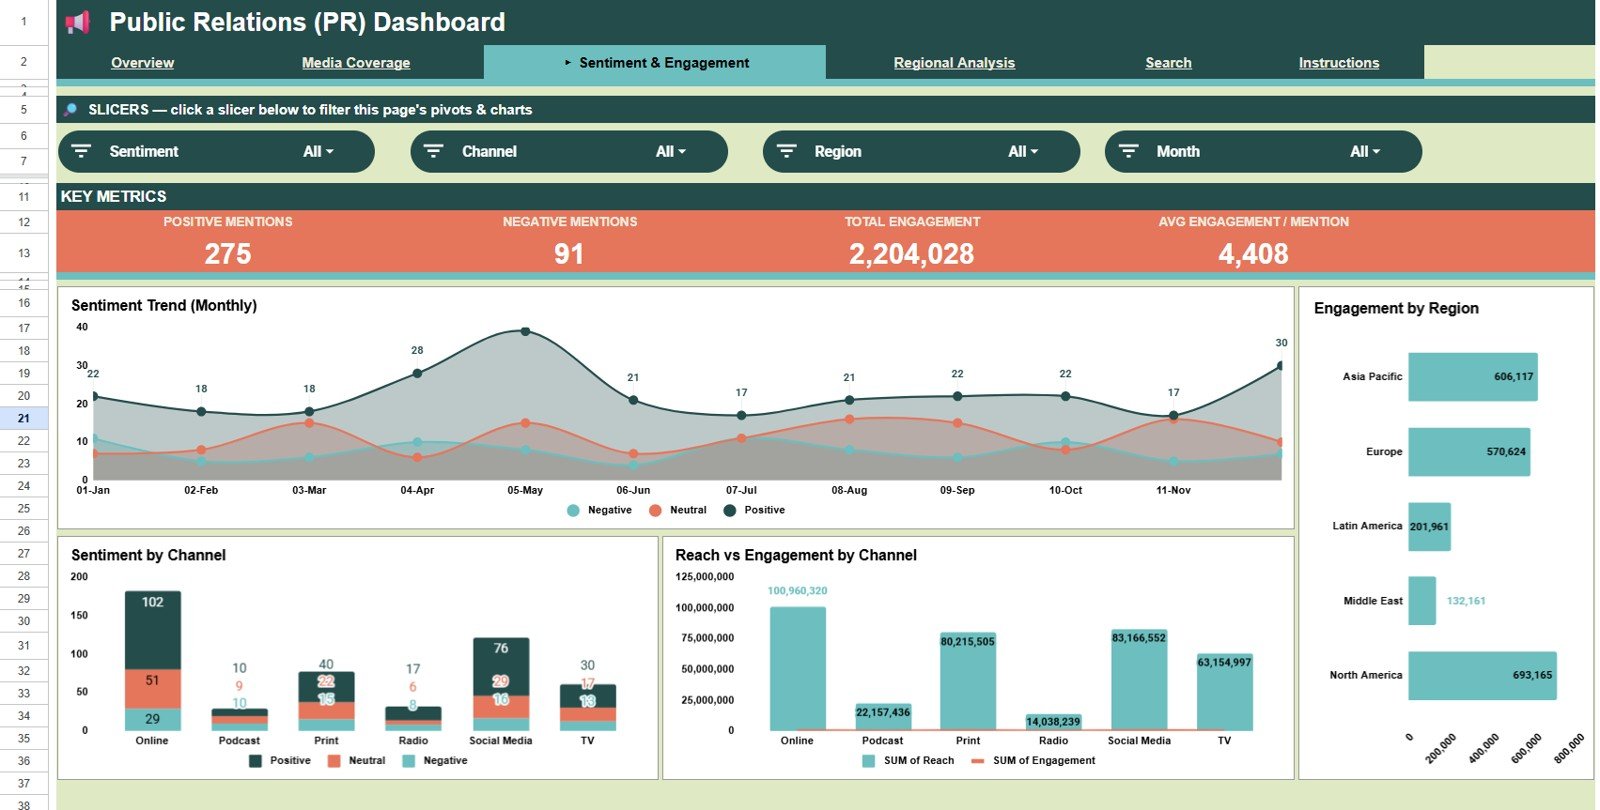
The Sentiment & Engagement tab connects tone with audience response. Sentiment by Month reveals whether public perception is improving, staying flat, or turning negative during campaign periods. Engagement by Region helps compare where audiences are reacting most strongly.
Sentiment by Channel shows which channels carry the best or weakest tone. Reach and Engagement by Channel compares audience size with interaction, helping teams separate high-reach passive coverage from channels that also generate response.
Sentiment & Engagement
Regional Analysis
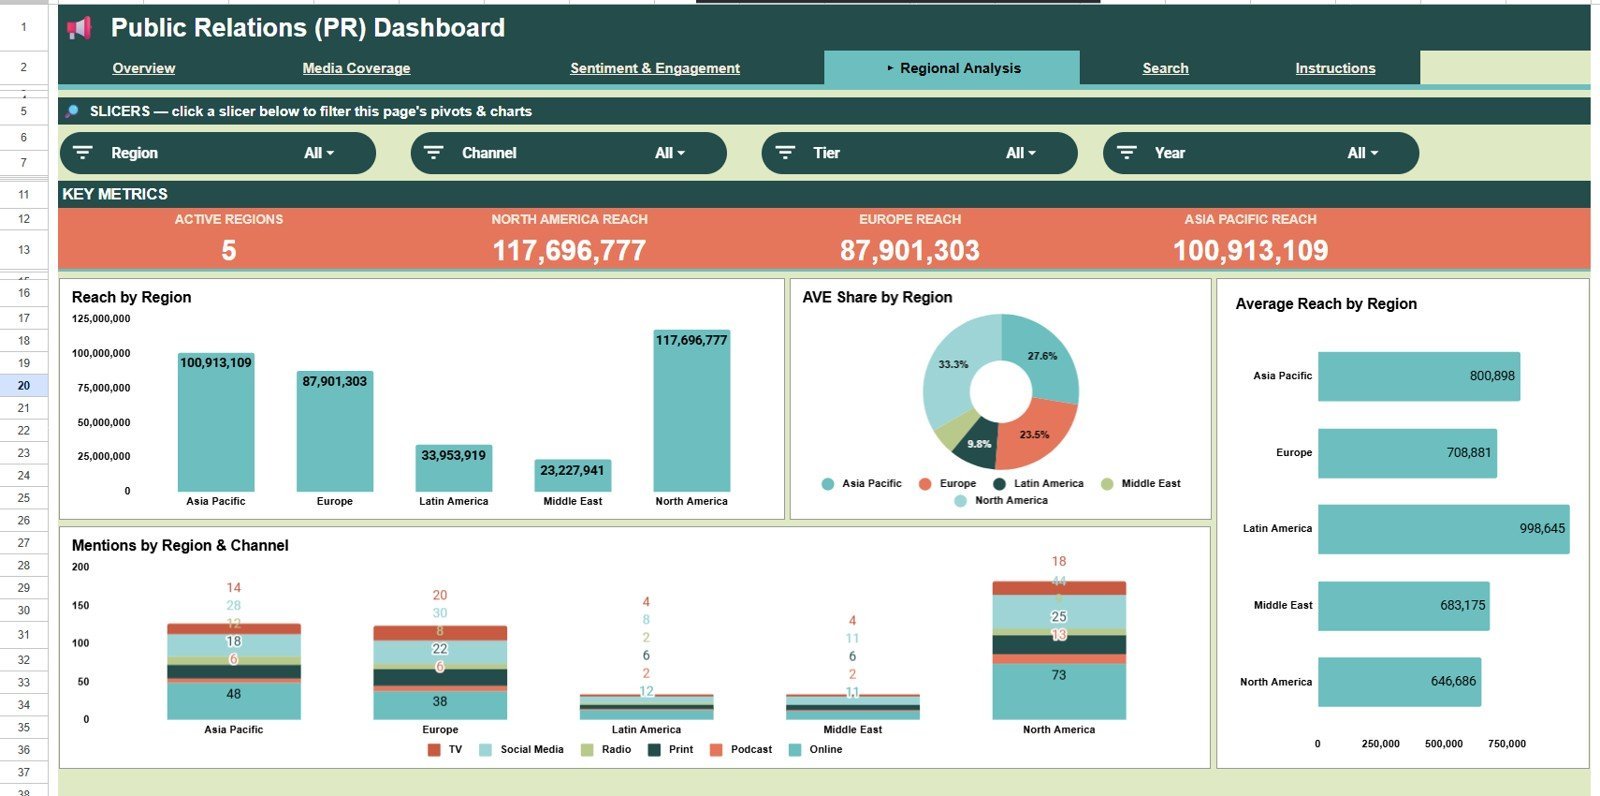
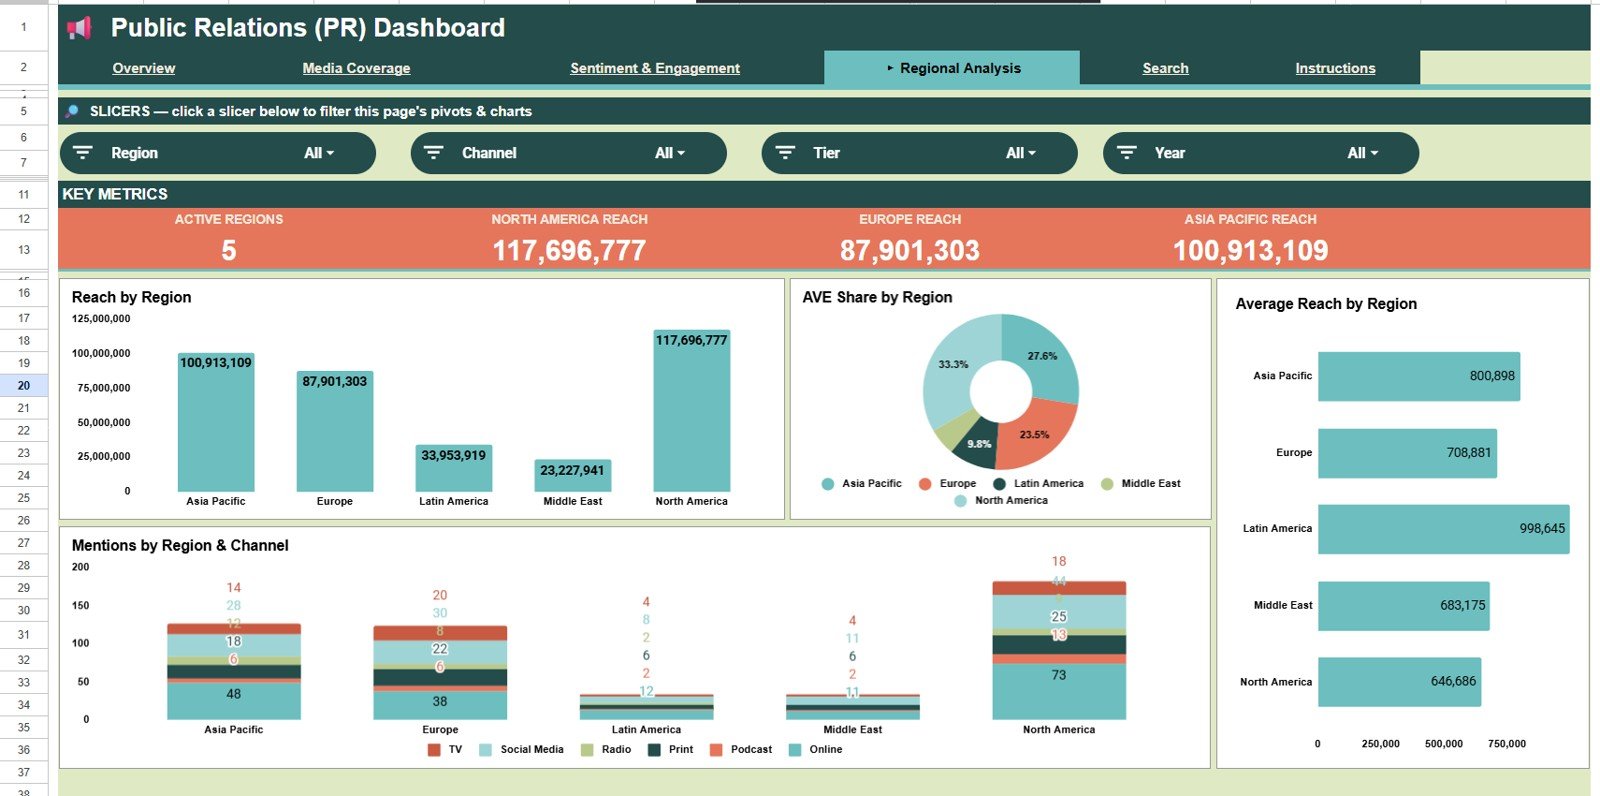
The Regional Analysis tab helps communications teams review market-level outcomes. Reach by Region highlights where coverage is generating the largest audience. AVE Share by Region shows which regions contribute the greatest share of estimated media value.
Average Reach by Region compares typical reach per mention across markets. Mentions by Region and Channel shows whether each region is driven by digital, print, TV, social, or other channels.
Regional Analysis
Search Sheet Tab
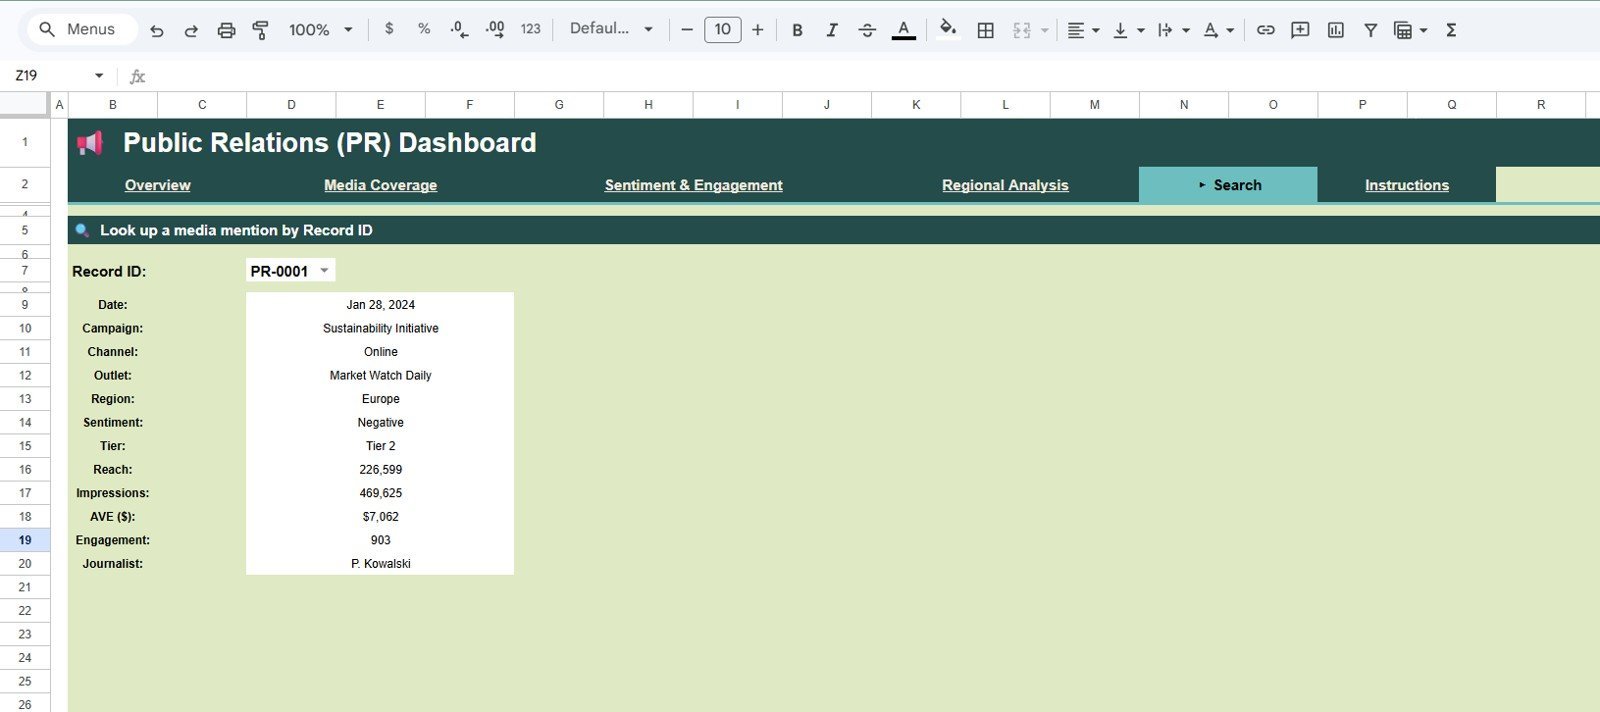
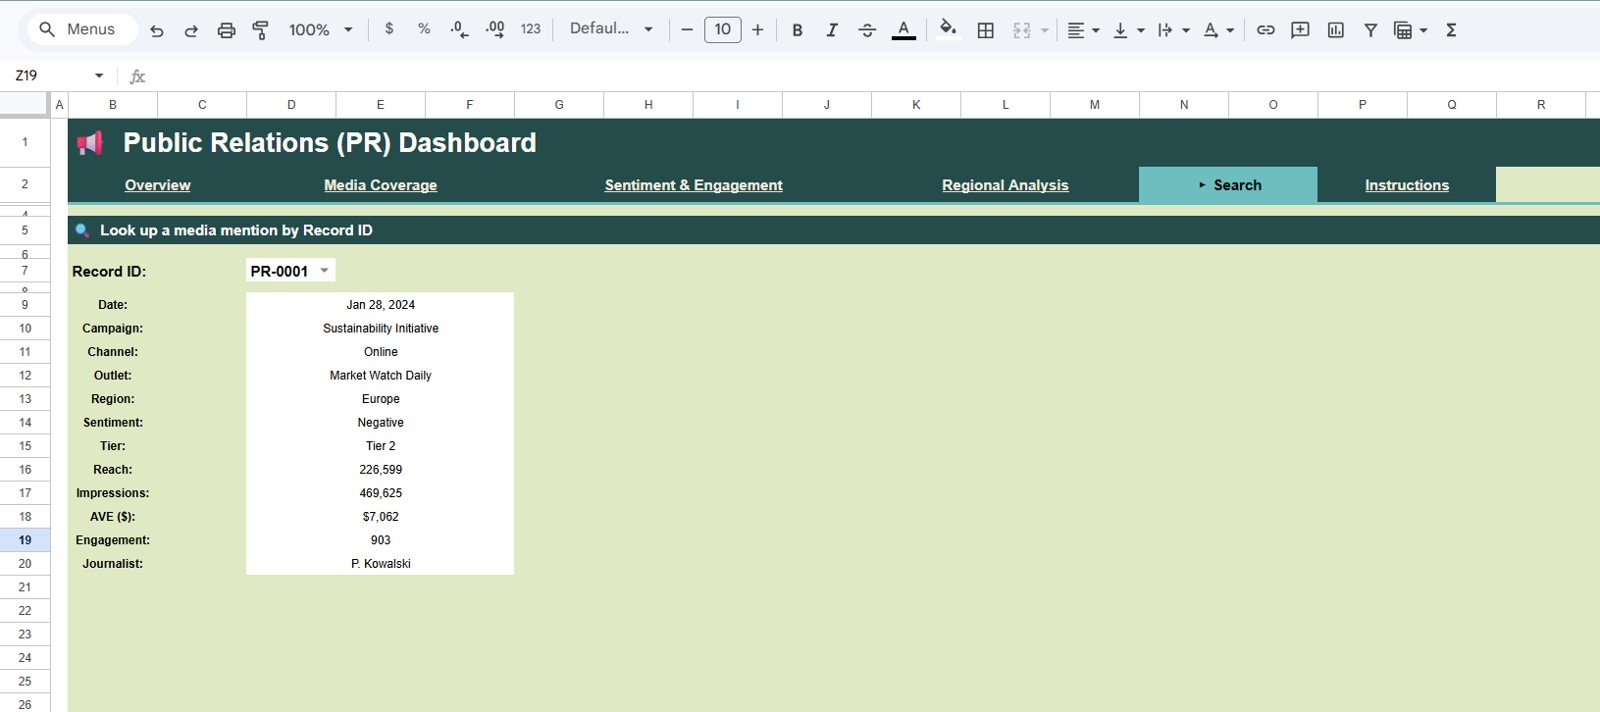
The Search Sheet lets you look up a media mention by Record ID and review the selected record details, including date, campaign, channel, outlet, region, sentiment, tier, reach, impressions, AVE, engagement, and journalist. It is useful for quick record-level checks during reporting calls.
Search Sheet tab
Data Sheet Tab
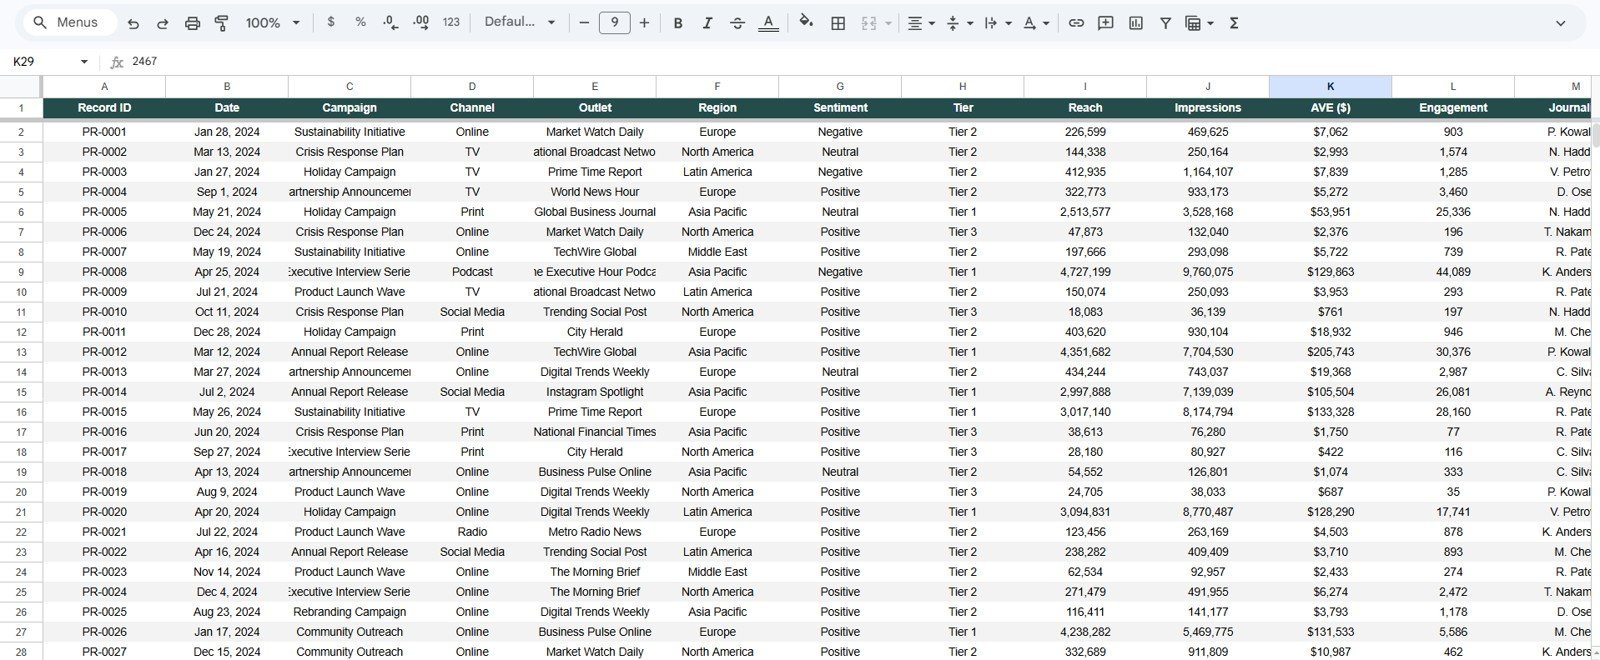
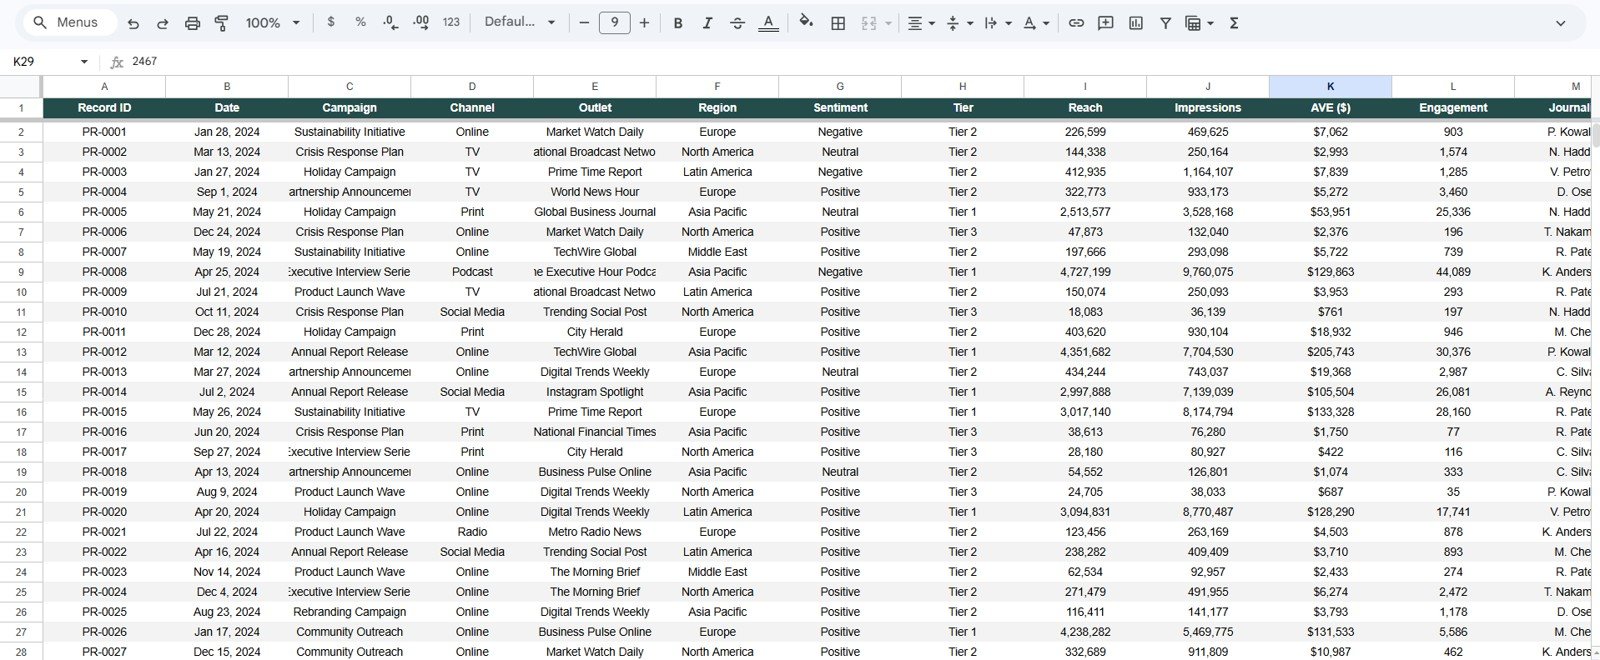
The Data Sheet is where you add or replace PR records in the same format as the sample data. Keep the headers and data structure consistent so the cards, charts, slicers, and search fields continue updating correctly.
Data Sheet tab
Public Relations (PR) Dashboard in Google Sheets vs. Microsoft Excel Dashboard vs. Paid CRM/SaaS – Where This Fits
| Feature | This Google Sheets dashboard | Microsoft Excel dashboard | Paid PR measurement SaaS |
|---|---|---|---|
| Cost | $9.99 sale price, one-time | Template or custom workbook cost | Recurring monthly or annual fee |
| Platform | Google Sheets in browser | Excel desktop or Microsoft 365 | Vendor-hosted web platform |
| Setup time | Copy sheet, replace sample data, use slicers | Open workbook and refresh or rebuild | Implementation, onboarding, and setup |
| Real-time team collaboration | Built into Google Drive sharing | Requires OneDrive or SharePoint | Usually available by plan |
| Customizable fields | Editable columns, charts, labels, and formulas | Editable workbook | Limited by vendor configuration |
| Share with link | Yes, using Google Drive permissions | Possible through Microsoft cloud | Role-based user accounts |
| Year-1 cost at 5 users | $9.99 plus Google Workspace if applicable | Template cost plus Microsoft licensing | Often hundreds or thousands |
| PR reporting fit | Best for exported PR coverage data and recurring reports | Best for offline spreadsheet workflows | Best for live monitoring and enterprise integrations |
Who This Template Is For – and Who It’s Not For
This template is for PR agencies, corporate communications teams, media relations managers, marketing analysts, nonprofit communications teams, and consultants who need a shareable dashboard for media mentions, sentiment, reach, AVE, engagement, regions, outlets, tiers, and journalists.
It is not a live media monitoring system, journalist database, press release distribution platform, crisis alert tool, or social listening platform. Use it as a reporting layer after exporting or entering approved PR coverage data.
How to Use the Public Relations (PR) Dashboard in Google Sheets
- Open the PDF guide included with your purchase and use the Google Sheets copy link.
- Create your editable copy in Google Drive.
- Go to the Data Sheet and replace the sample records with your PR coverage data.
- Keep the same columns for date, campaign, channel, outlet, region, sentiment, tier, reach, impressions, AVE, engagement, and journalist.
- Use slicers on the dashboard pages to filter by campaign, channel, region, sentiment, tier, or date.
- Use the Search Sheet to look up a single media mention by Record ID.
Real-World Use Cases
Ana, PR agency account lead: uses the Overview and Media Coverage tabs before client calls to explain which channels, outlets, and months created the most coverage.
Marcus, corporate communications manager: reviews Sentiment & Engagement after a product launch to see whether high-reach coverage was positive, neutral, or negative.
Priya, regional marketing analyst: uses Regional Analysis to compare reach, AVE share, average reach, and channel mix across target markets.
Frequently Asked Questions
What does the Public Relations (PR) Dashboard in Google Sheets track?
It tracks media mentions, reach, AVE value, positive sentiment percentage, channel mix, outlet performance, coverage tier, engagement, region, month, journalist, and record-level media mention details.
Can I replace the sample data with my own PR data?
Yes. Add your records to the Data Sheet in the same format so the dashboard cards, charts, slicers, and Search Sheet continue working correctly.
Does this dashboard connect live to media monitoring tools?
No. It is built for Google Sheets data entry or exported PR coverage data, not live API monitoring from media platforms.
Can multiple team members use it?
Yes. Because it runs in Google Sheets, you can share the copied file with approved team members using Google Drive permissions.
Is this a subscription?
No. This is a one-time template purchase from NextGenTemplates. Google Workspace costs, if any, are separate.
About the Author
Built by PK – Microsoft Certified Professional with 15+ years of Excel, Google Sheets, and Power BI experience. Founder of NextGenTemplates, reaching 300K+ subscribers across YouTube channels. Every template is hand-built and tested before release.
Explore Related Templates
You may also like the Public Relations KPI Dashboard in Google Sheets, Channel Performance Analytics Dashboard in Google Sheets, Content Marketing KPI Dashboard in Google Sheets, and Marketing and Social Media Analytics Kit. Browse more Google Sheets templates and Google Sheets dashboard templates.
Watch the step-by-step video Demo:
Download the Public Relations (PR) Dashboard in Google Sheets to turn media mentions, reach, AVE, sentiment, outlets, channels, regions, and engagement into a focused reporting dashboard.
Last updated: July 6, 2026.
































Reviews
There are no reviews yet.