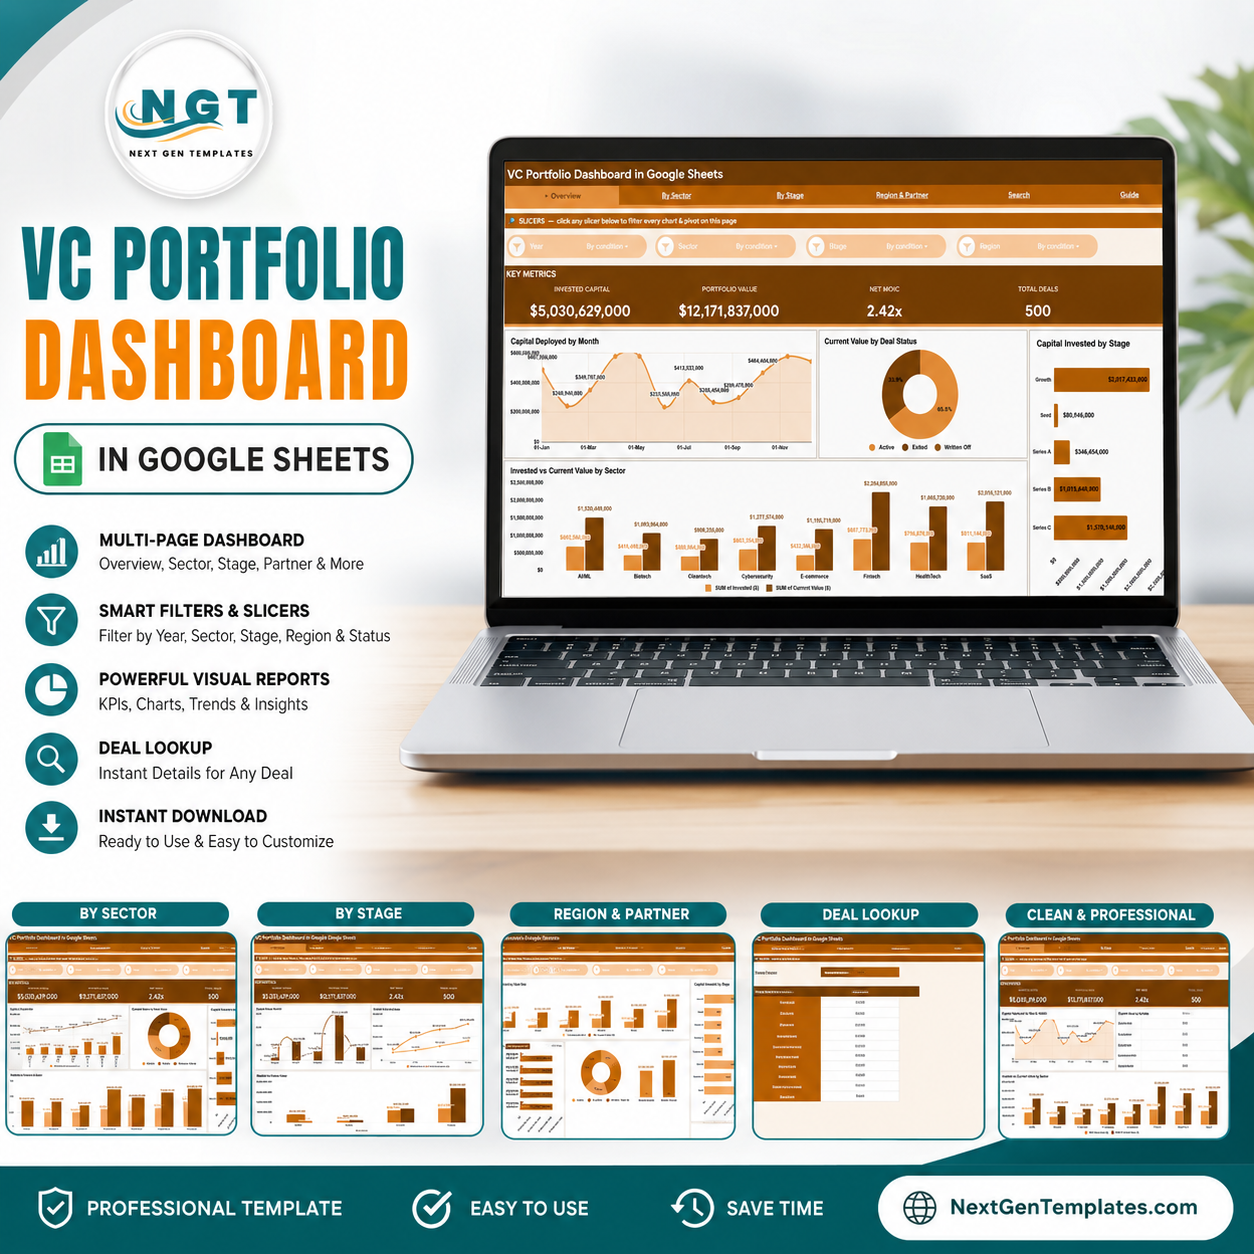


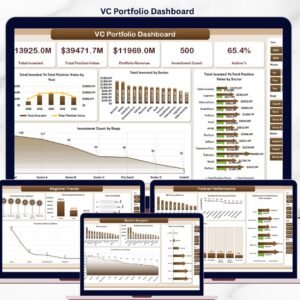
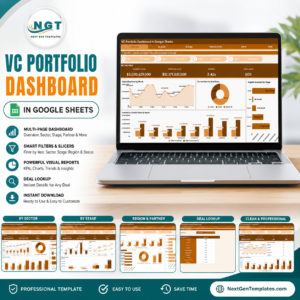
The VC Portfolio Dashboard in Google Sheets tracks 4 fund-level KPIs — Invested Capital, Portfolio Value, Net MOIC, and Total Deals — across 6 connected tabs with 16 pre-built charts and slicer filters. Setup takes under 10 minutes: replace the sample deals on the Data tab and every page updates automatically.
🌍 Join 8,400+ teams in 40+ countries using NextGenTemplates to replace paid SaaS tools with one-time-purchase Excel, Google Sheets, Power BI, and HTML templates.
✅ Instant access · One-time payment · No subscription · No per-seat fees · Lifetime access
🔑 Key Features of the VC Portfolio Dashboard in Google Sheets
This Google Sheets template gives venture capital and angel investors a live view of fund performance without exporting data to a paid platform. Every metric recalculates the moment a new deal is entered on the Data tab.
- 📊 Four headline KPIs — the Overview tab surfaces Invested Capital, current Portfolio Value, Net MOIC (multiple on invested capital), and Total Deals so you can read fund health in one glance.
- 📈 Sixteen analysis charts across four dedicated tabs cover capital deployment over time, sector concentration, deal-stage distribution, and region/partner attribution.
- 🧩 Slicer-based filtering on the Overview lets you filter the entire dashboard by sector, stage, region, or deal status with a single click.
- 🔍 Deal Search tab returns 12 fields for any chosen Deal ID — company, sector, stage, region, lead partner, investment date, invested amount, current value, MOIC, ownership percent, company valuation, and status.
- 👥 Lead-partner and region attribution shows who sourced each deal and where capital is concentrated geographically.
📦 What’s Inside the VC Portfolio Dashboard in Google Sheets
The workbook is built as 6 linked tabs. Each analysis page reads from a single Data tab, so you maintain one list of deals and every chart, card, and lookup stays in sync.
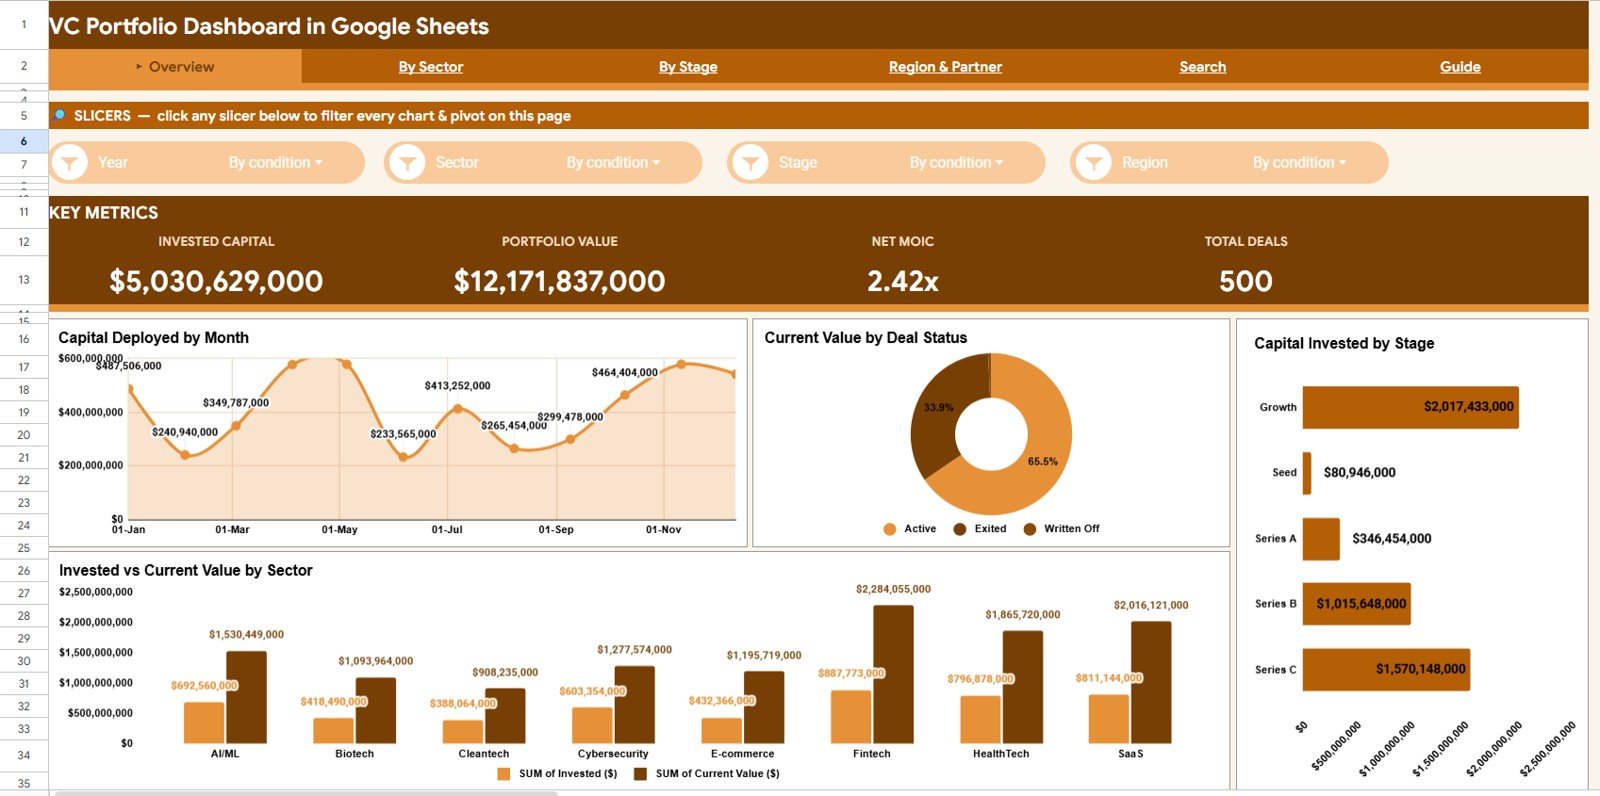
Overview Page
The landing tab shows the four KPI cards — Invested Capital, Portfolio Value, Net MOIC, and Total Deals — above four charts: Capital Deployed by Month, Current Value by Deal Status, Capital Invested by Stage, and Invested vs Current Value by Sector. Slicers across the top filter the whole page instantly.
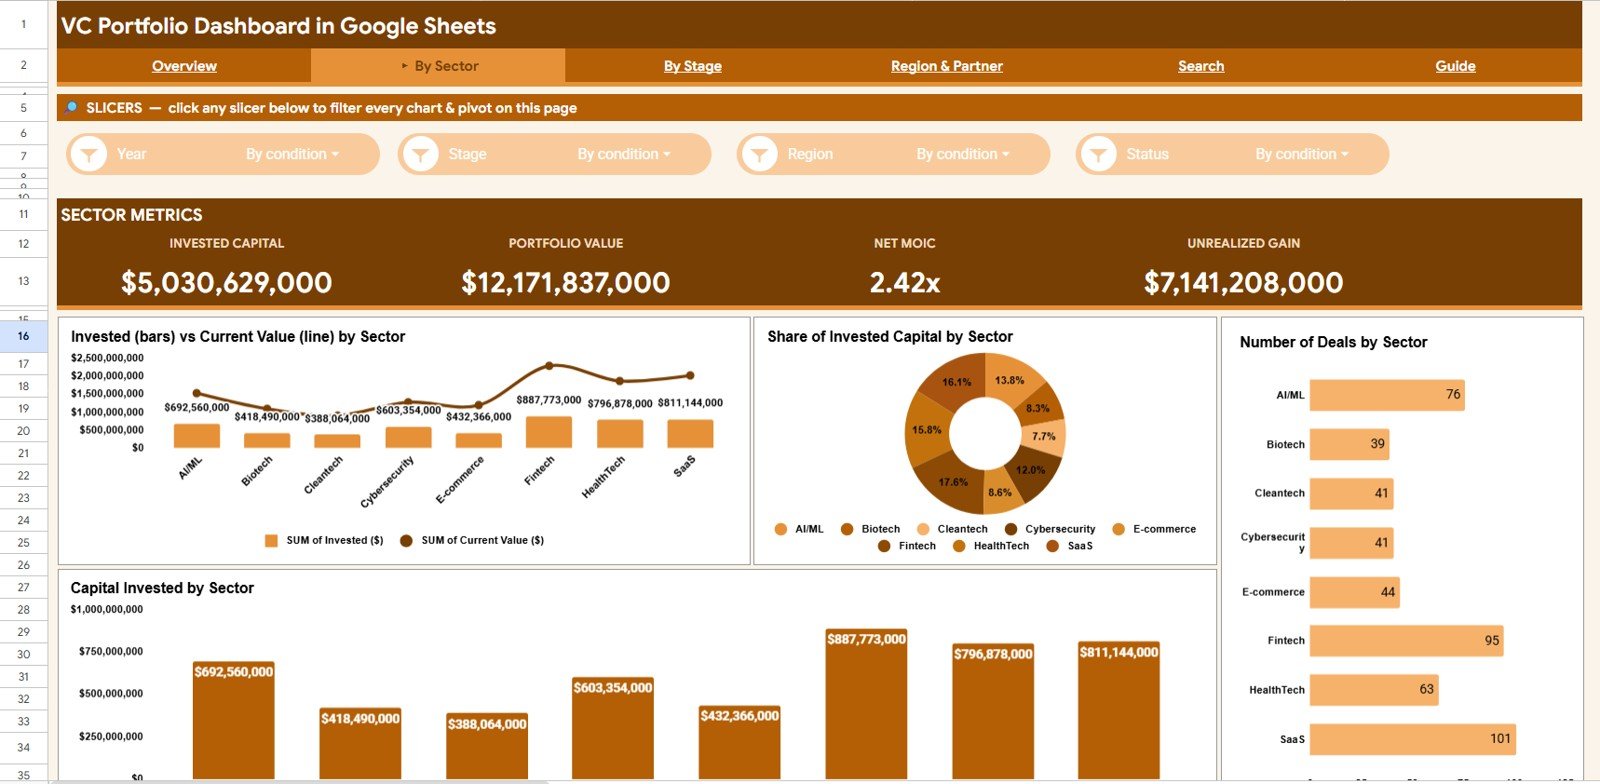
By Sector
This tab breaks the portfolio down by industry sector with Invested vs Current Value by Sector, Share of Invested Capital by Sector, Number of Deals by Sector, and Capital Invested by Sector — so you can see concentration and which sectors are creating value.
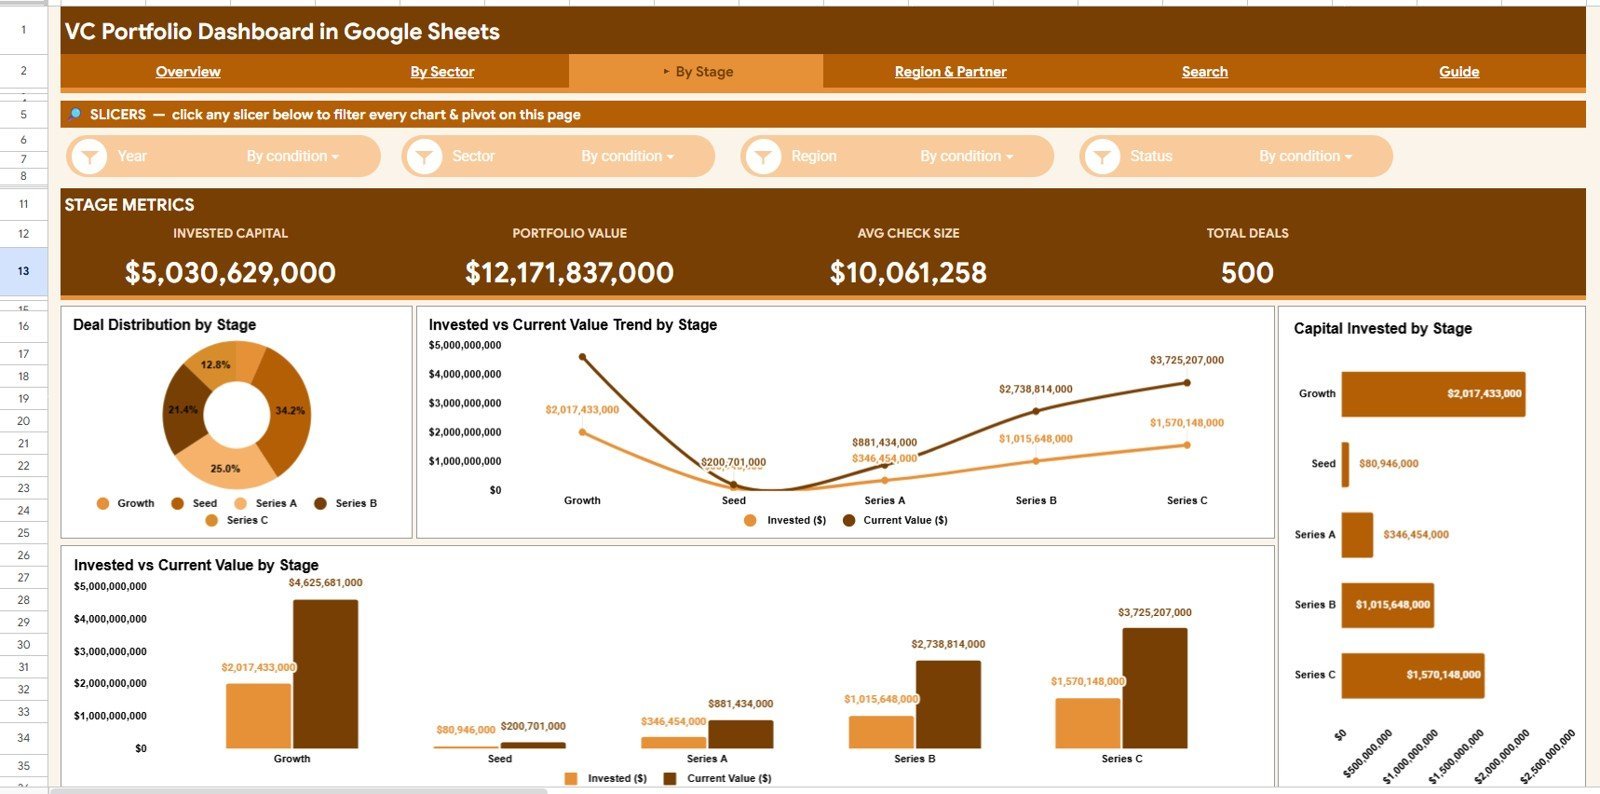
By Stage
This tab analyses the book by investment stage with Deal Distribution by Stage, Invested vs Current Value Trend by Stage, Capital Invested by Stage, and Invested vs Current Value by Stage — useful for seeing how seed, Series A, and later rounds are performing.

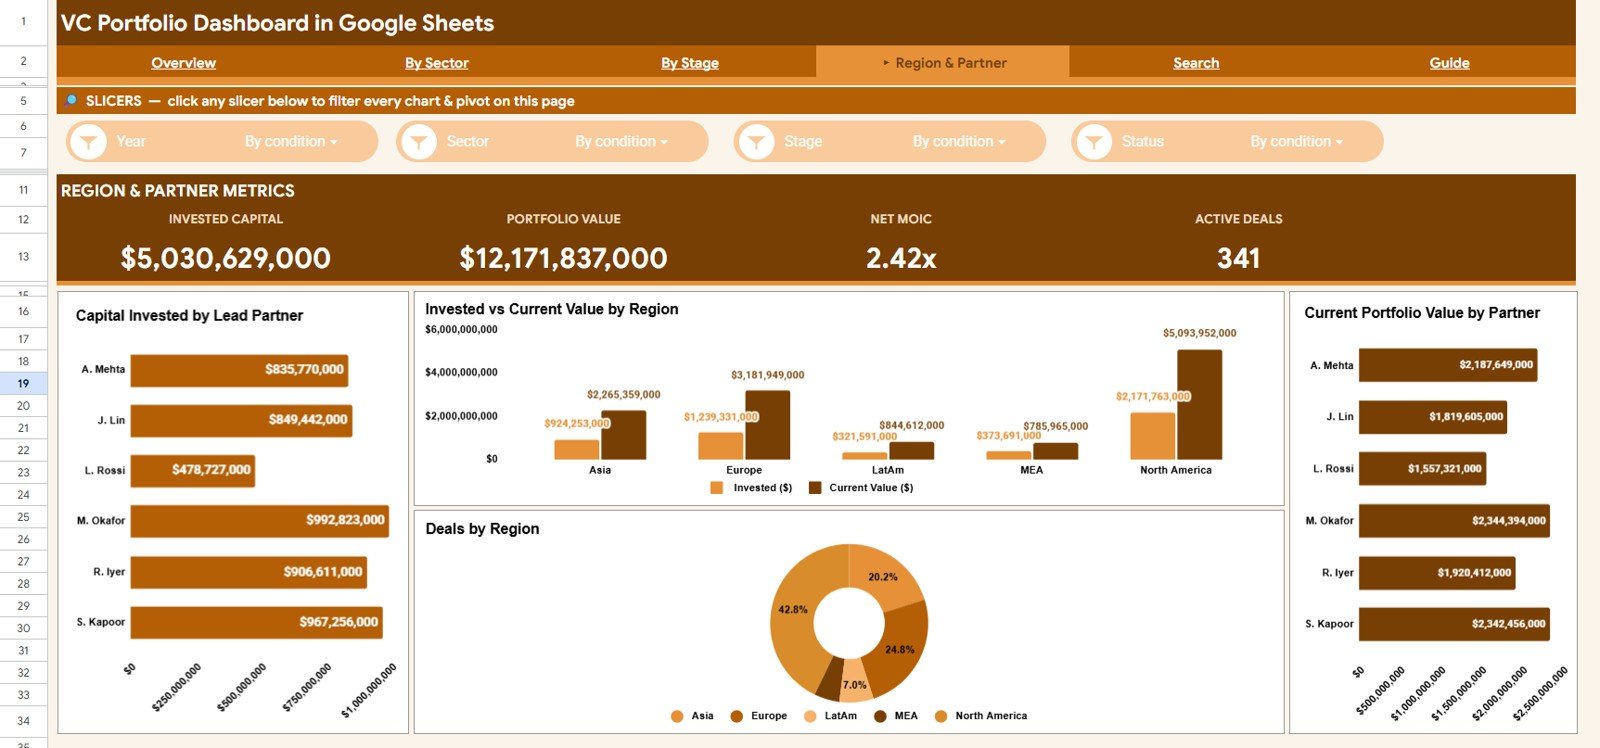
Region & Partner
This tab attributes the portfolio across geography and team with Capital Invested by Lead Partner, Invested vs Current Value by Region, Current Portfolio Value by Partner, and Deals by Region — ideal for partner-level reviews and regional exposure checks.
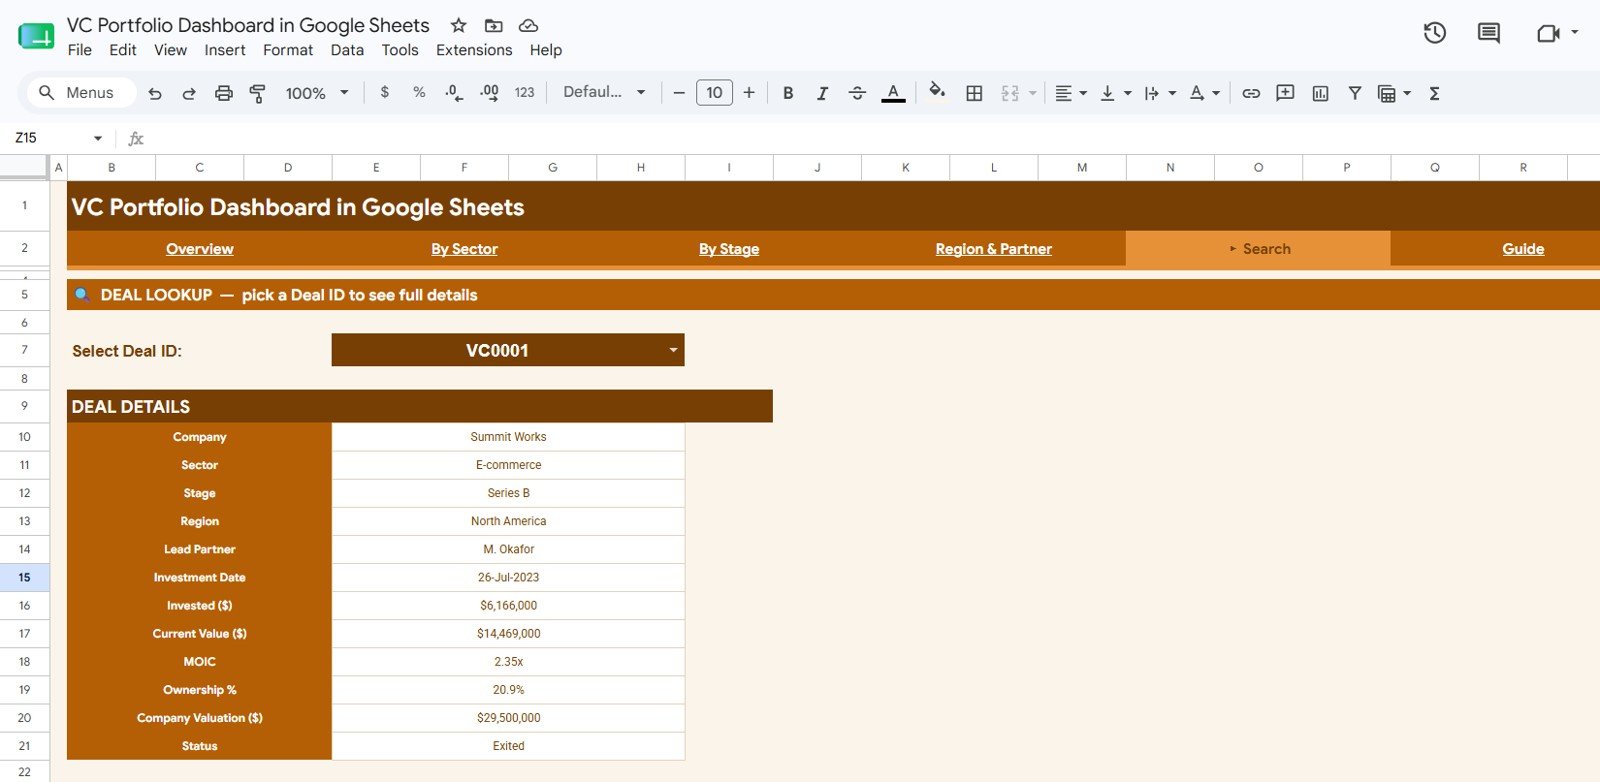
Search Sheet
Pick any Deal ID from the dropdown and instantly pull the full record for that deal — company, sector, stage, region, lead partner, investment date, invested amount, current value, MOIC, ownership percent, company valuation, and status — without scrolling the raw data.
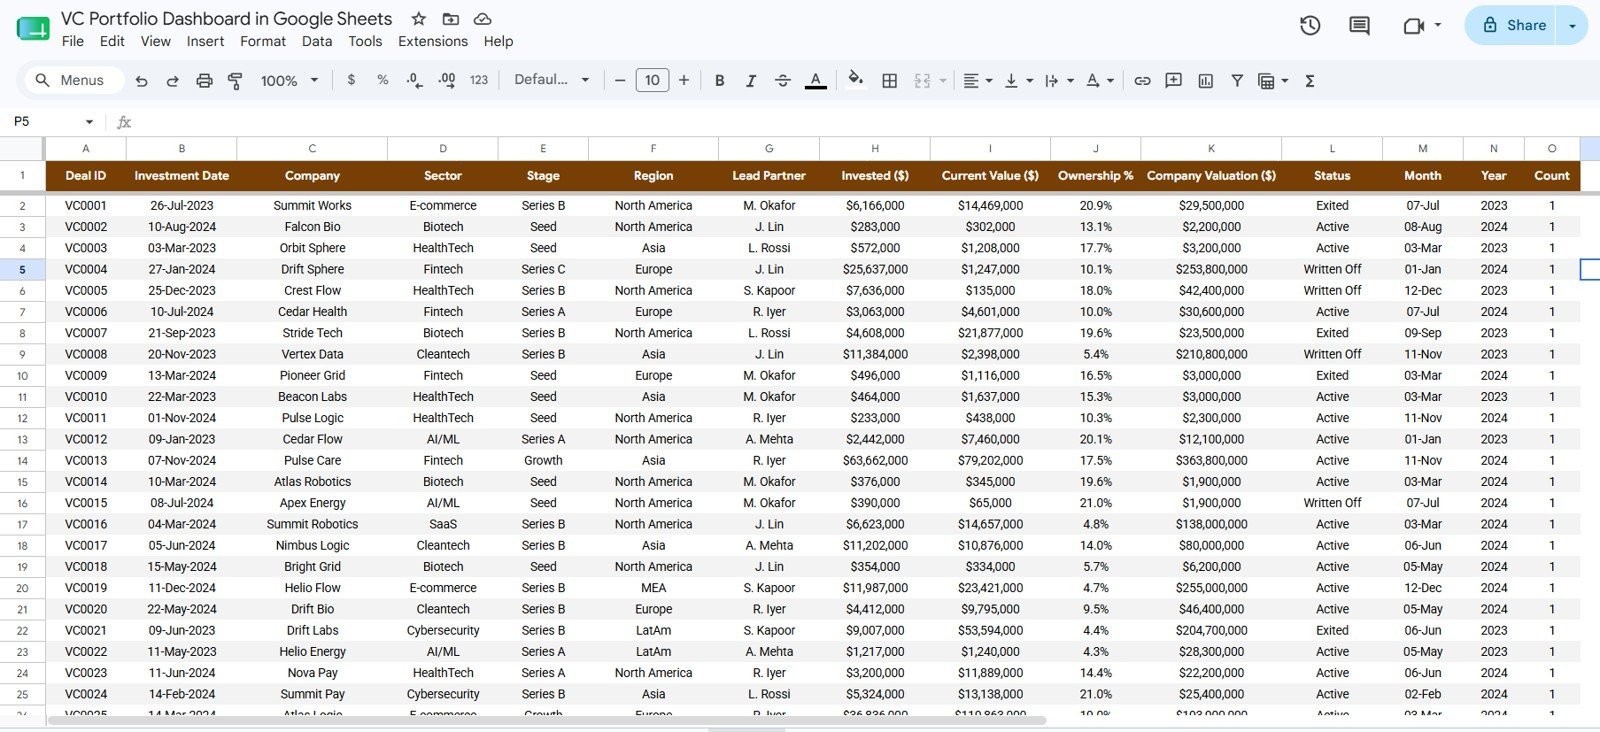
Data Sheet
This is where you maintain the portfolio. Add each investment as a row in the same column format — the four KPI cards, all 16 charts, and the Search tab read from this single source, so one update flows everywhere.

📊 VC Portfolio Dashboard in Google Sheets vs. Microsoft Excel vs. Paid Fund Software — Where This Fits
| Feature | VC Portfolio Dashboard (Google Sheets) | Microsoft Excel Dashboard | Carta / Visible.vc |
|---|---|---|---|
| Cost | $9.99 one-time | $9.99–$17.99 one-time | $300–$1,000+ / month |
| Platform | ✅ Browser-based, no install | Requires Microsoft Excel | Web SaaS |
| Setup time | ✅ Under 10 minutes | Under 10 minutes | Days (onboarding) |
| Real-time team collaboration | ✅ Yes (native) | Limited | ✅ Yes |
| Mobile access | ✅ Sheets app | Excel mobile | ✅ Yes |
| Customizable fields | ✅ Fully editable | ✅ Fully editable | Limited to vendor schema |
| Share with link | ✅ One click | Needs file upload | ✅ Yes |
| MOIC & stage analytics | ✅ Built in | ✅ Built in | ✅ Yes |
| Year-1 cost at 5 users | $9.99 total | $9.99–$17.99 total | $3,600–$12,000+ |
For emerging managers and angels who want clear MOIC, sector, and stage analytics without paying four figures a month for Carta, the VC Portfolio Dashboard in Google Sheets sits in the sweet spot.
👥 Who This Template Is For — and Who It’s Not For
✅ This template is built for:
- Emerging VC fund managers and micro-VCs tracking 10–100 portfolio companies
- Angel investors and syndicate leads who want MOIC and sector exposure at a glance
- Family offices and solo GPs who need a shareable, one-time-cost alternative to Carta
❌ This template is NOT for:
- Large funds that require cap-table management, 409A valuations, and SOC 2 compliance
- Teams that need automated bank or brokerage data feeds rather than manual deal entry
⚙️ How to Use the VC Portfolio Dashboard in Google Sheets
- Open the PDF in your download and click the Google Sheets copy link to save your own editable copy.
- Go to the Data tab and replace the sample deals with your own, keeping the same column order.
- Return to the Overview tab — the four KPI cards and all charts refresh automatically.
- Use the slicers to filter by sector, stage, region, or status, then review the By Sector, By Stage, and Region & Partner tabs.
- Open the Search tab and pick a Deal ID to pull the full 12-field record for any investment.
💼 Real-World Use Cases
Maya runs a $20M micro-VC fund. She uses the VC Portfolio Dashboard in Google Sheets to track Net MOIC and current value across 35 companies, filter the Overview by stage before LP calls, and share a read-only link with her two analysts — instead of paying for a per-seat fund platform.
Devansh leads an angel syndicate. He logs each deal on the Data tab and uses the By Sector and Region & Partner tabs to show members where capital is concentrated and which lead partners are driving returns.
A family office associate uses the Search tab to answer ad-hoc questions — typing a Deal ID to instantly surface ownership percent, company valuation, and status during quarterly reviews.
❓ Frequently Asked Questions
What KPIs does the VC Portfolio Dashboard in Google Sheets track?
The VC Portfolio Dashboard in Google Sheets tracks four headline KPIs — Invested Capital, Portfolio Value, Net MOIC, and Total Deals — plus 16 supporting charts. Every metric updates automatically when you add or edit deals on the Data tab.
How does this compare to Carta or Visible.vc?
Carta and Visible.vc are powerful SaaS platforms that can cost $300–$1,000+ per month. The VC Portfolio Dashboard in Google Sheets is a one-time $9.99 alternative for performance tracking — MOIC, sector, stage, region, and partner analytics — without cap-table or compliance modules.
How long does setup take?
Setup takes under 10 minutes. Make your own copy from the included link, paste your deals into the Data tab using the existing column order, and the KPI cards, charts, and Search tab populate instantly.
Can my whole fund team use it at once?
Yes. Because the VC Portfolio Dashboard in Google Sheets runs in Google Sheets, multiple teammates can view and edit in real time and you can share a link with view-only or edit access — with no per-user fees.
Is the Net MOIC calculated automatically?
Yes. Net MOIC is derived from invested capital versus current value across the portfolio and recalculates as you update deal values, so the figure on the Overview always reflects your latest data.
Do I need any add-ons or scripts to run it?
No. The VC Portfolio Dashboard in Google Sheets works in any modern browser with standard Google Sheets functions and slicers — no installs, macros, or third-party add-ons required.
👤 About the Author
Built by PK — Microsoft Certified Professional with 15+ years of Excel, Google Sheets, and Power BI experience. Founder of NextGenTemplates, reaching 300K+ subscribers across YouTube channels (@PK-AnExcelExpert, @NextGenTemplates, @NeoTechNavigators). Every template is hand-built and tested before release.
🔗 Explore Related Templates
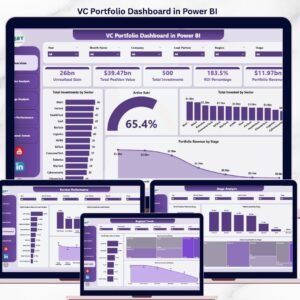
Prefer a different platform? This dashboard is also available as the VC Portfolio Dashboard in Excel and the VC Portfolio Dashboard in Power BI. Investors also use our Hedge Fund Administration Dashboard, Business Angel Networks Dashboard, and Impact Investment Funds Dashboard. Browse more in Google Sheets Dashboards.
📖 Click here to read the Detailed Blog Post
Watch the step-by-step video Demo:
🎥 Visit our YouTube channel for step-by-step video tutorials
👉 YouTube.com/@NextGenTemplates
📅 Last updated: June 2026


Reviews
There are no reviews yet.