Greenhouse Farming Dashboard in Power BI helps greenhouse owners, farm managers, agribusiness analysts, and controlled-environment agriculture teams review revenue, operating cost, crop batches, harvested batches, waste, quality, climate risk, and profit from one interactive Power BI report. Many greenhouse teams manage 100+ crop batches across sites, crop types, growing methods, irrigation systems, zones, and harvest cycles, but reporting is often scattered across spreadsheets. This template gives you 5 Power BI report pages, executive KPI cards, slicers, and ready-made visuals. Instant download. One-time payment. Editable .pbix file. No monthly farm analytics subscription.
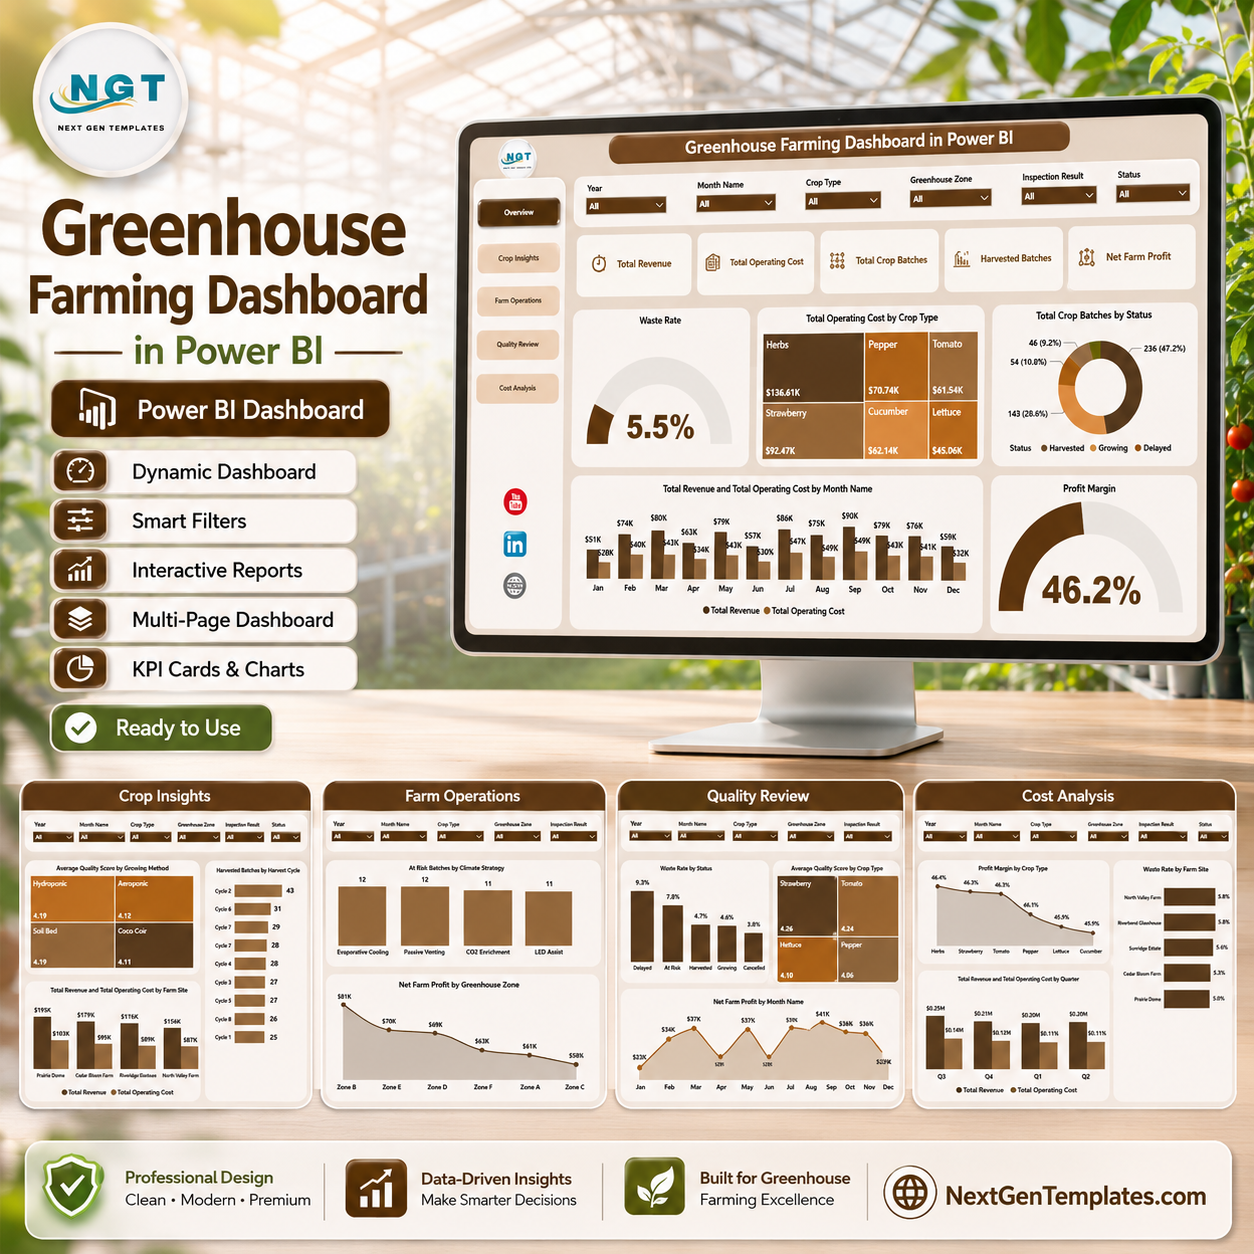
Greenhouse Farming Dashboard in Power BI
Key Features of Greenhouse Farming Dashboard in Power BI
- 5 Power BI pages covering Overview, Crop Insights, Farm Operations, Quality Review, and Cost Analysis.
- Executive KPI cards for Total Revenue, Total Operating Cost, Total Crop Batches, Harvested Batches, and Net Farm Profit.
- Interactive slicers so users can filter the report quickly by available farm, crop, site, status, month, and operations fields.
- Financial analysis for revenue, operating cost, profit margin, and net farm profit trends.
- Crop and batch tracking for batch status, harvest cycle, crop type, growing method, and farm site analysis.
- Operations review for climate strategy, irrigation system, greenhouse zone, and at-risk crop batches.
- Quality and waste review using quality score, waste rate, crop type, status, and monthly profit views.
- Editable Power BI file that users can adapt for their own greenhouse reporting process.
What’s Inside the Greenhouse Farming Dashboard in Power BI
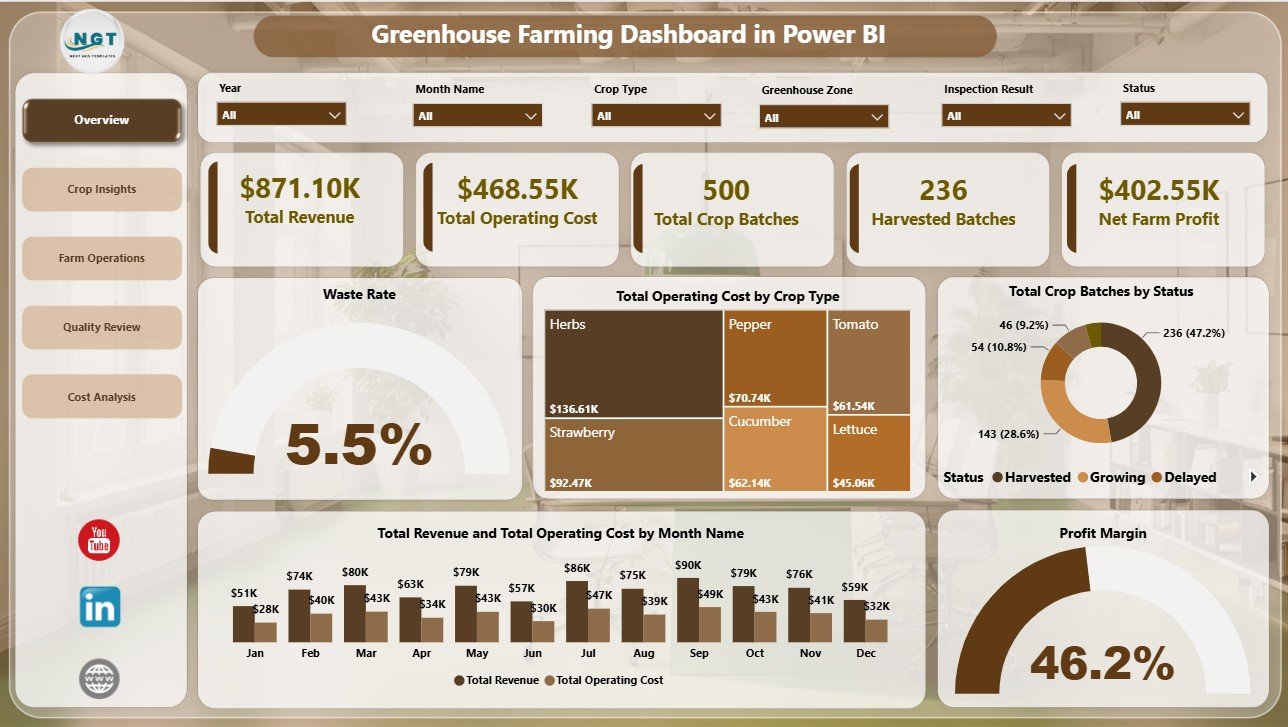
1. Overview Page
The Overview page gives management a fast read on greenhouse performance. The cards show Total Revenue, Total Operating Cost, Total Crop Batches, Harvested Batches, and Net Farm Profit so users can understand financial health, batch volume, and harvest progress before drilling into detail.
Waste Rate by Overall Farm Performance: This chart shows how waste rate changes across overall farm performance groups. It helps managers connect operational performance with crop loss and quality issues.
Total Operating Cost by Crop Type: This visual highlights which crop types carry the highest operating cost. It supports crop planning, input review, and better allocation of greenhouse resources.
Total Crop Batches by Status: This chart summarizes crop batches by current status. It helps teams see how many batches are active, harvested, delayed, completed, or at risk.
Total Revenue and Total Operating Cost by Month Name: This chart compares monthly revenue against operating cost. It helps users identify months where costs rise faster than revenue or margin improves.
Profit Margin by Overall Farm Performance: This visual shows margin differences across performance groups. It helps leaders understand whether strong operational performance is translating into better profitability.
2. Crop Insights
The Crop Insights page focuses on crop-level and site-level performance. Average Quality Score by Growing Method helps compare quality outcomes by cultivation approach. Total Revenue and Total Operating Cost by Farm Site shows site-level financial performance, while Harvested Batches by Harvest Cycle explains which harvest cycles are producing completed batches.
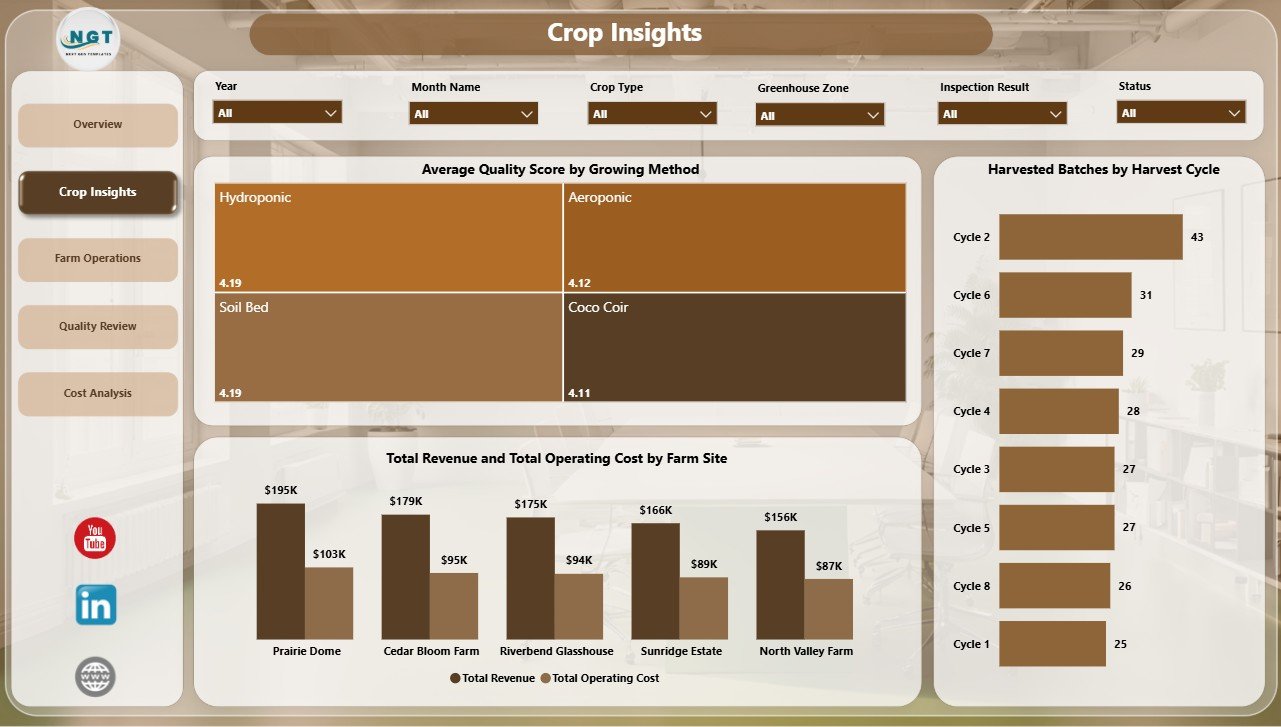
Crop Insights
3. Farm Operations
The Farm Operations page is built for the teams responsible for execution inside the greenhouse. At Risk Batches by Climate Strategy highlights where climate decisions may need closer monitoring. Average Quality Score by Irrigation System compares irrigation approaches, and Net Farm Profit by Greenhouse Zone shows which zones are contributing stronger profit.
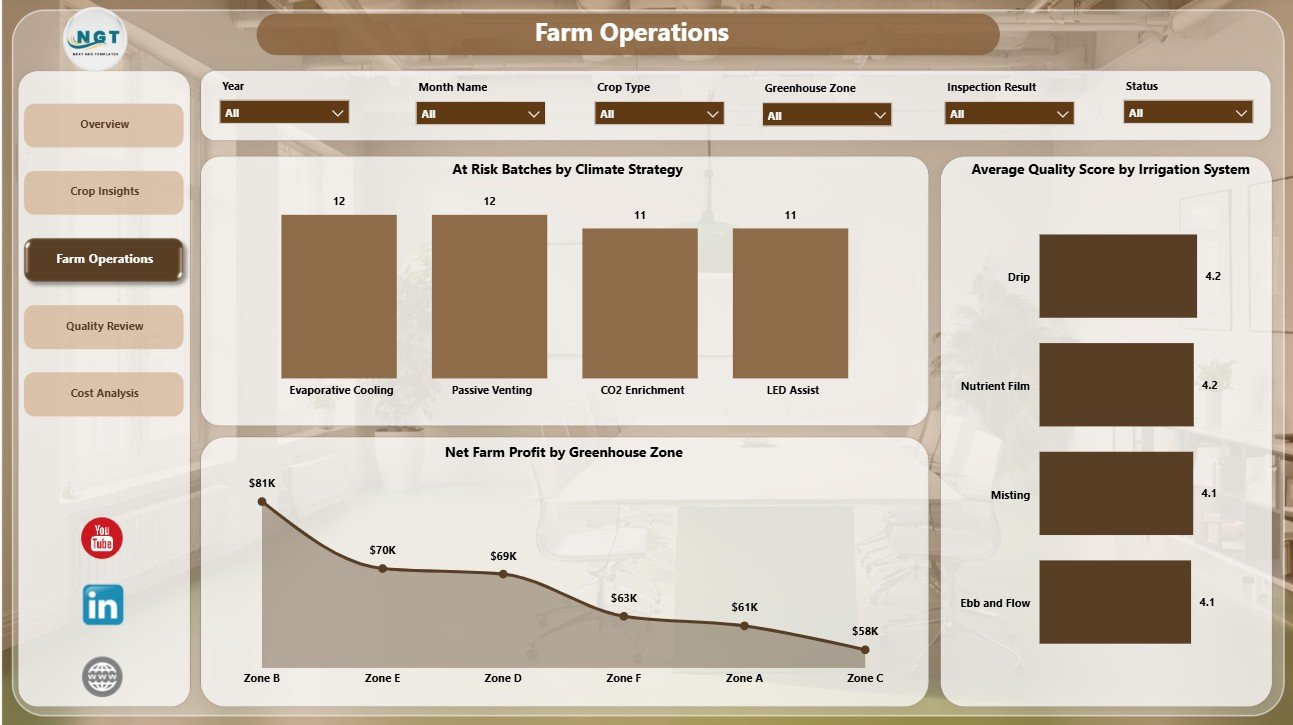
Farm Operations
4. Quality Review
The Quality Review page connects waste, quality, crop type, status, and time-based profit. Waste Rate by Status helps users identify where waste appears in the batch lifecycle. Average Quality Score by Crop Type compares quality outcomes across crops, and Net Farm Profit by Month Name tracks monthly profitability movement.
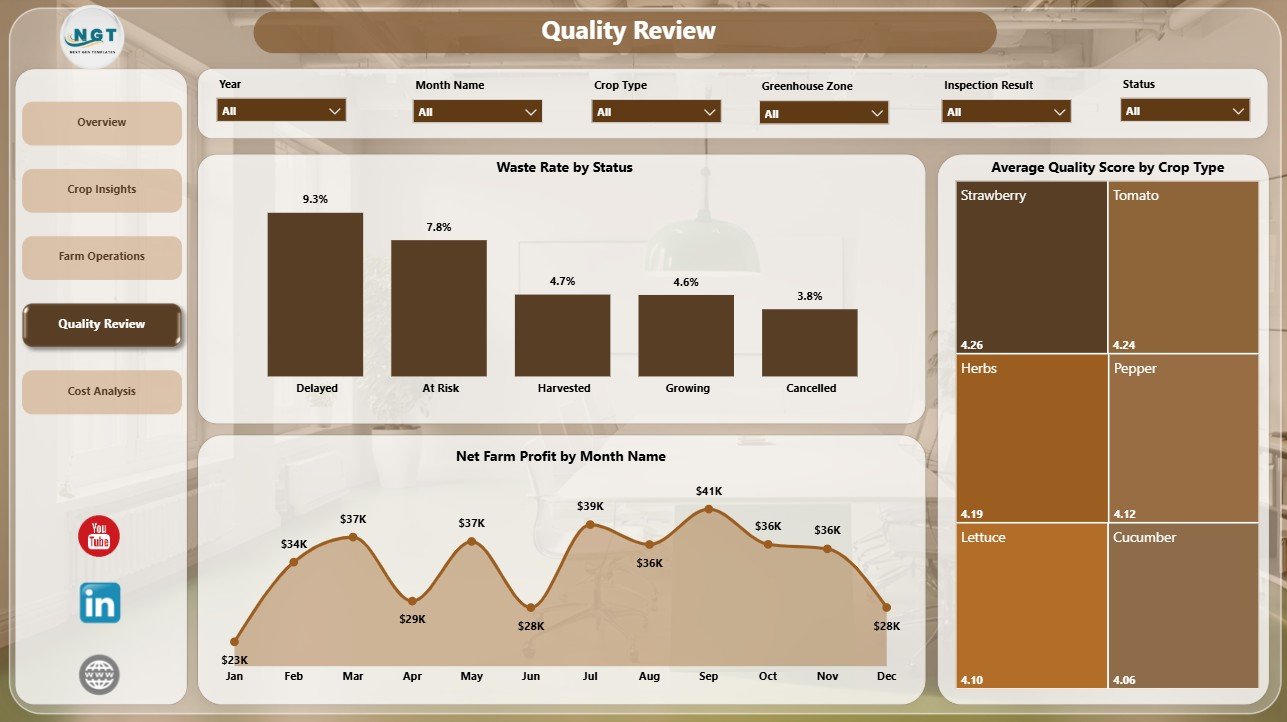
Quality Review
5. Cost Analysis
The Cost Analysis page gives a dedicated financial lens for margin, waste, and quarterly trends. Profit Margin by Crop Type shows which crops are profitable after operating costs. Waste Rate by Farm Site helps identify locations with loss issues, and Total Revenue and Total Operating Cost by Quarter supports seasonal cost and revenue review.
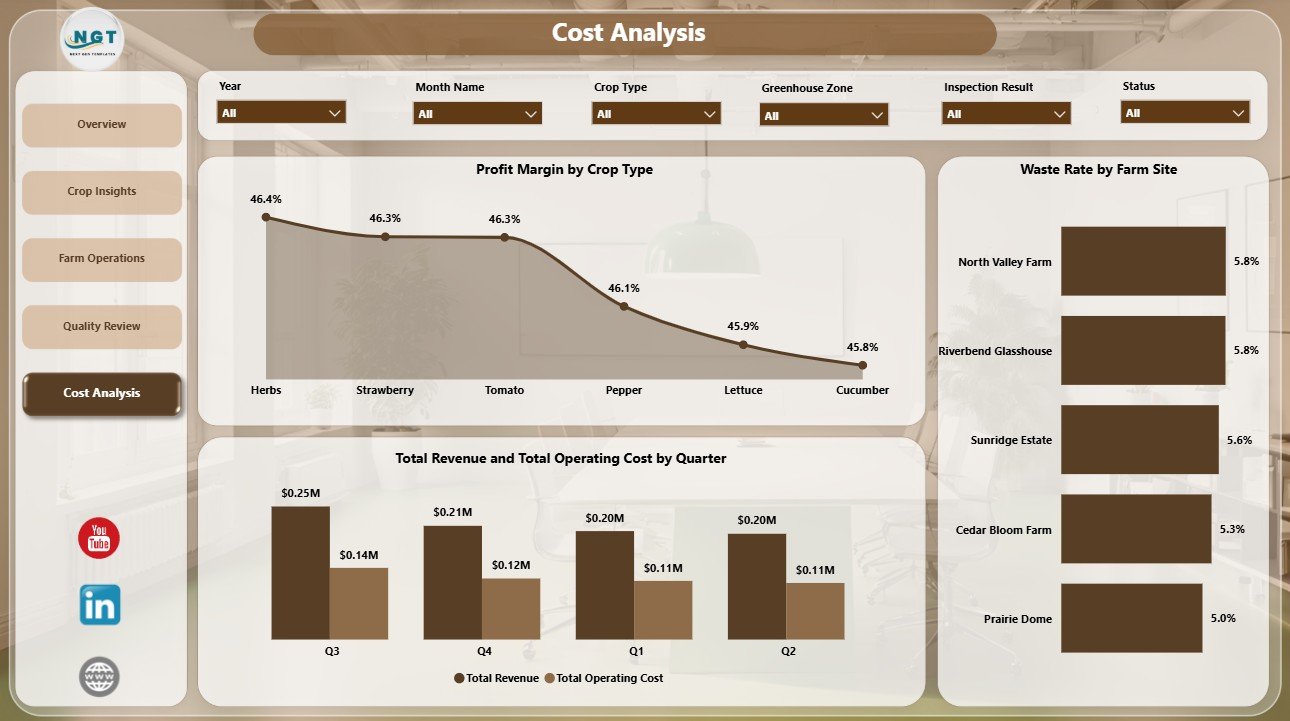
Cost Analysis
Greenhouse Farming Dashboard in Power BI vs. Tableau vs. Paid Farm SaaS – Where This Fits
| Feature | This Power BI Dashboard | Tableau Alternative | Paid Farm SaaS |
|---|---|---|---|
| Cost | $17.99 one-time template purchase | Requires Tableau license and dashboard build time | Monthly or annual subscription |
| Platform | Power BI Desktop and Power BI Service | Tableau Desktop or Cloud | Vendor cloud platform |
| Setup time | Open .pbix and replace sample data/source | Build data model and visuals manually | Onboarding and configuration required |
| Real-time team collaboration | Available through Power BI Service licensing | Available with Tableau Cloud/Server | Usually included by seat |
| Mobile access | Available with Power BI mobile after publishing | Available with Tableau mobile | Usually included |
| Customizable fields | Editable model, measures, visuals, filters, and pages | Editable if you build the workbook | Limited by vendor configuration |
| Share with link | Possible through Power BI sharing options | Possible through Tableau publishing | Usually login controlled |
| Year-1 cost at 5 users | $17.99 plus Microsoft licensing you already use | Software licensing plus build time | Often hundreds or thousands |
| Greenhouse-specific pages | Included across five report pages | Requires custom design | Depends on the product and plan |
Who This Template Is For – and Who It’s Not For
Best for: greenhouse owners, farm managers, controlled-environment agriculture teams, crop quality reviewers, operations analysts, agribusiness consultants, and Power BI users who need a ready reporting dashboard for greenhouse performance.
Not for: teams that need live climate control, IoT sensor automation, ERP integration, payroll, procurement approvals, pesticide compliance workflows, or a custom farm management database.
How to Use the Greenhouse Farming Dashboard in Power BI
- Download and unzip the product file.
- Open the .pbix file in Power BI Desktop.
- Review the sample greenhouse data and report pages.
- Replace the sample data source with your own greenhouse data source.
- Refresh the report so cards, charts, slicers, and pages update.
- Use slicers to filter by crop, site, status, month, method, climate strategy, irrigation system, or available fields.
- Review Overview, Crop Insights, Farm Operations, Quality Review, and Cost Analysis pages.
- Publish to Power BI Service if your team needs browser access or scheduled refresh.
Real-World Use Cases
Priya, greenhouse owner: Priya reviews Total Revenue, Total Operating Cost, Harvested Batches, and Net Farm Profit before weekly crop planning meetings.
Marco, farm operations manager: Marco studies at-risk batches by climate strategy and quality score by irrigation system to prioritize operational follow-up.
Elena, agribusiness consultant: Elena compares profit margin, waste rate, crop type, farm site, and quarterly cost trends when preparing client performance reports.
Frequently Asked Questions
What does this Power BI dashboard track?
It tracks revenue, operating cost, crop batches, harvested batches, net farm profit, waste rate, profit margin, quality score, crop type, status, month, quarter, farm site, growing method, harvest cycle, climate strategy, irrigation system, and greenhouse zone.
Do I need Power BI Desktop?
Yes. Open the .pbix file in Microsoft Power BI Desktop, which is available from Microsoft. You can publish to Power BI Service if your team needs online sharing.
Can I connect my own data?
Yes. Replace the sample data source with your greenhouse data source, then refresh the report so all visuals update.
Can I customize the visuals?
Yes. The Power BI report can be edited, including charts, slicers, cards, page labels, colors, fields, and measures.
Is this a farm management system?
No. It is a Power BI reporting template for analysis and review. It does not replace climate automation, ERP, inventory, or compliance systems.
Is this a subscription?
No. It is a one-time downloadable Power BI template purchase.
About the Author
Built by PK – Microsoft Certified Professional with 15+ years of Excel, Google Sheets, and Power BI experience. Founder of NextGenTemplates, reaching 300K+ subscribers across YouTube channels. Every template is hand-built and tested before release.
Explore Related Templates
Pair this template with Agriculture and Farm Dashboard in Power BI, Greenhouse Farming Dashboard in Excel, and Greenhouse Farming KPI Dashboard in Excel. Browse more Power BI Dashboard templates and Power BI templates.
Download the Greenhouse Farming Dashboard in Power BI today and start reviewing greenhouse revenue, cost, batch status, harvested batches, quality, waste, and profit in one editable Power BI report.
Last updated: June 18, 2026


Reviews
There are no reviews yet.