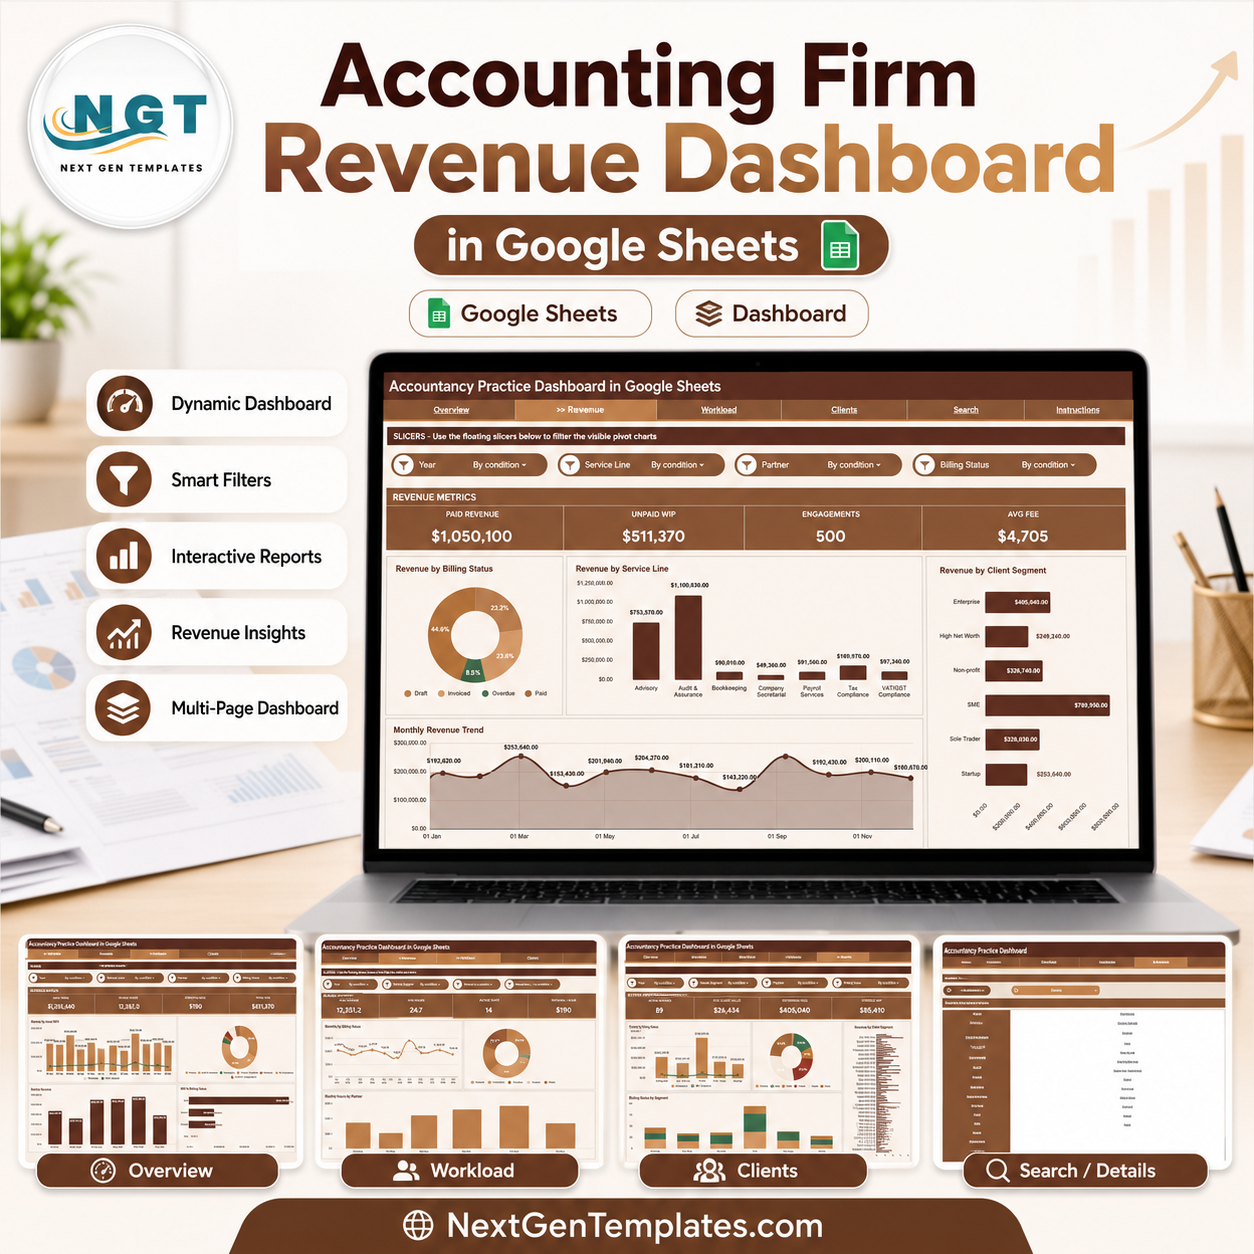
The Accounting Firm Revenue Dashboard in Google Sheets tracks 4 headline KPI cards, 8+ chart views across 5 analysis pages, multiple slicers for instant filtering, an Engagement ID lookup page, and a structured data sheet — purpose-built for accounting partners, practice managers, and finance operations teams who need real-time visibility into revenue billed, hours worked, WIP exposure, and billing status without rebuilding formulas each month. Join 8,400+ teams in 40+ countries using NextGenTemplates to replace monthly reporting software with one-time spreadsheet templates. You pay once, keep lifetime access, and avoid per-user subscription fees.
Key Features of Accounting Firm Revenue Dashboard in Google Sheets
- Google Sheets dashboard format that opens in the browser and can be shared with partners and finance staff through Google Drive without additional software licenses.
- 4 executive KPI cards — Total Fees, Billable Hours, Effective Rate, and Total WIP — displayed at the top of the Overview page for immediate performance awareness.
- Multiple slicers on the Overview page to filter the entire dashboard instantly by Partner, Service Line, Billing Status, Client Segment, Region, Month, and Year.
- 5 analysis pages covering Overview, Revenue, Workload, Clients, and Search — so partners, operations managers, and practice leads each have a dedicated analytical view.
- Revenue page breaking down billing performance by Billing Status, Service Line, Client Segment, and Month for trend and mix analysis.
- Workload page with Billable Hours by Month, Service Line, Staff Member, and Partner — identifying capacity pressure and underutilized resources.
- Clients page combining Revenue and WIP by Client Segment, Revenue by Region, Revenue by Client, and Billing Status by Client Segment for portfolio-level insights.
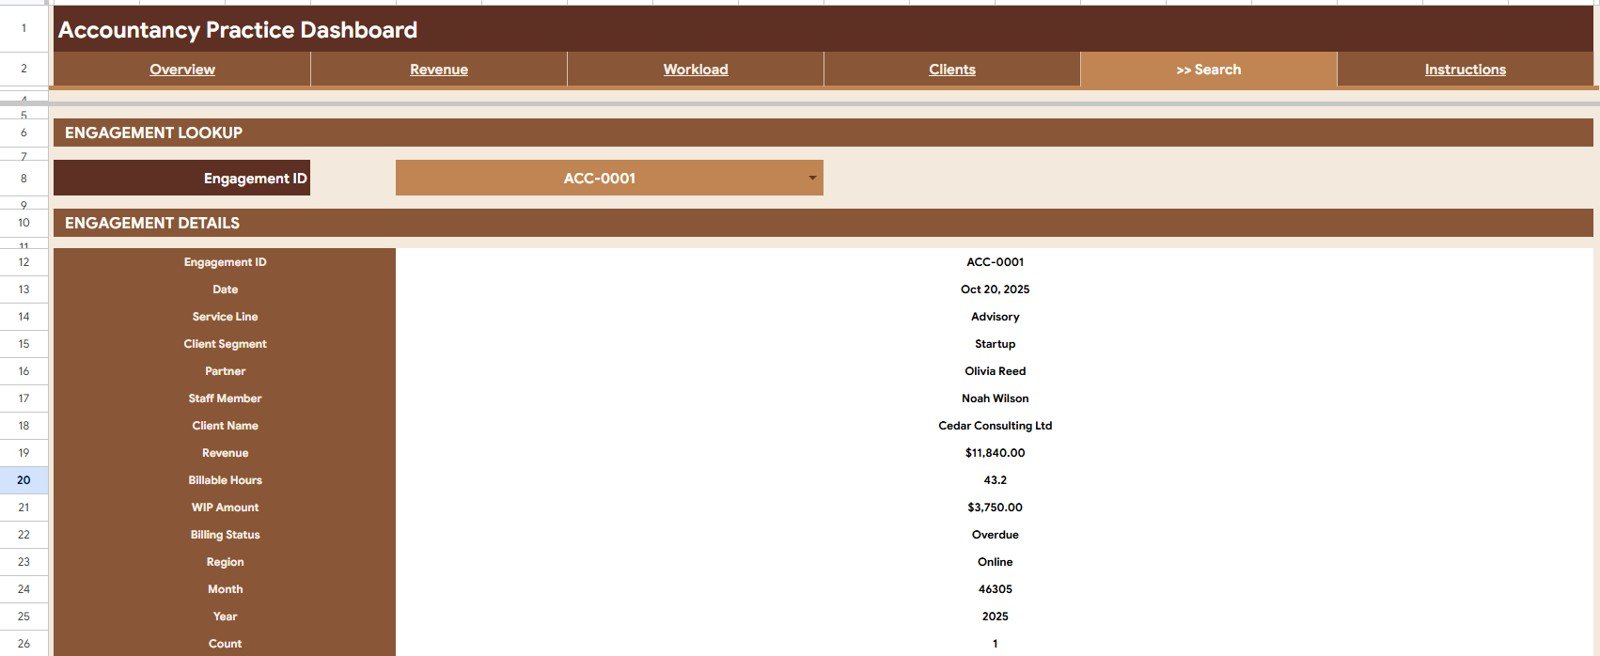
- Search tab that lets users pick any Engagement ID from a dropdown and instantly display the full engagement record: Date, Service Line, Client Segment, Partner, Staff Member, Client Name, Revenue, Billable Hours, WIP Amount, Billing Status, Region, Month, and Year.
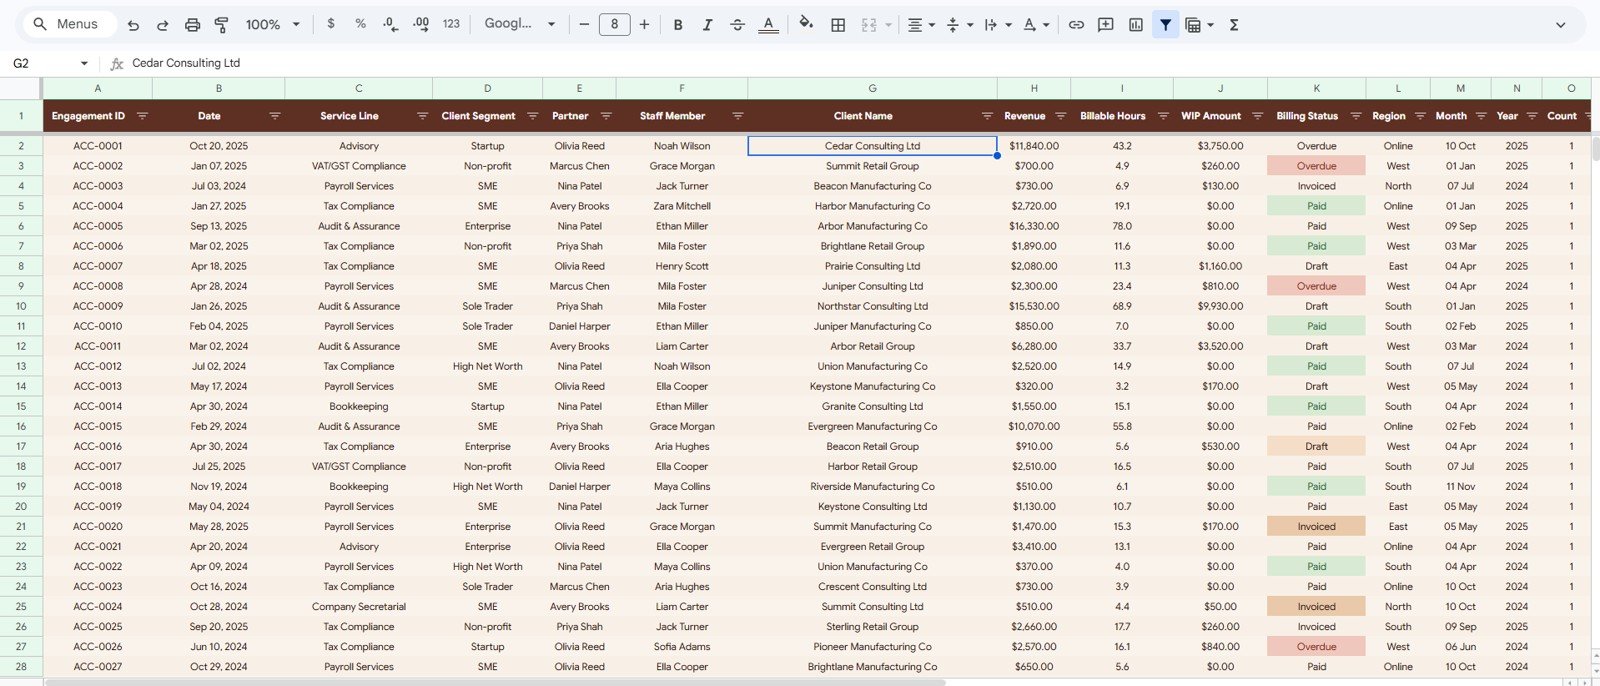
- Structured Data Sheet with clearly labeled columns where teams add new engagement records to keep the dashboard auto-updating.
Dashboard Pages Explanation
Page 1: Overview
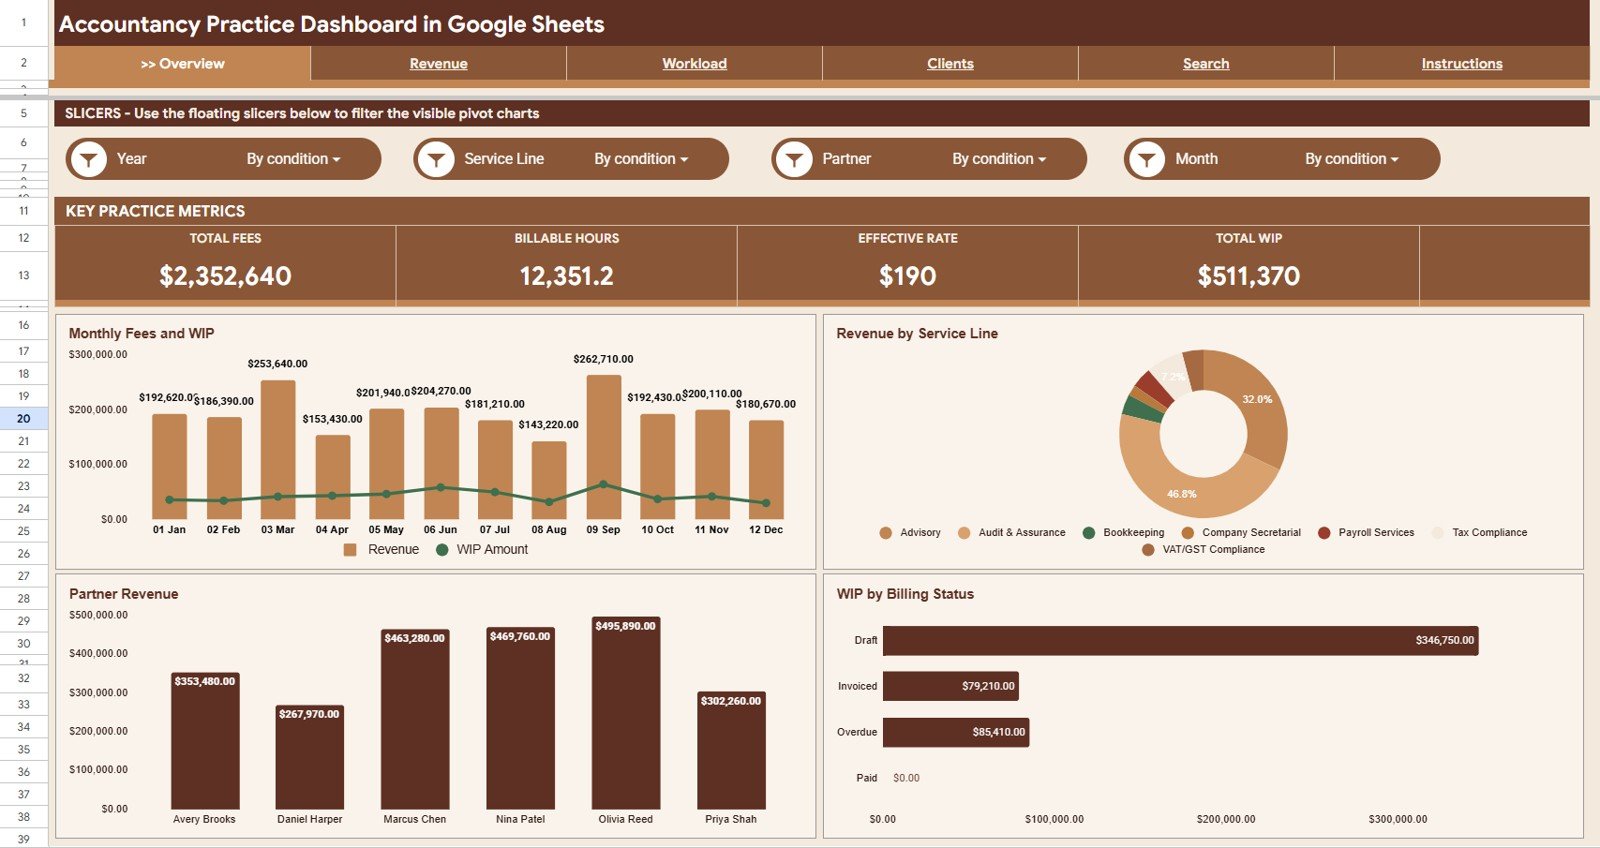
The Overview page provides a high-level performance snapshot with 4 KPI cards — Total Fees, Billable Hours, Effective Rate, and Total WIP — at the top. Multiple slicers let users apply filters by Partner, Service Line, Billing Status, Client Segment, Region, Month, and Year to instantly see the impact on every chart. Charts include Revenue and WIP Amount by Month (billing trends against work-in-progress), Revenue by Service Line (practice area contribution), Revenue by Partner (individual partner billing performance), and WIP by Billing Status (unbilled and at-risk work exposure).
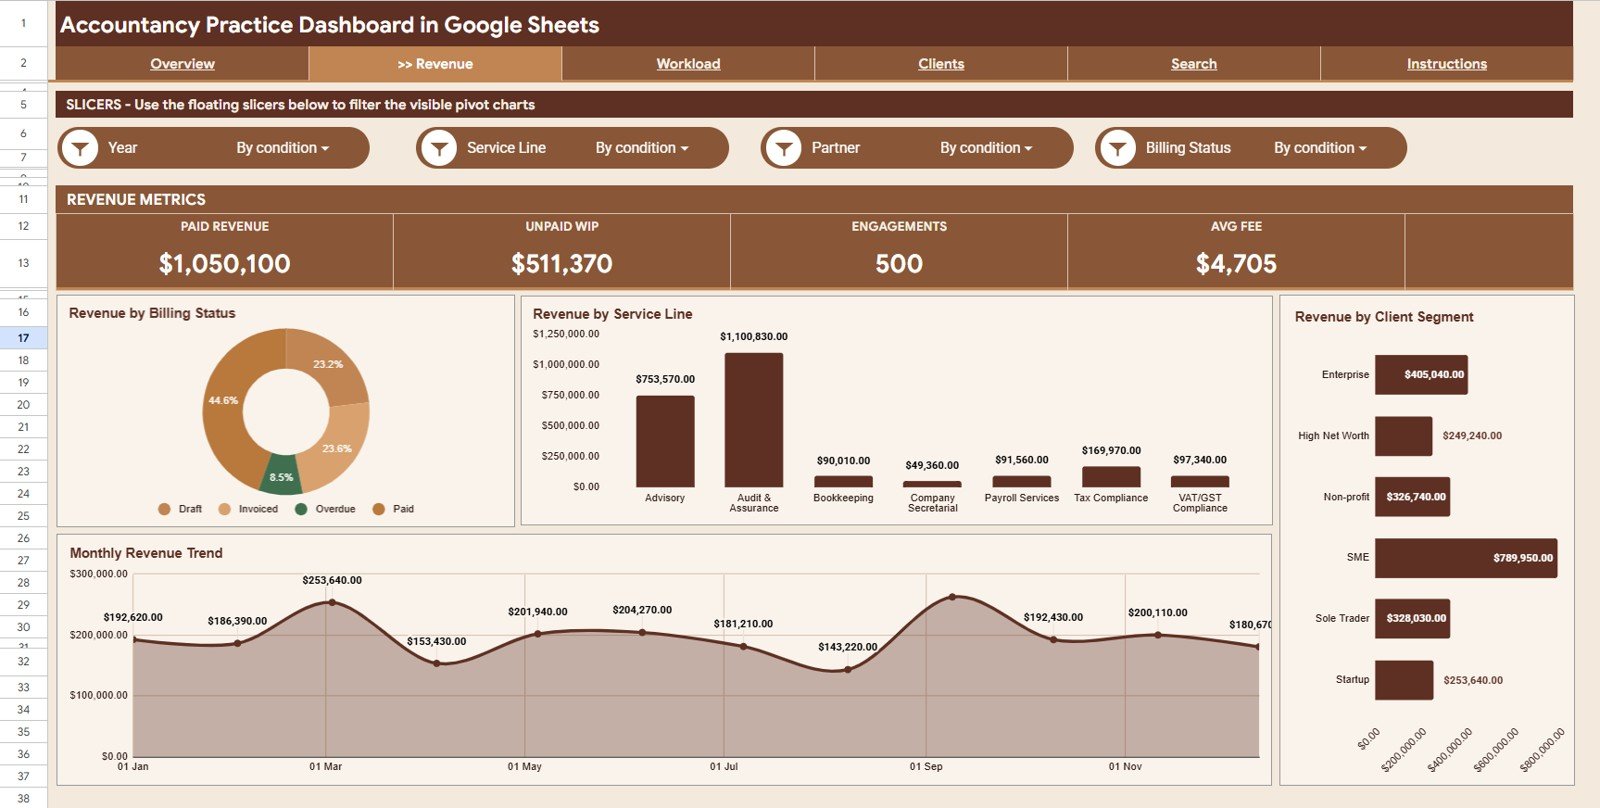
Page 2: Revenue
The Revenue page delivers deeper billing analysis across four dimensions: Revenue by Billing Status (billed, unbilled, partially billed split), Revenue by Service Line (audit, tax, advisory, and other service mix), Revenue by Client Segment (enterprise, mid-market, SME contributions), and Revenue by Month (monthly fee trend). Practice managers use this page to identify which segments and months drive the most revenue and where collection risk is highest.
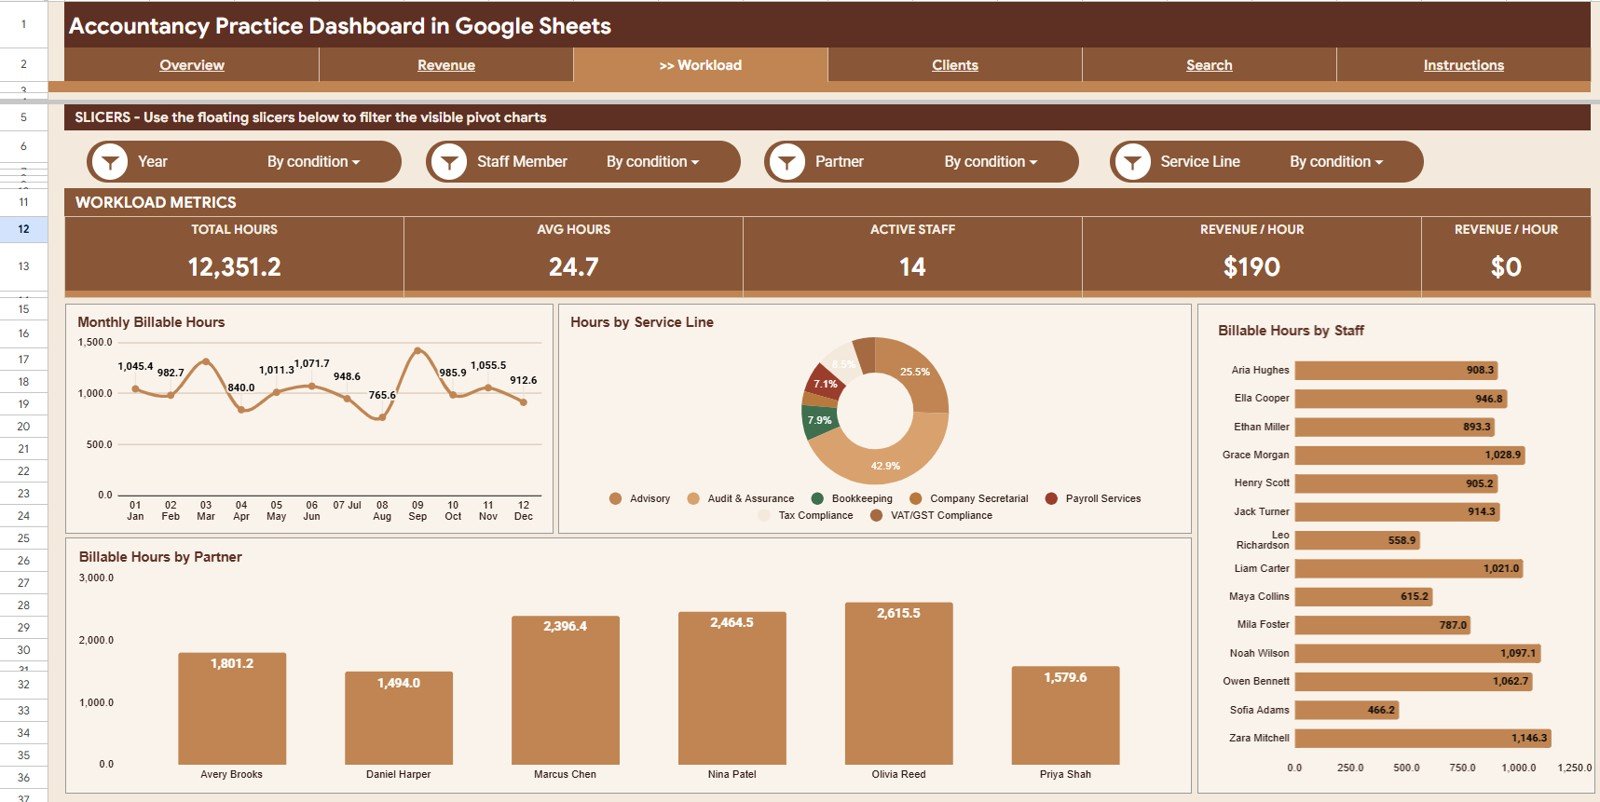
Page 3: Workload
The Workload page tracks billable capacity and staff utilization across four views: Billable Hours by Month (capacity trend over time), Hours by Service Line (workload distribution), Billable Hours by Staff (individual contributor output), and Billable Hours by Partner (partner-level delivery volume). Teams use this page to spot overloaded staff and plan capacity allocation ahead of busy seasons.
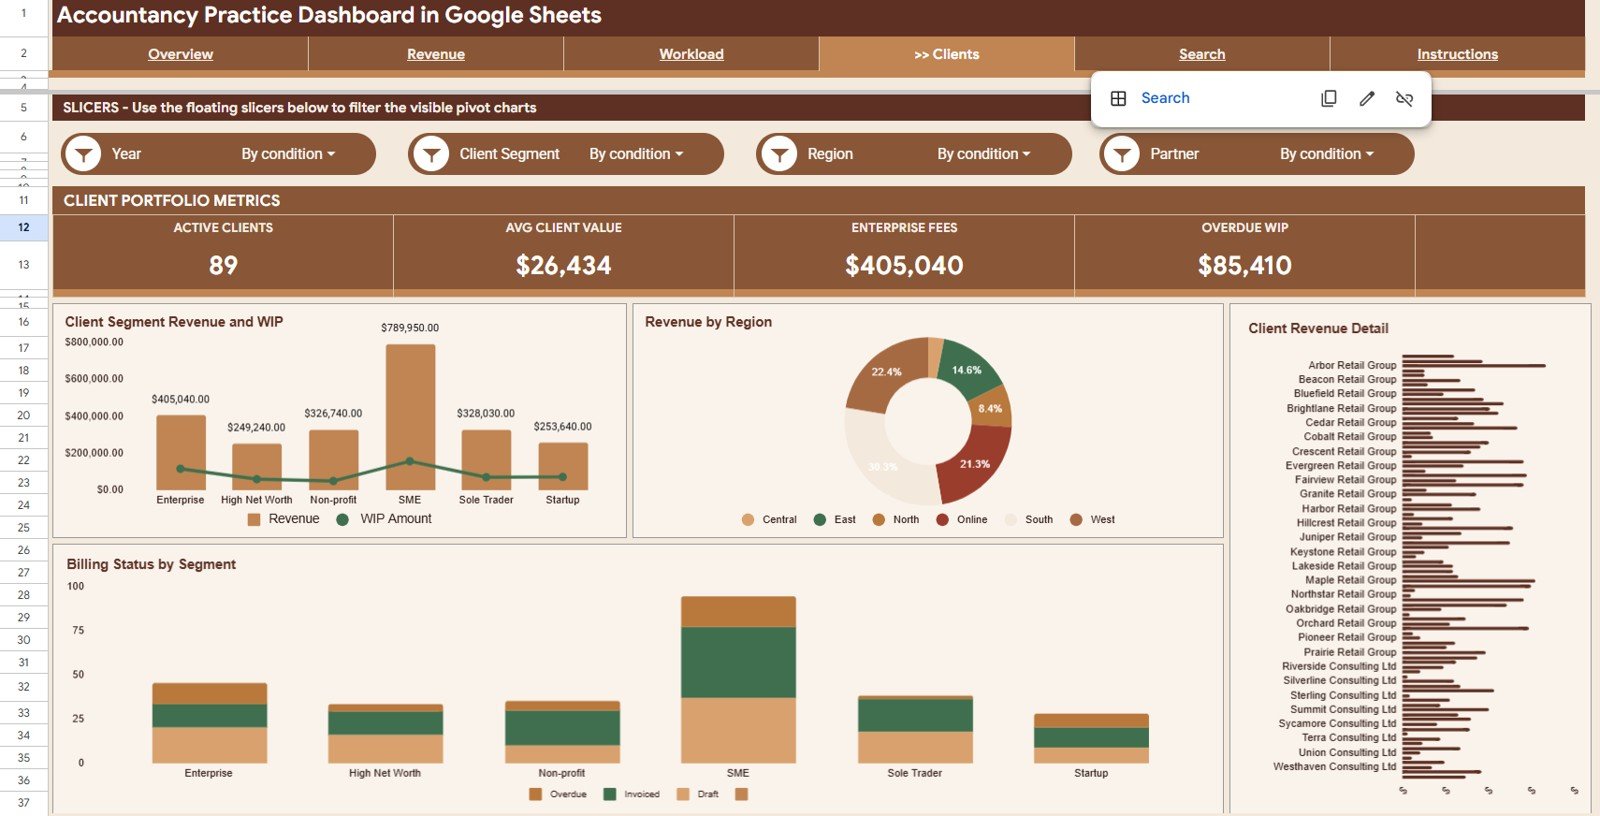
Page 4: Clients
The Clients page examines the revenue and WIP portfolio by client dimension: Revenue and WIP Amount by Client Segment (enterprise vs. mid-market vs. SME exposure), Revenue by Region (geographic fee contribution), Revenue by Client (top client concentration analysis), and Billing Status by Client Segment (which segments carry the highest unbilled or overdue risk).
Page 5: Search
The Search tab provides instant engagement-level lookups. Select any Engagement ID from the dropdown and the sheet displays the complete record: Date, Service Line, Client Segment, Partner, Staff Member, Client Name, Revenue, Billable Hours, WIP Amount, Billing Status, Region, Month, and Year — eliminating the need to scroll through the data sheet for partner queries.
Data Sheet Tab
The Data Sheet is the input layer for the entire dashboard. Add engagement records in the same column structure and all five analysis pages update automatically. The template ships with sample data so you can explore every chart before entering your firm’s actual records.
Accounting Firm Revenue and WIP Dashboard vs. Excel Dashboard vs. Paid Practice Management Software — Feature Comparison
| Feature | Accounting Firm Revenue & WIP Dashboard (Google Sheets) | Microsoft Excel Dashboard | Paid Practice Management (Karbon / Clio / CCH) |
|---|---|---|---|
| Cost | $9.99 one-time ✅ | $14.99–$29.99 one-time | $49–$200+/user/month |
| Platform | Google Sheets (browser, mobile, any OS) ✅ | Microsoft Excel (license required) | Cloud SaaS — subscription lock-in |
| Setup Time | Under 10 minutes ✅ | 15–30 minutes | Weeks to months + IT support |
| Real-Time Collaboration | Yes — built into Google Sheets ✅ | Limited (OneDrive co-authoring) | Yes |
| Multiple Dashboard Pages | 5 pages: Overview, Revenue, Workload, Clients, Search ✅ | Manual setup | Yes (rigid layouts) |
| Slicer Filtering | Yes — multiple slicers on Overview ✅ | Manual slicer setup | Limited |
| Engagement ID Lookup | Yes — Search tab ✅ | Not included | Yes |
| Year-1 Cost at 5 Users | $9.99 total ✅ | $14.99 + Excel licenses | $2,940–$12,000+ |
For accounting firms and professional services practices needing multi-page revenue, WIP, and workload analytics without paying $49+/user/month, the Accounting Firm Revenue and WIP Dashboard in Google Sheets sits in the sweet spot.
Who Should Use This Template
✅ Perfect for:
- Accounting firms, CPA practices, and professional services firms tracking revenue, billable hours, WIP, and billing status across engagements
- Practice managers and partners who need monthly visibility into fee performance, staff utilization, and client portfolio risk
- Finance operations teams replacing manual billing reports with a structured, auto-updating Google Sheets dashboard
- Small and mid-size accounting firms (5–200 staff) who want professional analytics without Karbon, Clio, or CCH subscription costs
- Finance consultants managing multiple client accounts across regions and service lines
❌ Not a fit if:
- You need direct integration with time-tracking systems like Xero Practice Manager, MYOB, or QuickBooks Time via API
- Your firm processes 10,000+ monthly engagement records and needs automated data feeds from practice management softwareAccounting Firm Revenue Dashboard in Google Sheets
- You require SOC 2 audit trails, role-based access control at the field level, or multi-entity consolidationAccounting Firm Revenue Dashboard in Google Sheets
Real-World Use Cases
Rajiv manages a 40-person CPA firm in Mumbai. Each month, his team exports engagement data from their billing system and pastes it into the Data Sheet. The Overview page’s slicers let him filter by Partner in seconds, and the WIP by Billing Status chart immediately flags engagements unbilled for more than 60 days. Before this dashboard, that analysis took a half-day in Excel. Now it takes under 5 minutes.
Sarah is the practice manager at a boutique advisory firm in London. She uses the Workload page every Friday to check Billable Hours by Staff against weekly targets. The Revenue by Client chart on the Clients page revealed that two clients represented 61% of total fees — a concentration risk she hadn’t quantified before.Accounting Firm Revenue Dashboard in Google Sheets
Carlos runs a regional tax and audit practice in Texas. His three partners each have view-only access to the Google Sheets file, check their individual revenue numbers on the Revenue by Partner chart, and use the Search tab to pull engagement details before client calls — replacing a weekly manually-compiled PDF that was always 3 days out of date.Accounting Firm Revenue Dashboard in Google Sheets
Advantages of Accounting Firm Revenue and WIP Dashboard in Google Sheets
- 💰 One-time cost replaces recurring SaaS: $9.99 once versus $49–$200 per user per month for Karbon, Clio, or CCH. Most firms break even in the first month.
- 📱 Mobile and browser-friendly: Partners review revenue and WIP from any device using the Google Sheets mobile app — no VPN or desktop installation required.
- 🔄 5 dedicated analysis pages: Overview, Revenue, Workload, Clients, and Search — each designed for a distinct use case.
- 👥 Real-time collaboration: Share with all partners and the finance team simultaneously. Data Sheet changes propagate to every chart instantly.
- 🎛️ Slicer-powered filtering: Slice the entire dashboard by Partner, Service Line, Billing Status, Client Segment, Region, Month, and Year in one click.
Opportunities for Improvement
- Direct time-tracking integration: Pair with Google Apps Script to pull data from Toggl, Harvest, or Clockify via API and eliminate manual data entry.
- Automated WIP aging alerts: Add Apps Script rules to email partners when an engagement’s WIP has been unbilled for more than 30, 60, or 90 days.
- Multi-year comparison: Extend the Data Sheet with a Year column filter to enable year-over-year revenue and hours comparisons.
- Currency support: Add a currency-conversion layer via GOOGLEFINANCE for firms billing in multiple currencies.
Best Practices
✔ Enter engagement data within 24 hours of completion to keep WIP balances accurate and avoid month-end reconciliation backlogs.
✔ Use the Engagement ID consistently across your billing system and the Data Sheet so the Search tab lookup always returns complete records.Accounting Firm Revenue Dashboard in Google Sheets
✔ Review the Workload page weekly to catch staff overloading before it impacts quality and client satisfaction.
✔ Set the Billing Status column values consistently (Billed, Unbilled, Partially Billed, Written Off) so the WIP by Billing Status chart remains accurate.Accounting Firm Revenue Dashboard in Google Sheets
✔ Share the file as view-only with partners and edit-access with the finance administrator to maintain data integrity.Accounting Firm Revenue Dashboard in Google Sheets
✔ Reference the official Google Sheets functions guide if you want to extend the template with custom formulas or additional KPI cards.Accounting Firm Revenue Dashboard in Google Sheets
Explore Relevant Templates
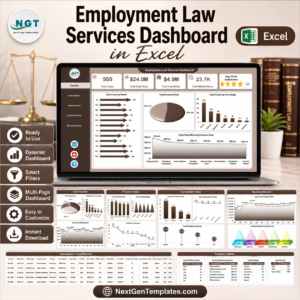
🔹 Employment Law Services Dashboard in Excel — Track case revenue, billable hours, and workload across legal practice areas.
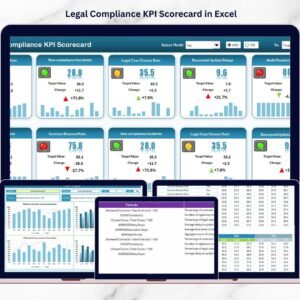
🔹 Legal Compliance KPI Scorecard in Excel — Monitor compliance KPIs with MTD/YTD comparisons for professional services firms.
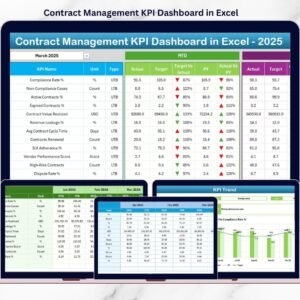
🔹 Contract Management KPI Dashboard in Excel — Track contract value, renewal rates, and milestone adherence.
🔹 Church Transaction Analysis Dashboard in Google Sheets — Revenue and expense analysis with slicers and a search tab.
🔹 Browse all Google Sheets Dashboards on NextGenTemplates.Accounting Firm Revenue Dashboard in Google Sheets
Frequently Asked Questions
What pages are included in the Accounting Firm Revenue and WIP Dashboard?
The Accounting Firm Revenue and WIP Dashboard in Google Sheets includes 6 sheet tabs: Overview (4 KPI cards, 4 charts, multiple slicers), Revenue, Workload, Clients, Search, and Data Sheet. All tabs update automatically when new engagement records are added.Accounting Firm Revenue Dashboard in Google Sheets
What KPIs are on the Overview page?
The Overview page displays 4 headline KPI cards: Total Fees (total revenue billed), Billable Hours (total hours logged), Effective Rate (revenue per billable hour), and Total WIP (aggregate work-in-progress value across all unbilled and partially billed engagements).
How does the Search tab work?
Select any Engagement ID from the dropdown and the Search tab instantly populates every field for that engagement: Date, Service Line, Client Segment, Partner, Staff Member, Client Name, Revenue, Billable Hours, WIP Amount, Billing Status, Region, Month, and Year — without any manual filtering.Accounting Firm Revenue Dashboard in Google Sheets
Can I customize the slicers on the Overview page?
Yes. The slicers on the Overview page are standard Google Sheets slicers connected to the pivot tables powering the charts. You can modify slicer labels, add new fields based on Data Sheet columns, or remove slicers that don’t match your firm’s reporting dimensions. No coding required.Accounting Firm Revenue Dashboard in Google Sheets
How does this compare to practice management software like Karbon or Clio?
Karbon and Clio cost $49–$200 per user per month and require implementation time plus IT support. This dashboard is $9.99 one-time with no recurring fees. For firms with 5–200 staff, it delivers the same revenue, WIP, and workload visibility at a fraction of the cost.Accounting Firm Revenue Dashboard in Google Sheets
Does this dashboard work for non-accounting professional services firms?
Yes. The structure — Revenue by Service Line, Billable Hours by Staff, WIP by Billing Status, Revenue by Client Segment — applies equally well to law firms, consulting practices, and engineering firms. Replace sample service line and client segment labels with your own in the Data Sheet.Accounting Firm Revenue Dashboard in Google Sheets
Is this a one-time purchase?
Yes. The Accounting Firm Revenue and WIP Dashboard in Google Sheets is $9.99 one-time, instant download, no subscription, no per-user fees, and lifetime access with free updates.Accounting Firm Revenue Dashboard in Google Sheets
About the Author
Built by PK — Microsoft Certified Professional with 15+ years of Excel, Google Sheets, and Power BI experience. Founder of NextGenTemplates, reaching 300K+ subscribers across YouTube channels. Every template is hand-built and tested before release.Accounting Firm Revenue Dashboard in Google Sheets
Conclusion
The Accounting Firm Revenue and WIP Dashboard in Google Sheets gives accounting partners, practice managers, and finance teams a 5-page analytics platform covering Total Fees, Billable Hours, Effective Rate, and Total WIP with slicer-driven filtering and Engagement ID lookups.Accounting Firm Revenue Dashboard in Google Sheets
Watch the step-by-step video Demo:
👉 Click here to Accounting Firm Revenue Dashboard in Google Sheets
✅ Instant download · One-time payment · No subscription


Reviews
There are no reviews yet.