
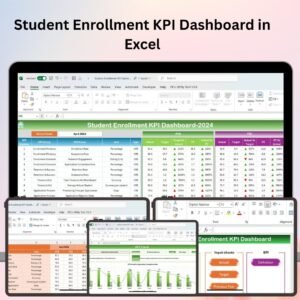
The Student Enrollment KPI Scorecard in Excel tracks every admissions-funnel metric across 4 structured worksheets — Scorecard, KPI Trend, Input Data, and KPI Definition — with dropdown-driven MTD and YTD views, Actual vs. Target comparisons, and color-coded performance indicators for every enrollment KPI. Setup takes under 10 minutes: enter your KPI definitions once, add monthly data, and every chart and scorecard row updates automatically.
🌍 Join 8,400+ teams in 40+ countries using NextGenTemplates Excel Dashboard Templates to replace paid SaaS tools with one-time-purchase Excel, Google Sheets, and Power BI templates.
✅ Instant download · One-time payment · No subscription · No per-user fees · Lifetime access
🔑 Key Features of the Student Enrollment KPI Scorecard in Excel
📊 4 connected worksheets in one Excel file — The Student Enrollment KPI Scorecard in Excel consolidates Scorecard, KPI Trend, Input Data, and KPI Definition sheets into a single workbook. A single update to the Input Data sheet propagates instantly to every scorecard row, trend chart, and color indicator with zero manual rework.
🎯 Dropdown-driven MTD and YTD performance view — Pick any month from the Scorecard sheet dropdown and the entire view refreshes instantly. The scorecard tracks enrollment KPIs such as application conversion rate, yield rate, deposit rate, melt rate, time-to-decision, cost per enrolled student, and first-year retention — all without any formula editing.
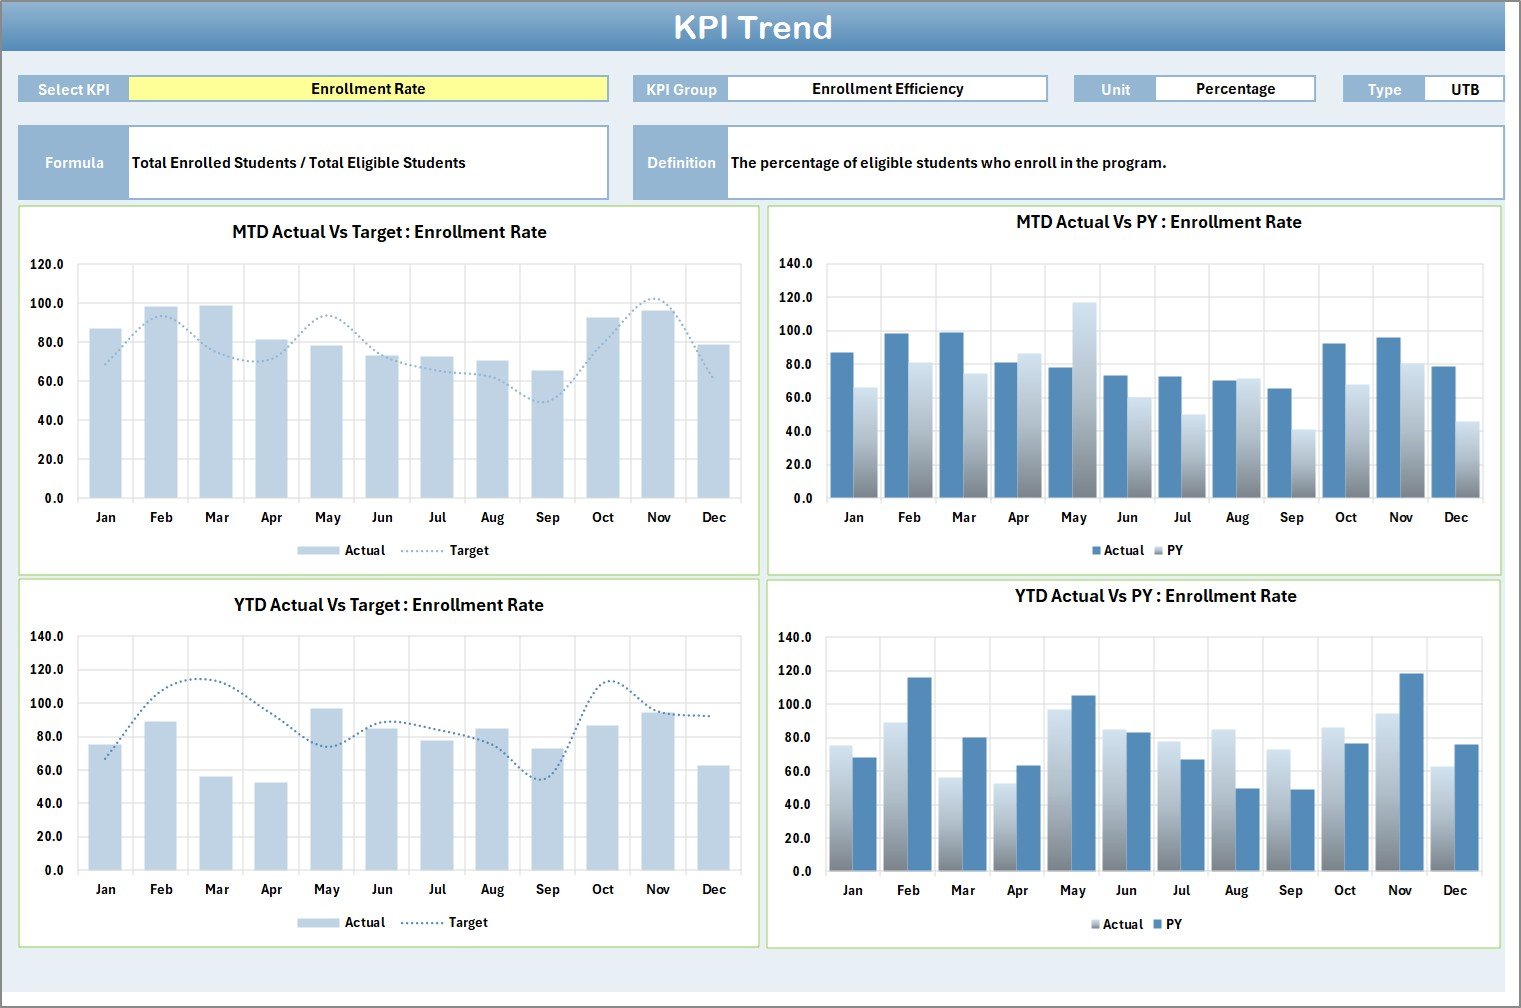
📈 Per-KPI trend analysis with three reference lines — The KPI Trend sheet lets you select any single enrollment KPI from the dropdown on cell C3 to see its Group, Unit, Type (Lower the Better or Upper the Better), Formula, and Definition alongside MTD and YTD charts comparing Actual, Target, and Previous Year figures across all 12 months.
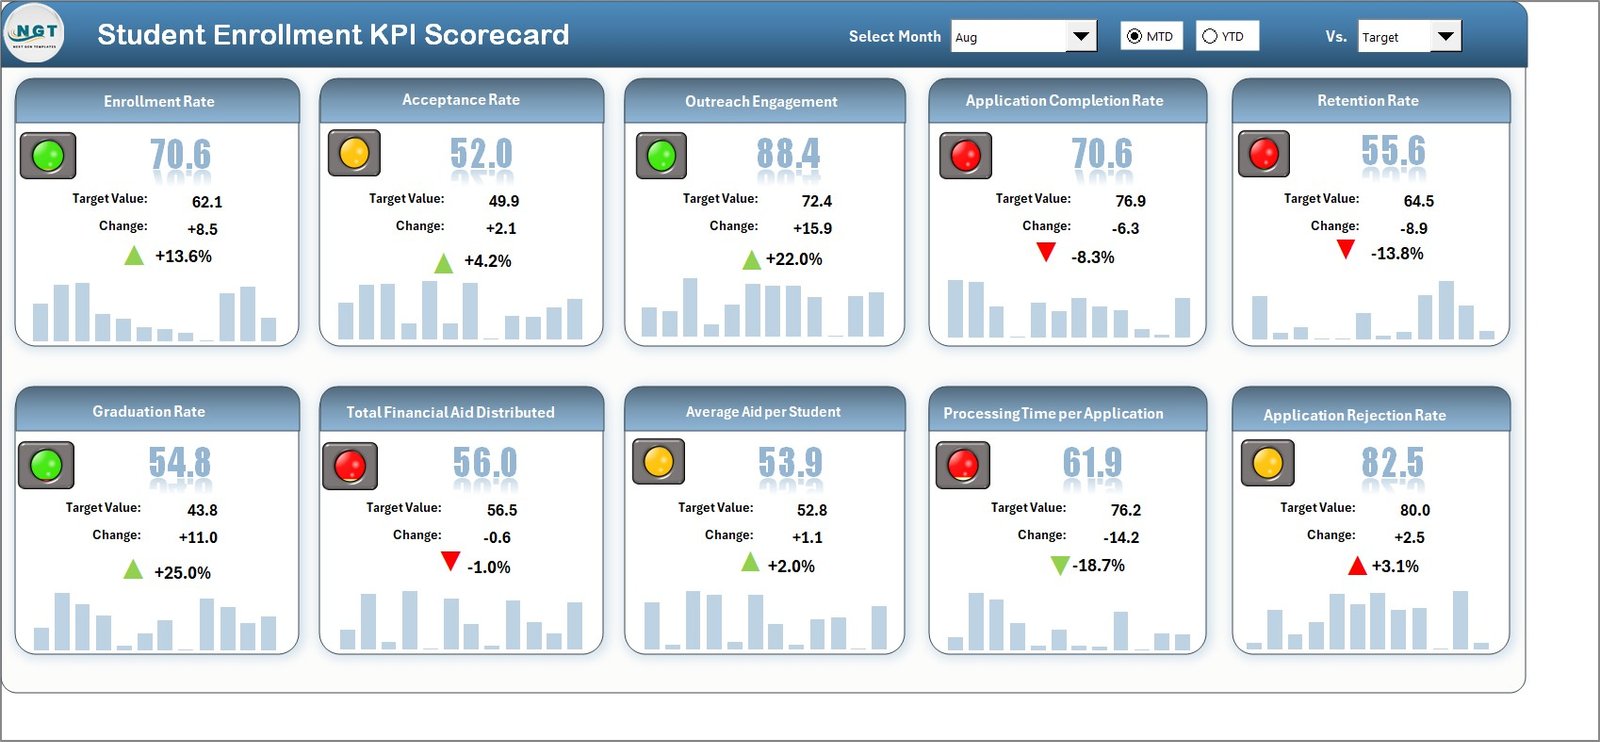
🟢 Color-coded performance indicators — Every enrollment KPI on the Scorecard sheet is flagged with conditional formatting — green for on or above target, amber for near threshold, red for below target — so admissions directors and enrollment managers can spot funnel leaks in seconds without reading individual numbers.
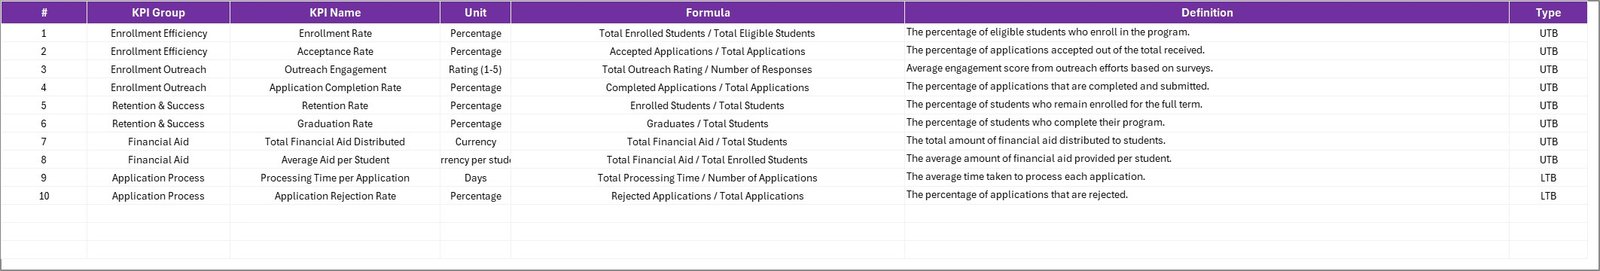
📚 Built-in KPI Definition reference — The KPI Definition sheet stores each KPI’s name, group, unit, formula, and definition. Every stakeholder — from admissions staff to deans of enrollment to accreditation reviewers — interprets each metric consistently with documented calculation logic.
⚡ No VBA, no macros, no add-ins — Built entirely on native Excel formulas, dropdown menus, data validation, and conditional formatting. Compatible with Excel 2016, 2019, 2021, Microsoft 365 on Windows and Mac, plus Excel Online for read-only review.
🔁 Unlimited custom enrollment KPIs — Add new admissions metrics through the KPI Definition sheet. The Scorecard and KPI Trend sheets automatically incorporate every new metric you define without any structural change to the workbook.
💰 One-time $12.99 with lifetime updates — No subscription, no per-user fees, no per-campus pricing. Compare against $500–$5,000 per year for higher-ed analytics SaaS like Tableau, Slate Analytics, or Qualtrics XM.
📦 What’s Inside the Student Enrollment KPI Scorecard in Excel
The workbook ships with 4 structured worksheets, each purpose-built for a stage of the enrollment KPI workflow. Sample enrollment data is included so every feature works the moment you open the file.
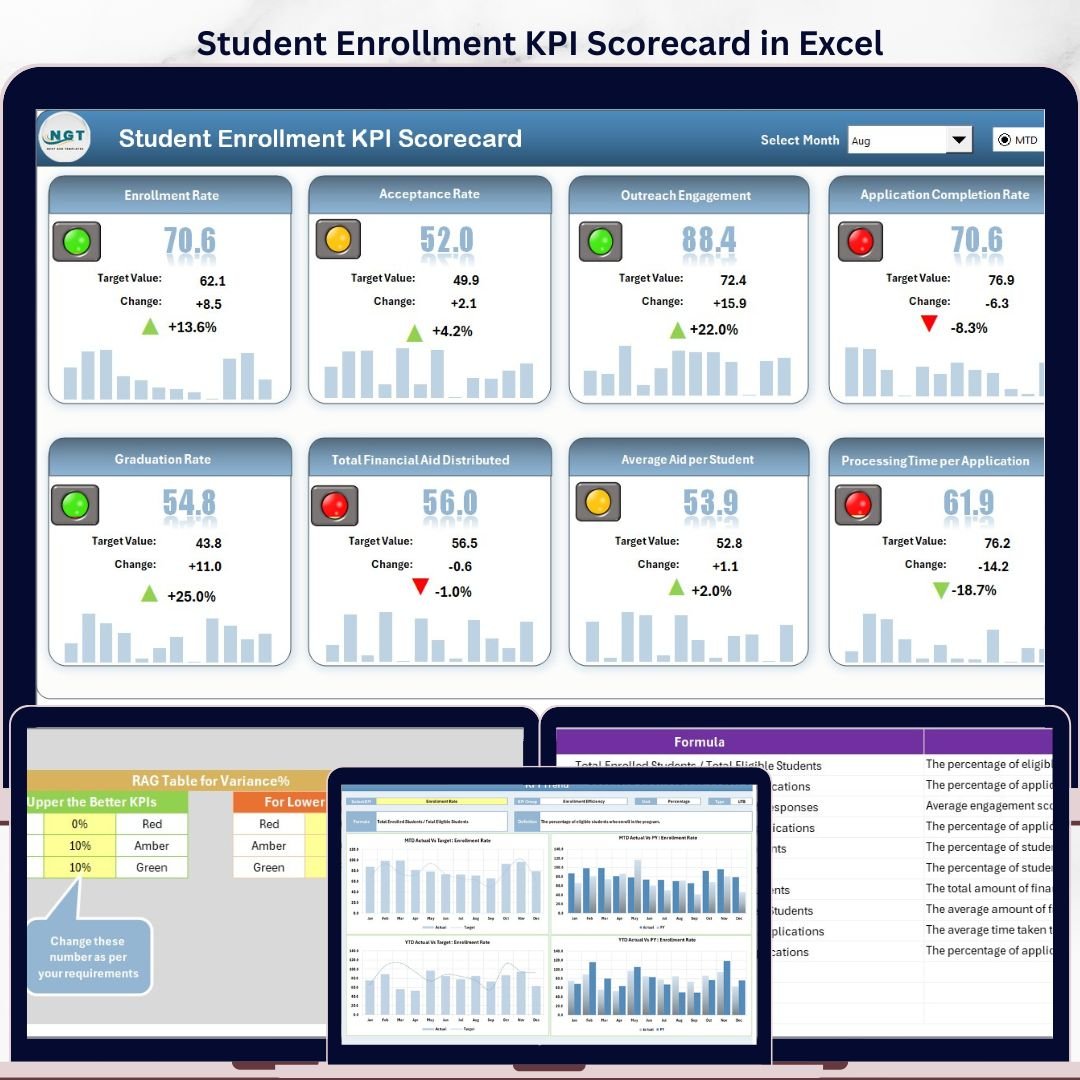
1. Scorecard Sheet
This page is the main interface for reviewing every Student Enrollment KPI at a glance. Dropdown menus let you switch between any month, MTD, or YTD view; Actual vs. Target columns sit side-by-side; visual indicators flag status using color-coded conditional formatting; and a comprehensive overview row displays every relevant KPI metric including MTD and YTD comparisons.
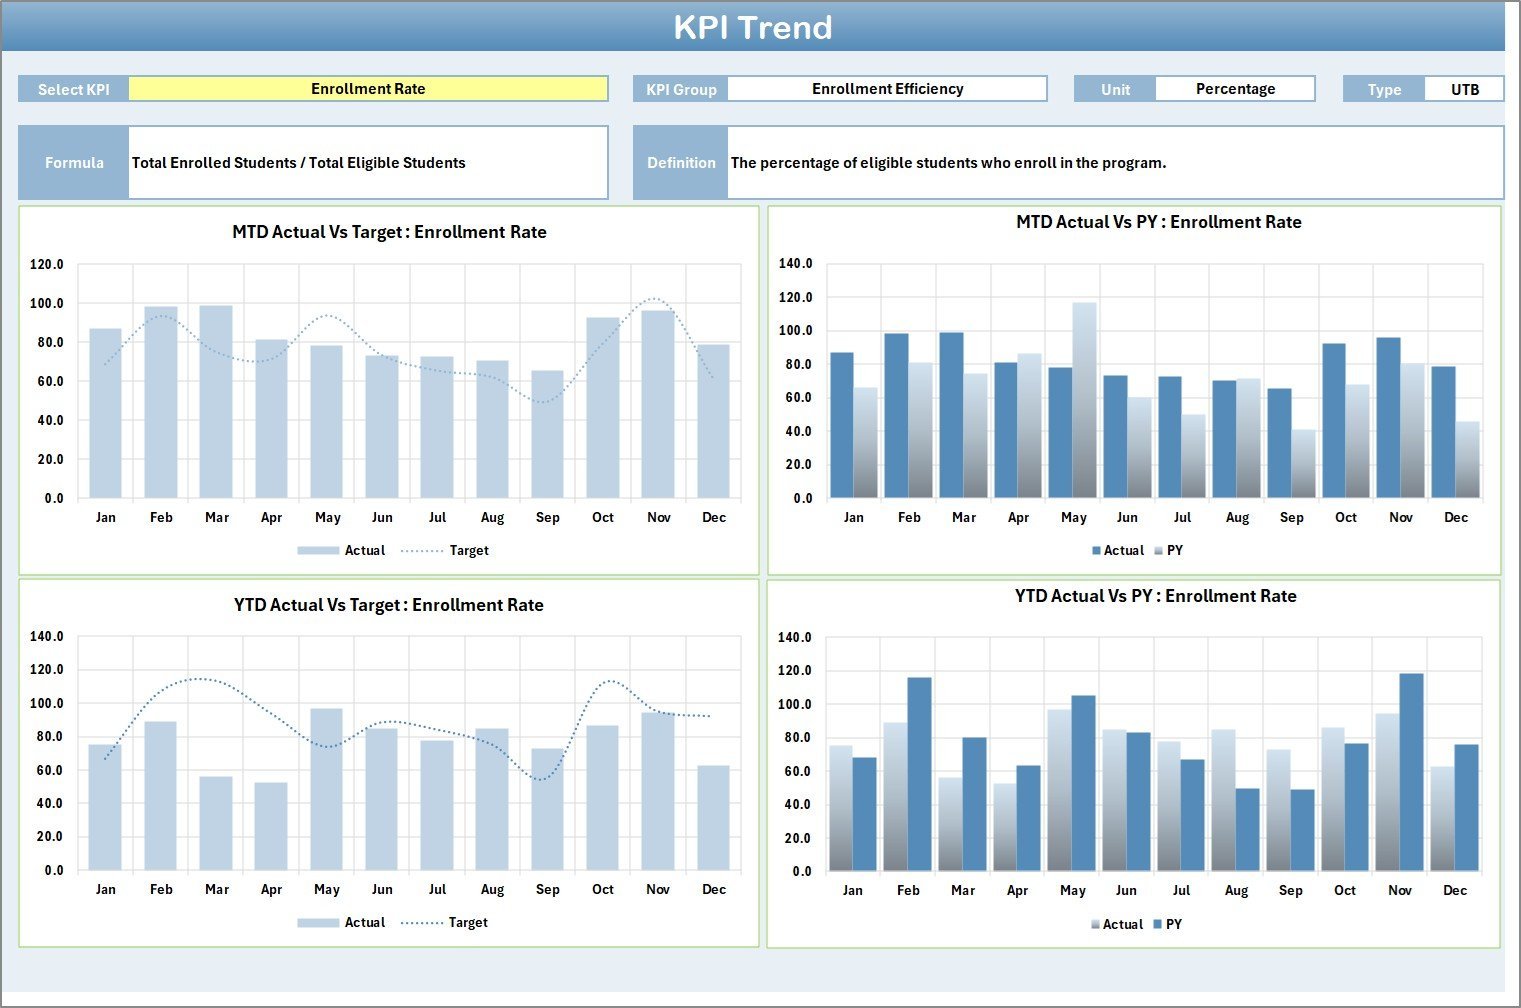
2. KPI Trend Sheet
Select any single enrollment KPI from the dropdown on cell C3 and the sheet displays the KPI Group, Unit, Type (Lower the Better or Upper the Better), Formula, and Definition. Below the metadata, MTD and YTD trend charts plot Actual, Target, and Previous Year values across all 12 months — perfect for spotting seasonal application surges or year-over-year yield drops.
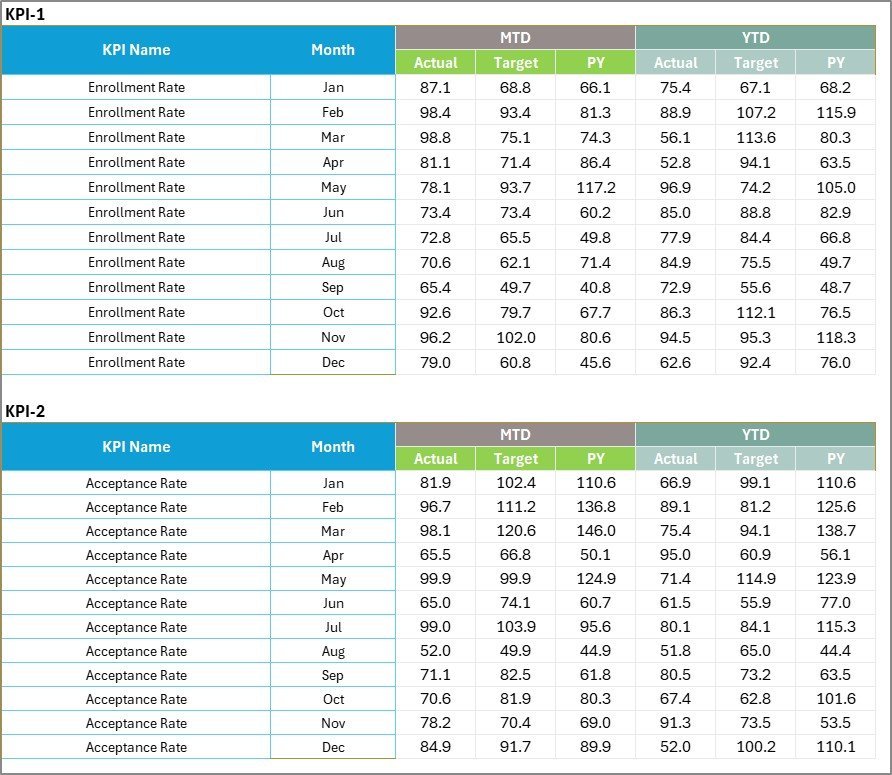
3. Input Data Sheet
Enter all enrollment KPI data here — actual values, targets, and previous-year numbers for each KPI and each month. Flexibility lets you update inquiries, applications, admits, deposits, melts, and matriculation figures as new admissions-cycle results come in, keeping the scorecard current without rebuilding charts.

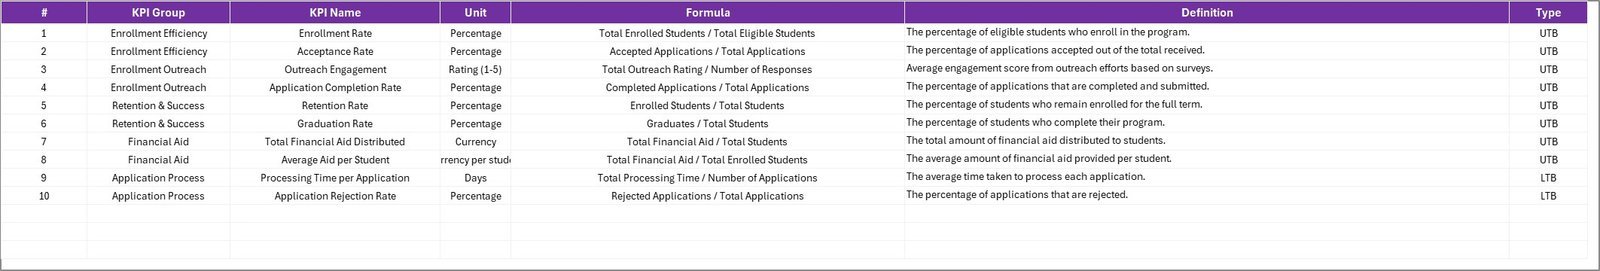
4. KPI Definition Sheet
Enter the KPI Name, KPI Group, Unit, Formula, and Definition for every enrollment metric you want to track. This sheet is the single source of truth for admissions staff, institutional researchers, and accreditation reviewers — ensuring every stakeholder interprets each Student Enrollment KPI consistently with documented logic.
📊 Student Enrollment KPI Scorecard in Excel vs. Google Sheets Scorecard vs. Paid Enrollment-Analytics SaaS — Where This Fits
| Feature | Student Enrollment KPI Scorecard in Excel | Google Sheets equivalent | Paid SaaS (Slate Analytics / Salesforce EDA / Qualtrics XM) |
|---|---|---|---|
| Cost | $12.99 one-time ✅ | Free (DIY build, 1–3 days) | $500–$5,000+ per year |
| Platform | Excel 2016, 2019, 2021, Microsoft 365 — Windows & Mac ✅ | Google Sheets (browser only) | Cloud SaaS, vendor lock-in |
| Setup time | Under 10 minutes ✅ | 1–3 days to build from scratch | 4–12 weeks (vendor onboarding + SIS integration) |
| Offline access | Yes — works fully offline ✅ | No — internet required | No — web-only |
| MTD / YTD trend charts per KPI | Built-in ✅ | Manual build | Yes (configurable) |
| KPI Definition reference | Built-in sheet with formula + definition ✅ | Manual setup | Yes |
| Customizable enrollment KPIs | Unlimited ✅ | Manual setup | Limited to plan tier |
| Year-1 cost at 5 enrollment staff | $12.99 total ✅ | $0 + dev time | $2,500–$25,000+ |
| No IT integration needed | Yes ✅ | Yes | SIS integration usually required |
For admissions offices and enrollment-management teams that want structured KPI tracking with MTD/YTD trends and color-coded indicators without paying enterprise analytics pricing, the Student Enrollment KPI Scorecard in Excel sits in the sweet spot.
👥 Who This Template Is For — and Who It’s Not For
✅ This template is built for:
- Directors and VPs of Enrollment Management at colleges, universities, and K-12 private schools tracking 8–20 admissions KPIs monthly
- Admissions managers and counselors monitoring inquiry-to-application, application-to-admit, and admit-to-deposit conversion rates
- Institutional research officers preparing MTD and YTD admissions-cycle reports for deans, provosts, and trustees
- Accreditation coordinators needing documented KPI definitions, formulas, and trend evidence for SACSCOC, HLC, NEASC, or similar reviews
- Higher-education consultants delivering enrollment performance scorecards to multiple institutional clients
- Small private schools, online-program directors, and boot camps that cannot justify $500–$5,000/year for Slate Analytics or Salesforce EDA
❌ This template is NOT for:
- Enterprise universities needing live SIS feeds from Banner, PeopleSoft, or Workday Student with automatic refresh
- Institutions requiring SSO, SOC 2 compliance, and role-based audit logging across thousands of users
- Teams wanting real-time CRM-style applicant tracking with phone, email, and SMS workflow automation
- Provosts wanting a single rolled-up cross-department view across 20+ programs with centralized governance
⚙️ How to Use the Student Enrollment KPI Scorecard in Excel
- Download and open the .xlsx file in Microsoft Excel 2016 or later. No macros to enable, no add-ins to install.
- Define your enrollment KPIs on the KPI Definition sheet — name, group, unit, formula, definition, and type (Upper or Lower the Better) for each metric.
- Enter monthly data on the Input Data sheet — Actual, Target, and Previous Year values for each KPI and each month of the admissions cycle.
- Review the Scorecard sheet — pick any month from the dropdown and read the MTD or YTD performance grid with Actual vs. Target and color-coded status.
- Drill into a single KPI on the KPI Trend sheet — pick a metric from the dropdown on cell C3 and review its MTD/YTD trend chart with Actual, Target, and Previous Year lines.
- Share with the team — save to OneDrive or SharePoint so admissions staff, institutional research, and senior leadership can co-edit at zero per-user cost.
💼 Real-World Use Cases
Anita is the Director of Admissions at a mid-size liberal arts college. She uses the Student Enrollment KPI Scorecard in Excel to track 14 funnel KPIs — including inquiry-to-application rate, yield rate, deposit melt, and time-to-decision — against monthly targets. Each Friday she shares the Scorecard sheet snapshot with her VP of Enrollment, switching to the KPI Trend sheet whenever a metric drops below target so the team can adjust outreach campaigns the same week.
Marcus runs institutional research at a state university system. He standardizes enrollment KPI definitions across 6 campuses using the KPI Definition sheet, then aggregates monthly Input Data sheets from each admissions office. The YTD trend charts surface which campuses consistently lag on the admit-to-enroll conversion target so the chancellor can redirect financial-aid leveraging earlier in the cycle.
Priya is an enrollment consultant for online MBA programs. She delivers the Student Enrollment KPI Scorecard in Excel to 8 client schools at the start of every admissions cycle. The KPI Definition sheet’s formula column doubles as an accreditation-ready documentation portfolio, and the YTD trend view gives each client a board-ready visual without paying for a separate BI subscription.
❓ Frequently Asked Questions
What enrollment KPIs does the Student Enrollment KPI Scorecard in Excel track?
The Student Enrollment KPI Scorecard in Excel tracks any admissions-funnel KPI you define — common examples include inquiry volume, application volume, application conversion rate, admit rate, yield rate, deposit rate, melt rate, time-to-decision, cost per enrolled student, first-year retention, and diversity composition. All metrics are fully customizable from the KPI Definition sheet with no formula editing required.
How long does setup take for the Student Enrollment KPI Scorecard in Excel?
Setup takes under 10 minutes. Open the file, fill the KPI Definition sheet with your enrollment metrics, add monthly Actual and Target values on the Input Data sheet, and the Scorecard plus KPI Trend sheets update automatically. The workbook ships with sample data so every feature works before you enter your institution’s real figures.
Does the Student Enrollment KPI Scorecard in Excel use VBA or macros?
No. The Student Enrollment KPI Scorecard in Excel is built entirely on native Excel formulas, conditional formatting, dropdown menus, and data validation. There are no VBA scripts, macros, or external add-ins, so the file opens cleanly on managed admissions-office laptops where macros are blocked by IT policy.
Can I add custom student enrollment KPIs?
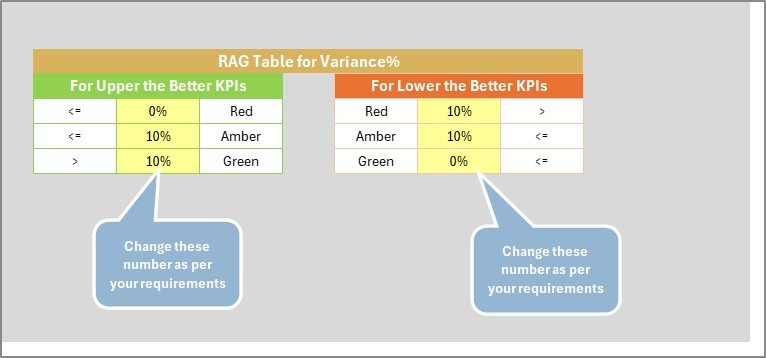
Yes. The KPI Definition sheet accepts unlimited custom enrollment KPIs. Add the KPI name, group, unit, formula, and definition, and mark each as LTB (Lower the Better, e.g., melt rate) or UTB (Upper the Better, e.g., yield rate). The Scorecard and KPI Trend sheets automatically incorporate every new metric you add.
How does this compare to paid enrollment-analytics platforms like Slate Analytics or Salesforce EDA?
The Student Enrollment KPI Scorecard in Excel costs $12.99 one-time. Slate Analytics, Salesforce Education Data Architecture, and Qualtrics XM run $500–$5,000+ per year, require IT onboarding and Student Information System integration. For admissions teams that need structured MTD/YTD KPI tracking with trend charts and color indicators without IT dependency, this scorecard delivers core analytical value at under 1% of the annual SaaS cost.
Which Excel versions are compatible?
The Student Enrollment KPI Scorecard in Excel works with Microsoft Excel 2016, 2019, 2021, and Microsoft 365 on both Windows and Mac. It also opens in Excel Online for read-only review. All formulas, dropdowns, conditional formatting, and trend charts are fully compatible across these versions.
Can I share the scorecard with my whole admissions team?
Yes. Save the Student Enrollment KPI Scorecard in Excel to OneDrive or SharePoint and your entire admissions office, institutional research staff, and senior leadership can access and co-edit at no extra cost. There are no per-user fees, no seat limits, and no campus-license restrictions.
👤 About the Author
Built by PK — Microsoft Certified Professional with 15+ years of Excel, Google Sheets, and Power BI experience. Founder of NextGenTemplates, reaching 300K+ subscribers across YouTube channels (@PK-AnExcelExpert, @NextGenTemplates, @NeoTechNavigators). Every template is hand-built and tested before release.
🔗 Explore Related Templates
🔹 University Department KPI Scorecard in Excel — sister scorecard with the same 4-sheet structure for tracking academic department performance.
🔹 Vocational Training KPI Scorecard in Excel — same scorecard pattern adapted for vocational and trade-school KPIs.
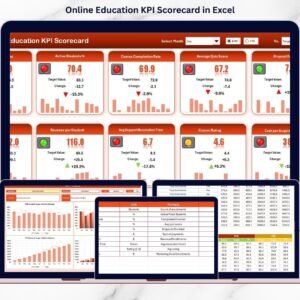
🔹 Online Education KPI Scorecard in Excel — variant for fully online programs covering enrollment, engagement, and completion.
🔹 Continuing Education Programs KPI Dashboard in Excel — full multi-page dashboard upgrade for continuing-education and lifelong-learning programs.
🔹 Also available as: Education KPI Scorecard in Google Sheets — same scorecard logic, browser-based, mobile-friendly for distributed teams.
🔹 Browse all Excel KPI Dashboard Templates on NextGenTemplates.
📖 Click here to read the Detailed Blog Post
🎥 Visit our YouTube channel for step-by-step video tutorials
👉 YouTube.com/@NextGenTemplates


Reviews
There are no reviews yet.