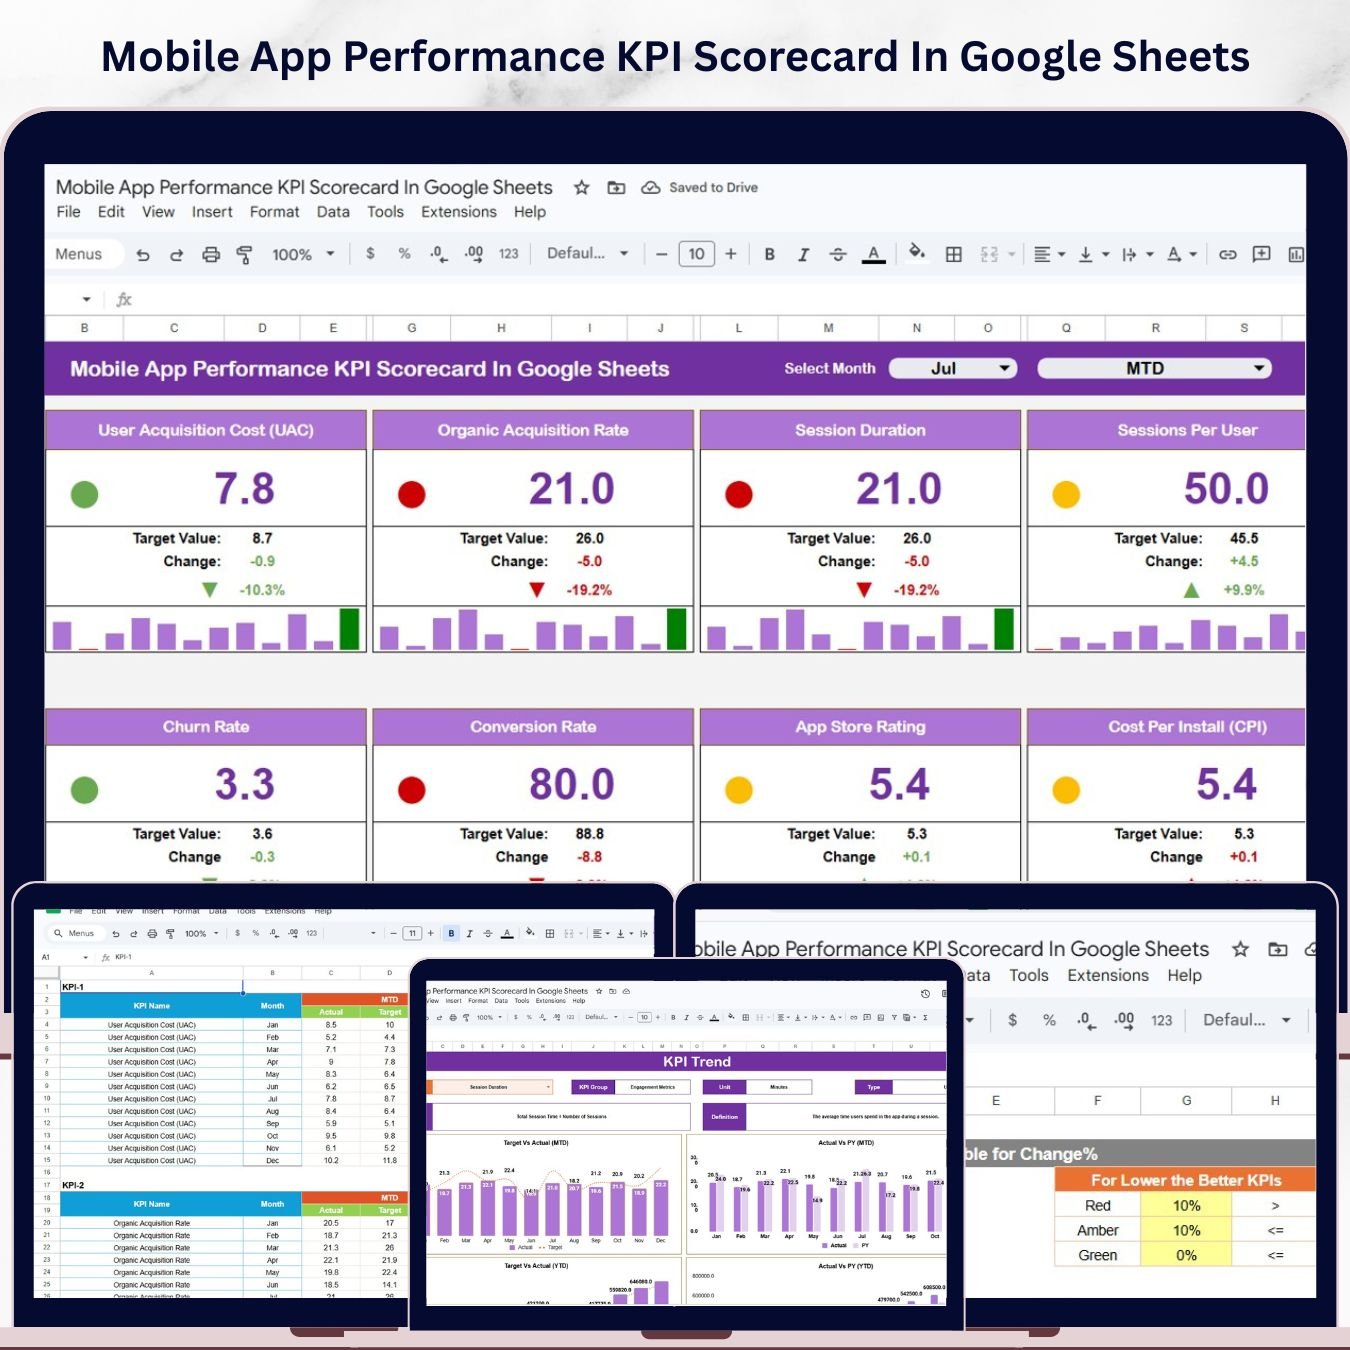

The Mobile App Performance KPI Scorecard in Google Sheets tracks 20+ mobile app KPIs across 4 structured sheets, with MTD (Month-to-Date) and YTD (Year-to-Date) trend charts for every metric. Setup takes under 5 minutes — enter your targets, log actual values, and the scorecard auto-updates performance status, trend direction, and variance against plan.Mobile App Performance KPI Scorecard In Google Sheets
🌍 Join 8,400+ teams in 40+ countries using NextGenTemplates to replace expensive SaaS analytics tools with one-time-purchase Google Sheets templates.Mobile App Performance KPI Scorecard In Google Sheets
Mobile App Performance KPI Scorecard In Google Sheets
🔑 Key Features of Mobile App Performance KPI Scorecard in Google Sheets
🔹 20+ Pre-Built Mobile App KPIs — This scorecard tracks KPIs across the full mobile app lifecycle: Acquisition (CAC, Install Rate, Organic vs. Paid Split), Engagement (DAU, MAU, Session Duration, Stickiness), Retention (Day-1, Day-7, Day-30 Retention Rate, Churn Rate), Monetization (ARPU, LTV, Revenue), and Quality (Crash Rate, App Store Rating, Load Time). All 20+ KPIs are pre-configured and ready to useMobile App Performance KPI Scorecard In Google Sheets
🔹 MTD and YTD Dual-Mode Analysis — The Scorecard sheet lets you toggle between Month-to-Date and Year-to-Date performance with a single dropdown, so leadership gets the view they need without you building separate reports.
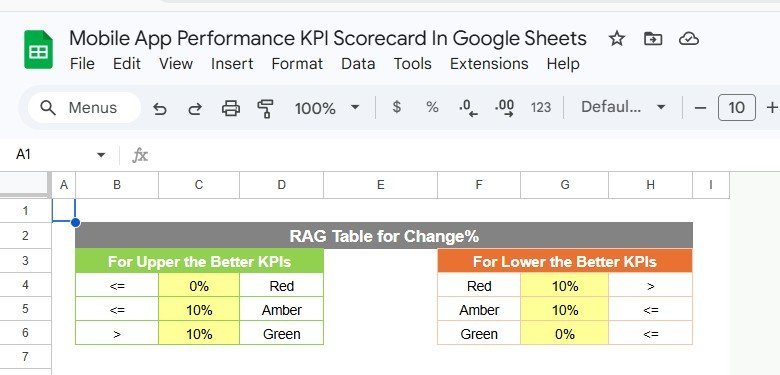
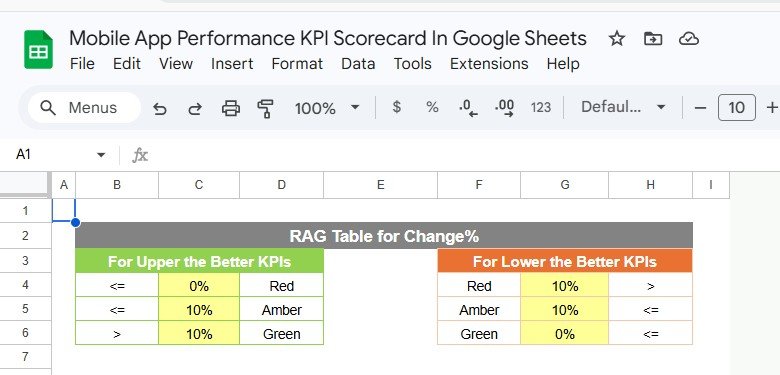
🔹 Color-Coded Visual Indicators — Each KPI row displays a traffic-light status (green/amber/red) based on actual vs. target variance. KPIs marked “Lower the Better” (Crash Rate, Churn Rate) use automatically inverted logic — no manual formula adjustments needed.
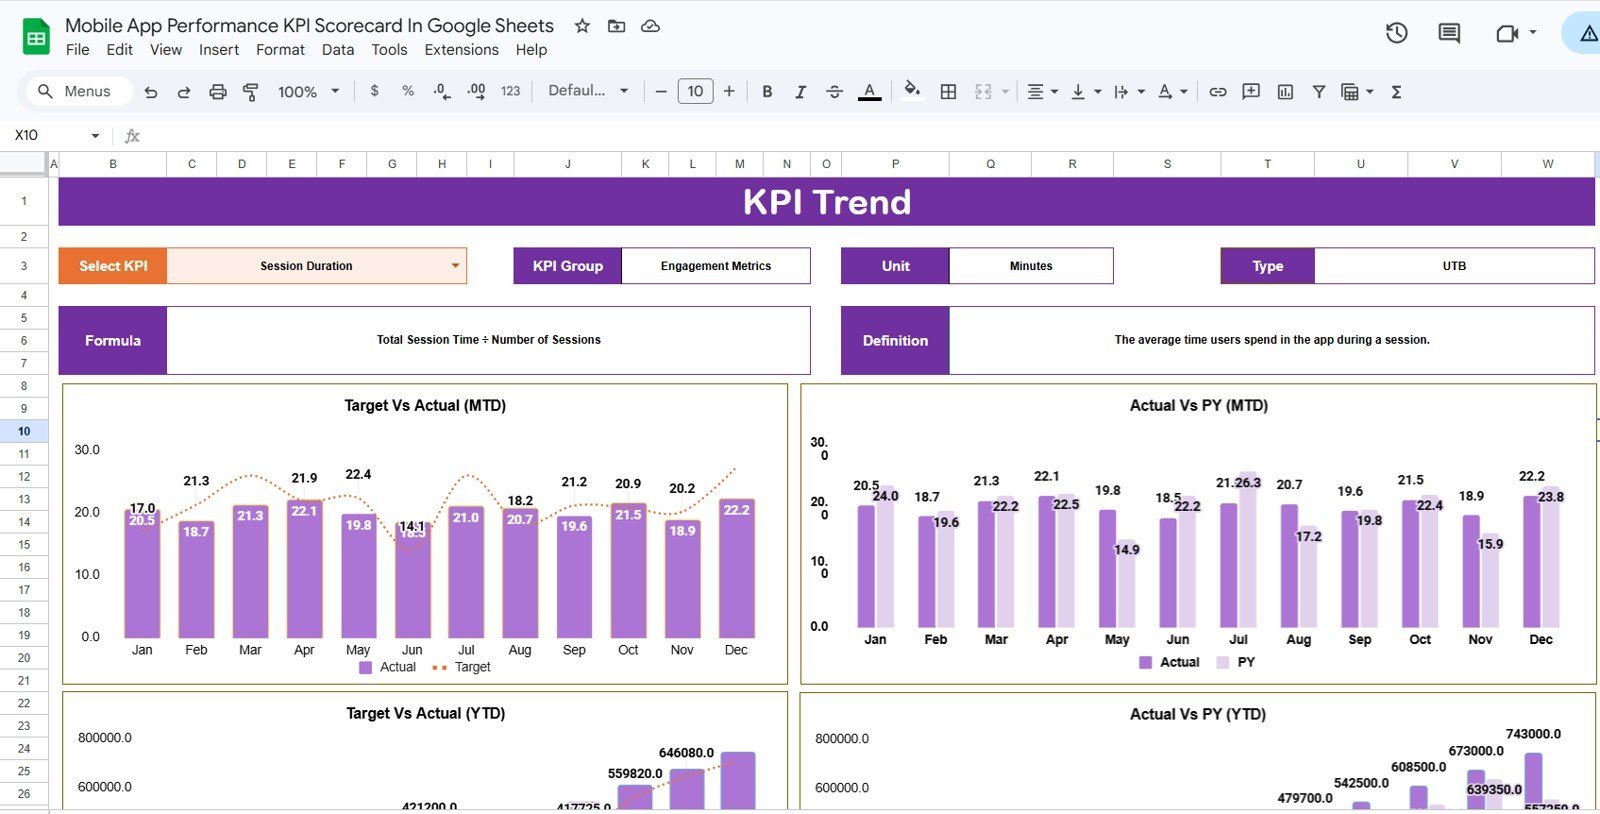
🔹 Per-KPI Trend Charts — The KPI Trend sheet generates MTD and YTD line charts for any selected KPI — showing Actual, Target, and Prior Year lines side by side. Select from the dropdown on C3 and the chart refreshes instantly.
🔹 Structured KPI Definition Library — The KPI Definition sheet stores each metric’s name, group, unit, formula, and plain-English definition. This turns your scorecard into a single source of truth that standardizes how your entire team measures app performance.
📦 What’s Inside the Mobile App Performance KPI Scorecard in Google Sheets
Mobile App Performance KPI Scorecard in Google Sheets
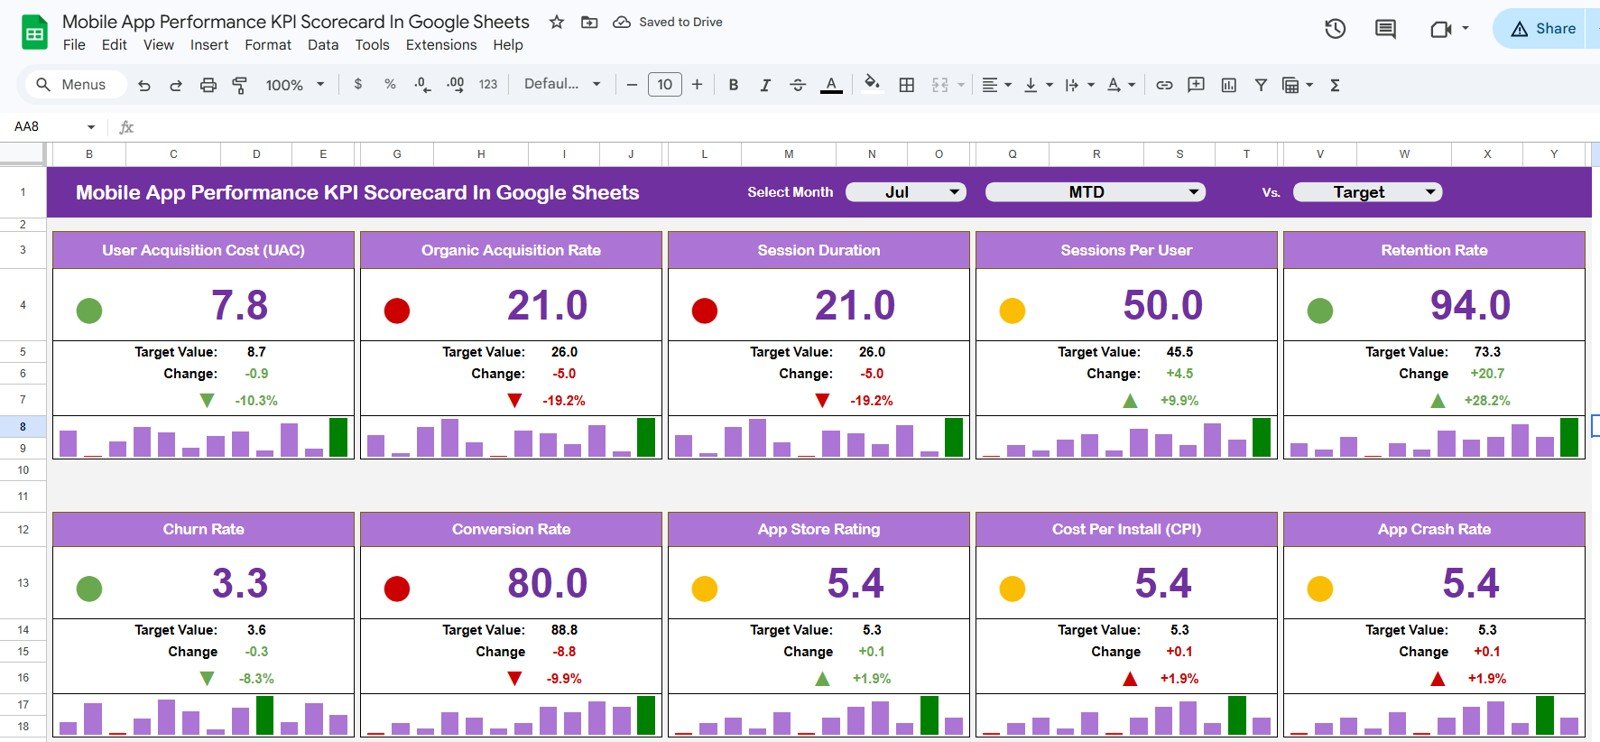
1. Scorecard Sheet — The main executive view. Select the month and toggle between MTD and YTD mode from the dropdowns. Every KPI row shows Actual, Target, Prior Year, Variance %, and a color-coded performance indicator. This is your one-page mobile app health summary — ready to drop into a board deck or weekly leadership sync.
KPI Trend Sheet
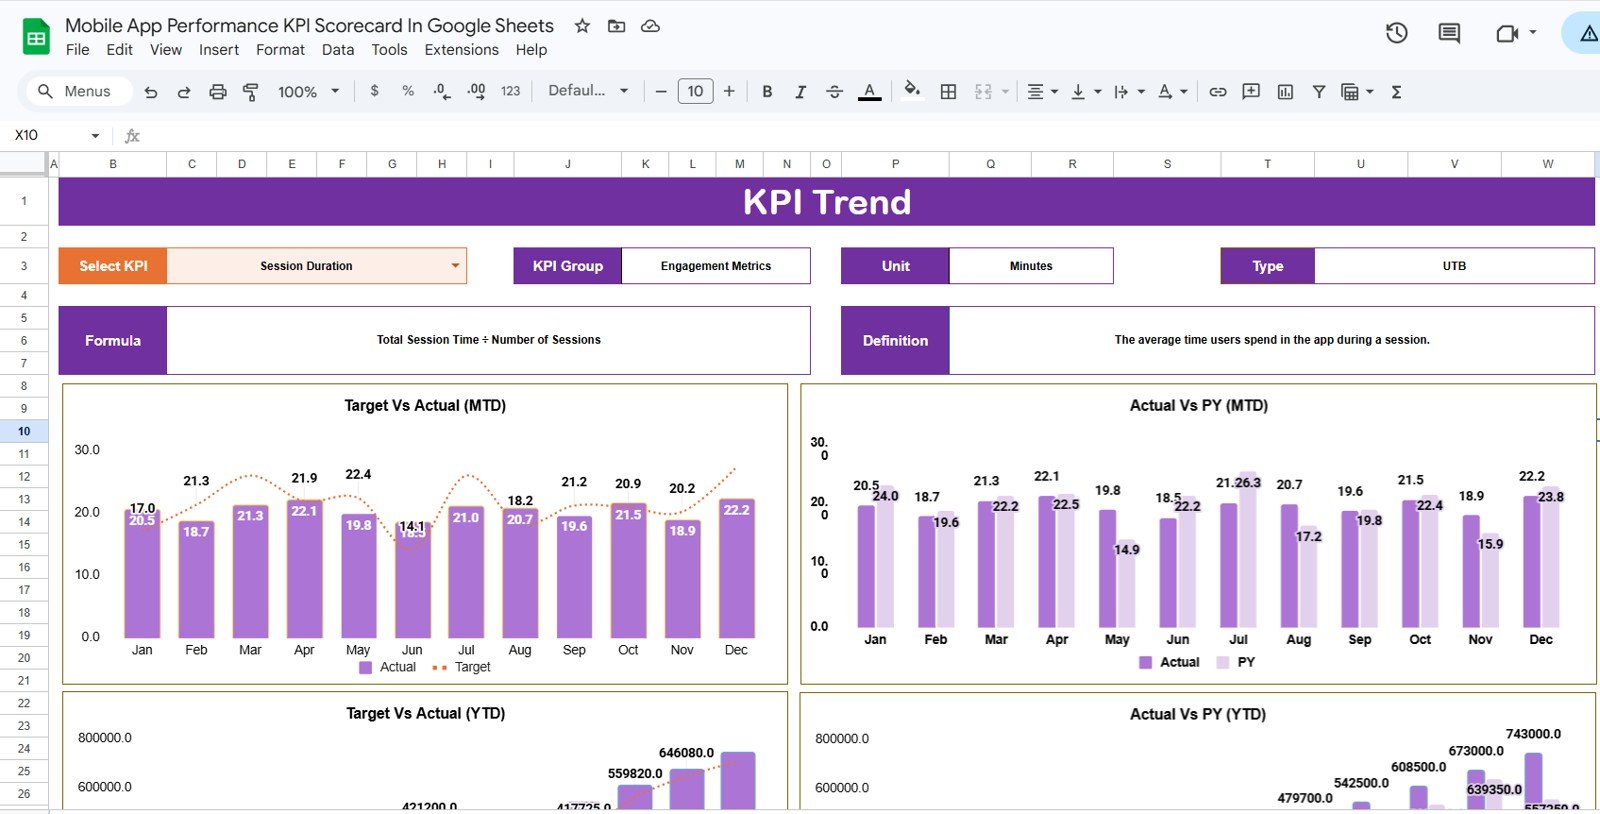
2. KPI Trend Sheet — Select any KPI from the dropdown on cell C3 to see its KPI Group, Unit, Type (Lower the Better / Upper the Better), Formula, and Definition. Two dynamic charts below show MTD and YTD trend lines for Actual, Target, and Prior Year — essential for catching deteriorating metrics before they surface in app store reviews.Mobile App Performance KPI Scorecard In Google Sheets
Input Data Sheet
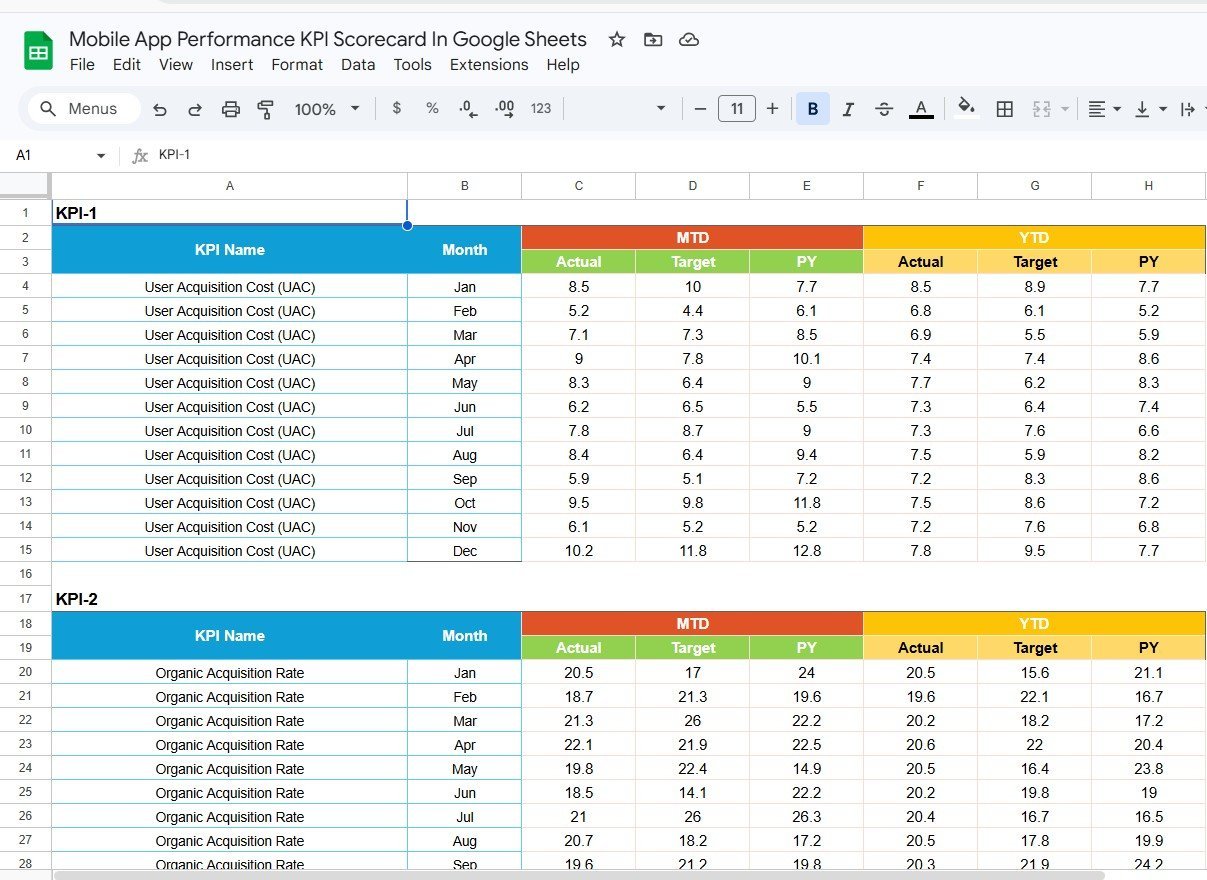
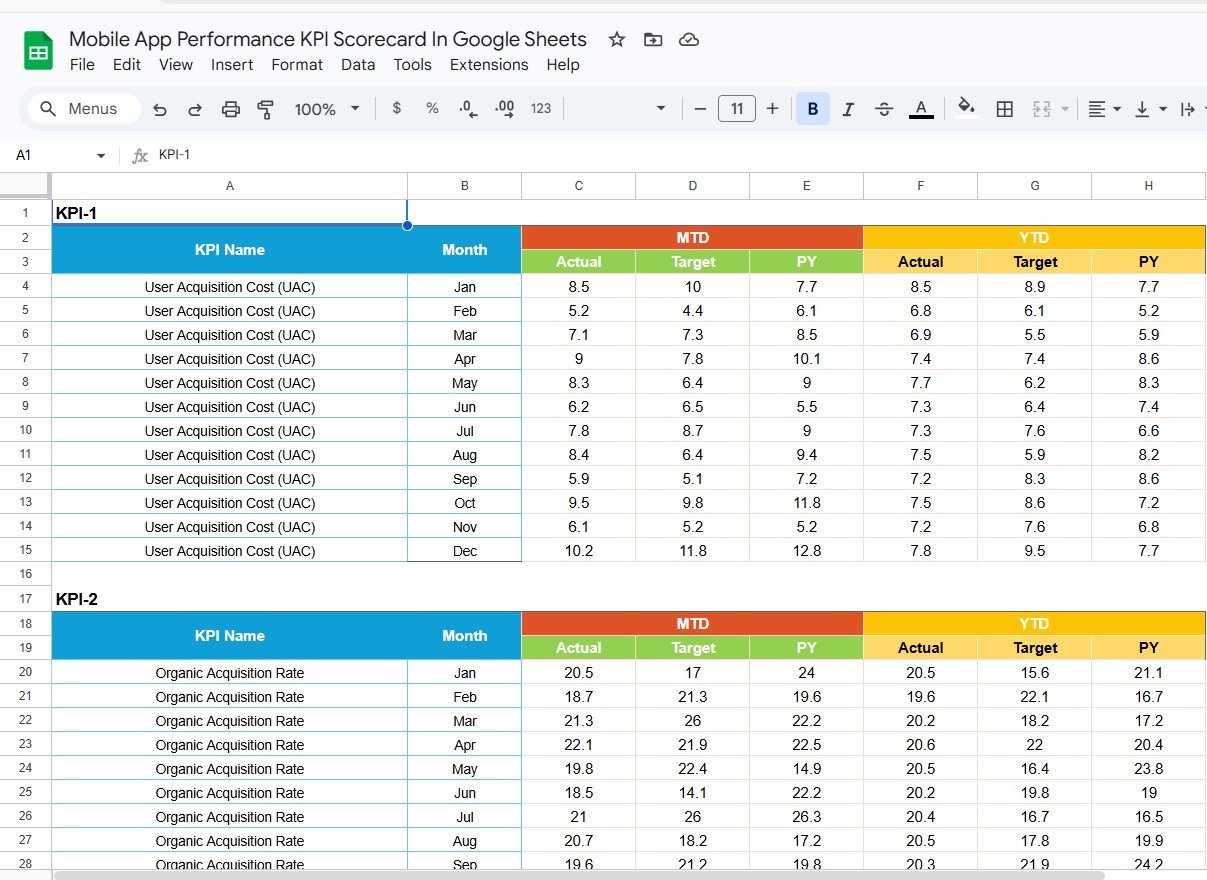
3. Input Data Sheet — The engine behind the scorecard. Record monthly actual values, targets, and prior-year figures for each KPI in a clean table layout. All formulas in the Scorecard and Trend sheets pull directly from here — update this sheet monthly and every other view refreshes automatically.
KPI Definition Sheet Tab
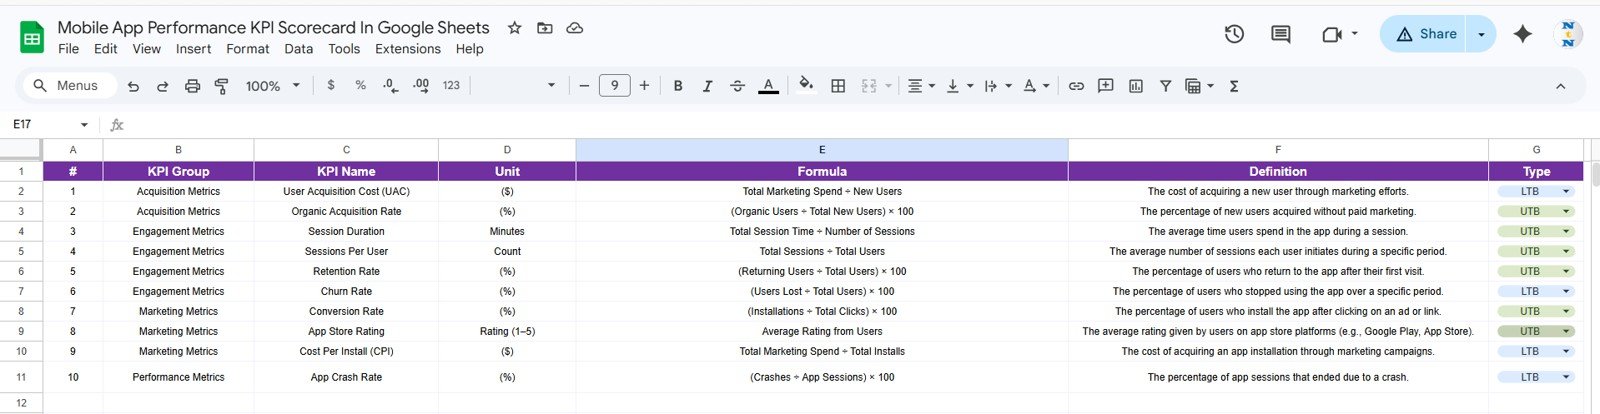
4. KPI Definition Sheet — Define each KPI’s name, KPI Group, Unit, Formula, and full definition. This eliminates the “which formula are we actually using?” debate in sprint reviews and ensures your iOS team, Android team, and marketing team all track performance the same way.
Mobile App Performance KPI Scorecard — Full Template Overview
📊 Mobile App Performance KPI Scorecard vs. Excel Dashboard vs. Firebase Analytics — Where This Fits
| Feature | Mobile App Performance KPI Scorecard (Google Sheets) | Microsoft Excel KPI Dashboard | Firebase Analytics / AppsFlyer |
|---|---|---|---|
| Cost | $8.99 one-time | Requires Excel license (~$10/mo) | $500–$2,000+/month for full access |
| Platform | Google Sheets (browser-based) | Desktop Excel required | Web SaaS — requires SDK integration |
| Setup time | Under 5 minutes | 15–30 minutes | 2–4 weeks engineering integration |
| Real-time collaboration | ✅ Built-in Google link sharing | Requires OneDrive or email | ✅ Yes |
| Mobile access | ✅ Any browser or Sheets app | Limited on mobile | ✅ Yes |
| Customizable KPI definitions | ✅ Full control via KPI Definition sheet | ✅ Editable | ❌ Locked to SDK event taxonomy |
| MTD + YTD trend charts | ✅ Per-KPI dynamic charts | Manual chart setup | Custom dashboards only |
| Annual cost (5 users) | $8.99 total | ~$60/year | $6,000–$24,000/year |
| Engineering required | ✅ No — pure spreadsheet | ✅ No | ❌ Yes — SDK + developer time |
For product managers and startup teams who need clear app performance visibility without Firebase’s engineering overhead or AppsFlyer’s agency-level budget, the Mobile App Performance KPI Scorecard in Google Sheets sits in the sweet spot.
👥 Who This Template Is For — and Who It’s Not For
✅ This template is built for:
- Product managers at mobile app startups and scale-ups who need a lightweight KPI tracking system
- App developers and tech leads who monitor crash rate, load time, and session metrics without a separate tool
- Marketing teams tracking CAC, install rates, and Day-30 retention in monthly reviews
- Indie developers and bootstrapped app studios that need reporting without paid analytics platforms
- Agencies managing multiple client apps who need a standardized KPI reporting format
❌ This template is NOT for:
- Enterprise teams needing real-time event-level analytics (Firebase or Mixpanel serves you better)
- Teams that need automated data ingestion from app stores — this is a manual-entry scorecard
- Teams requiring user-level cohort analysis or funnel visualization (use Amplitude or Heap instead)
⚙️ How to Use the Mobile App Performance KPI Scorecard in Google Sheets
1. Open the PDF guide included in your download — it contains the Google Sheets copy link. Click it to create your own editable copy in Google Drive.
2. Go to the KPI Definition sheet. Enter your KPI names, groups, units, formulas, and definitions. Edit or remove the pre-built KPIs to match your specific app.Mobile App Performance KPI Scorecard In Google Sheets
3. In the Input Data sheet, enter monthly actual values, targets, and prior-year figures for each KPI.
4. Open the Scorecard sheet. Select the reporting month from the dropdown and choose MTD or YTD mode. Review the color-coded performance indicators and variance figures for each KPI.
5. Use the KPI Trend sheet to deep-dive into any individual metric — select it from the C3 dropdown to see full-year MTD and YTD trend charts vs. target and prior year.Mobile App Performance KPI Scorecard In Google Sheets
💼 Real-World Use Cases
Ravi leads product at a 15-person fintech app startup. He uses the Mobile App Performance KPI Scorecard in Google Sheets to prepare his weekly leadership sync — tracking DAU/MAU ratio, crash rate, and ARPU in one color-coded view. The visual indicators let him flag deteriorating metrics before they surface in App Store reviews, without paying $800/month for a dedicated analytics platform.
Priya runs growth marketing for a fitness app with 200K installs. She monitors acquisition KPIs (CAC, install rate, organic vs. paid split) and retention KPIs (Day-1 and Day-30 retention) in the same scorecard. Sharing it via a Google Sheets link means no Excel version conflicts and no file attachment chains in Slack.
Tom is a freelance app consultant managing three client apps. He creates one copy per client, customizes the KPI Definition sheet for each app category, and presents the Scorecard sheet directly in monthly client reviews. The template cost pays for itself on the first engagement.
❓ Frequently Asked Questions
What KPIs does the Mobile App Performance KPI Scorecard in Google Sheets track?
The scorecard tracks 20+ mobile app KPIs across five groups: Acquisition (installs, CAC, organic split), Engagement (DAU, MAU, session duration, stickiness), Retention (Day-1, Day-7, Day-30 retention, churn rate), Monetization (ARPU, LTV, revenue), and Quality (crash rate, app rating, load time). All KPIs are editable in the KPI Definition sheetMobile App Performance KPI Scorecard In Google Sheets
Do I need to install any software to use this scorecard?
No installation required. The Mobile App Performance KPI Scorecard in Google Sheets runs entirely in your browser. Open the PDF guide from your download, click the Google Sheets copy link, and your editable version is ready in Google Drive in under a minuteMobile App Performance KPI Scorecard In Google Sheets
Can I add my own KPIs beyond the 20+ pre-built ones?
Yes. The KPI Definition sheet is fully editable. Add new rows with your KPI name, group, unit, formula, and definition. New KPIs flow through to the Input Data and Scorecard sheets automatically — no formula editing needed.Mobile App Performance KPI Scorecard In Google Sheets
How does this compare to Firebase Analytics for KPI tracking?
Firebase provides real-time event-level analytics that requires SDK integration and engineering resources. The Mobile App Performance KPI Scorecard in Google Sheets is a manual MTD/YTD scorecard for leadership-level reviews — complementary to Firebase, not a replacement for event tracking. Cost: $8.99 once vs. Firebase paid tiers at $200–$2,000+/month.
Does the template work for both iOS and Android apps?
Yes. The KPI structure is platform-agnostic. Track iOS and Android separately by adding platform-specific KPI groups in the KPI Definition sheet, or use combined totals if you manage both platforms under one product.
How long does setup take?
Setup takes under 5 minutes for most users. Open the PDF guide, click the copy link, edit your KPI definitions, then enter the first month of data in the Input Data sheet. The Scorecard auto-updates immediately.
Can I share this scorecard with my team or investors?
Yes. Google Sheets built-in sharing lets you grant view-only, comment, or edit access to any collaborator. Investors and executives get a clean read-only view while your data stays protected — no file attachments or version confusion.
👤 About the Author
Built by PK — Microsoft Certified Professional with 15+ years of Excel, Google Sheets, and Power BI experience. Founder of NextGenTemplates, reaching 300K+ subscribers across YouTube channels (@PK-AnExcelExpert, @NextGenTemplates, @NeoTechNavigators). Every template is hand-built and tested before release.
🔗 Explore Related Templates
🔹 Cyber Incident Response KPI Scorecard in Excel — Track 15+ IT security KPIs including incident response time, breach rate, and remediation SLA adherence.
🔹 UX/UI Design KPI Scorecard in Excel — Monitor design team performance with task completion rate, usability score, and design iteration metrics.
🔹 Product Development KPI Scorecard in Excel — Measure sprint velocity, feature delivery rate, and product quality KPIs across your development team.
Explore the full library of Google Sheets Dashboard Templates for more analytics and reporting tools.
📖 Click here to read the Detailed Blog Post
🎥 Visit our YouTube channel for step-by-step video tutorials
👉 YouTube.com/@NextGenTemplates


Reviews
There are no reviews yet.