

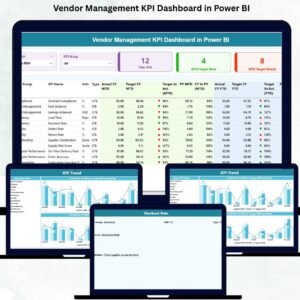
The Supplier Performance KPI Dashboard in Power BI tracks supplier metrics across 3 interactive report pages—covering MTD and YTD performance with 18 data columns per KPI, LTB/UTB classification, color-coded ▼▲ status icons, and prior-year comparisons. Setup takes under 15 minutes: fill three Excel sheets and every visual auto-updates in Power BI.
🌍 Join 8,400+ teams in 40+ countries using NextGenTemplates to replace paid procurement software with one-time-purchase Power BI KPI Dashboard templates.
✅ Instant download · One-time payment · No subscription · No per-user fees · Lifetime access
🔑 Key Features of the Supplier Performance KPI Dashboard in Power BI
🔹 3-Page Report Structure – Summary, KPI Trend, and hidden KPI Definition drill-through pages give procurement teams a full picture in one .pbix file.
🔹 18-Column KPI Summary Table – The dashboard displays KPI Number, Group, Name, Unit, Type (LTB/UTB), Actual CY MTD, Target CY MTD, MTD Icon (▼▲), Target vs Actual MTD %, PY MTD, CY vs PY MTD %, Actual CY YTD, Target CY YTD, YTD Icon, Target vs Actual YTD %, PY YTD, and CY vs PY YTD % — all in one scrollable table. This dashboard tracks every supplier metric from quality rates to delivery accuracy in a single view.
🔹 LTB / UTB KPI Logic – Automatically applies the correct success rule: Lower-the-Better KPIs (defect rate, lead time, return rate) show green when actual is below target; Upper-the-Better KPIs (on-time delivery %, fill rate, OTIF) show green when actual exceeds target.
🔹 Month & KPI Group Slicers – Filter the Summary page by any month or KPI Group (Quality, Delivery, Cost, Responsiveness) in one click.
🔹 3 KPI Summary Cards – Instant totals: Total KPIs tracked, MTD Target Meet count, and MTD Target Missed count.
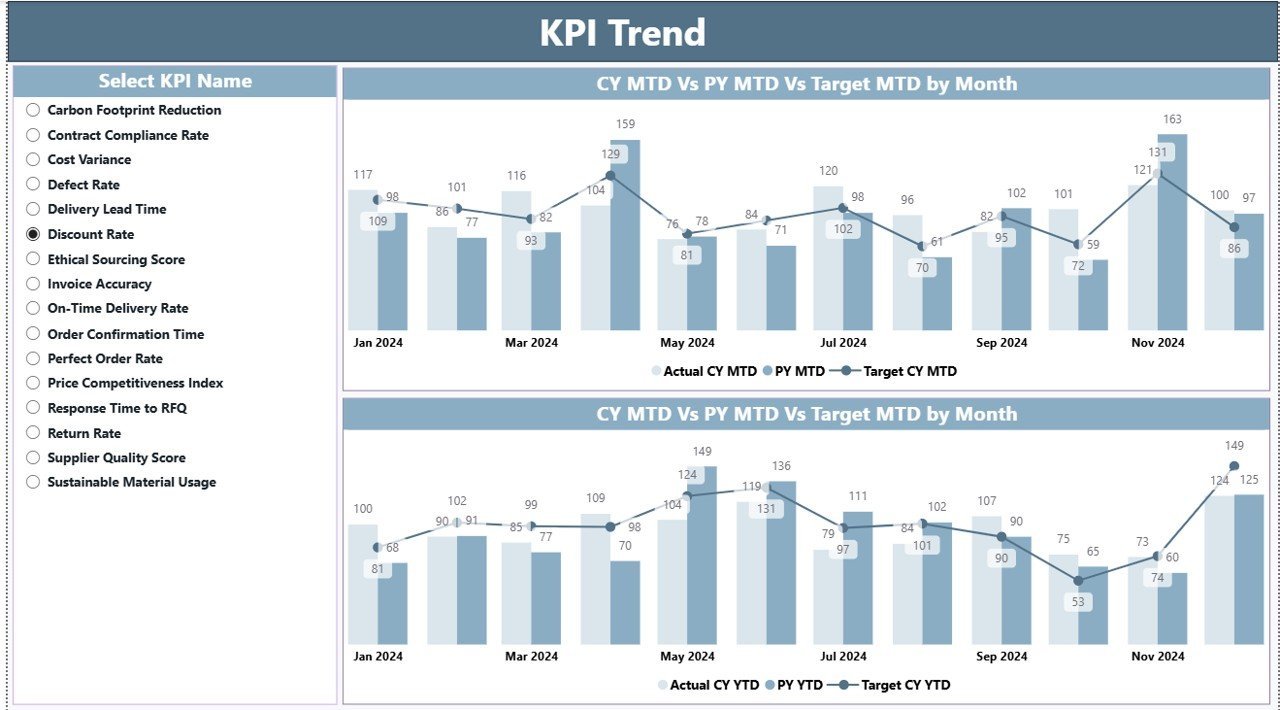
🔹 KPI Trend Page with Combo Charts – Two combo charts (MTD and YTD) display CY Actual, PY Actual, and Target across months. A KPI name slicer lets you drill into any single metric instantly.
🔹 Drill-Through KPI Definition Page – Right-click any KPI row and drill through to its formula, definition, unit of measure, and LTB/UTB classification. A back button returns you to the Summary page.
🔹 Excel-Driven Data Entry – Fill three worksheets: Input_Actual (KPI name, month, MTD actual, YTD actual), Input_Target (same structure for targets), and KPI Definition (KPI number, group, name, unit, formula, definition, type).
📦 What’s Inside the Supplier Performance KPI Dashboard in Power BI
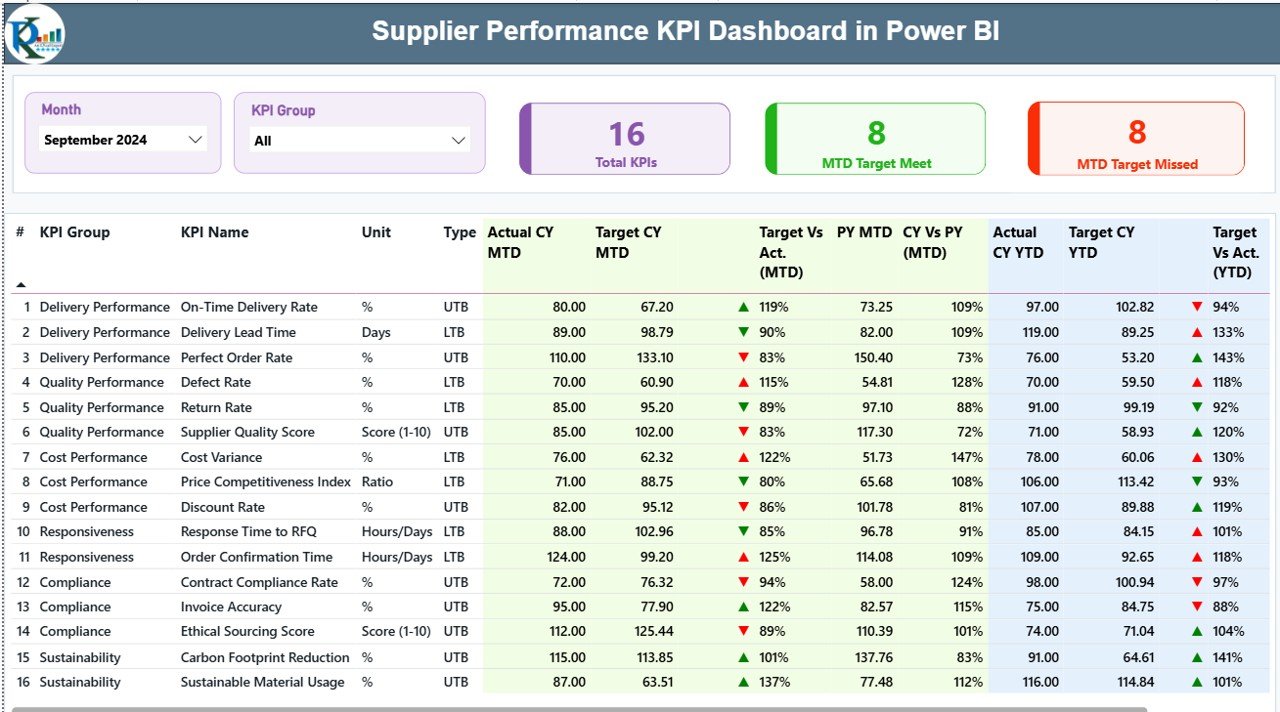
Summary Page – 18-column KPI table with MTD/YTD actuals, targets, and LTB/UTB status icons
📄 Page 1 – Summary: Month and KPI Group slicers at top, 3 header KPI cards, and the full 18-column performance table showing MTD and YTD metrics for every supplier KPI.

KPI Trend Page – MTD and YTD combo charts showing CY Actual, PY Actual, and Target monthly
📈 Page 2 – KPI Trend: Two combo charts display monthly trend data for any selected KPI — current year actual, previous year actual, and target. Select any KPI from the left slicer to reload both MTD and YTD charts.

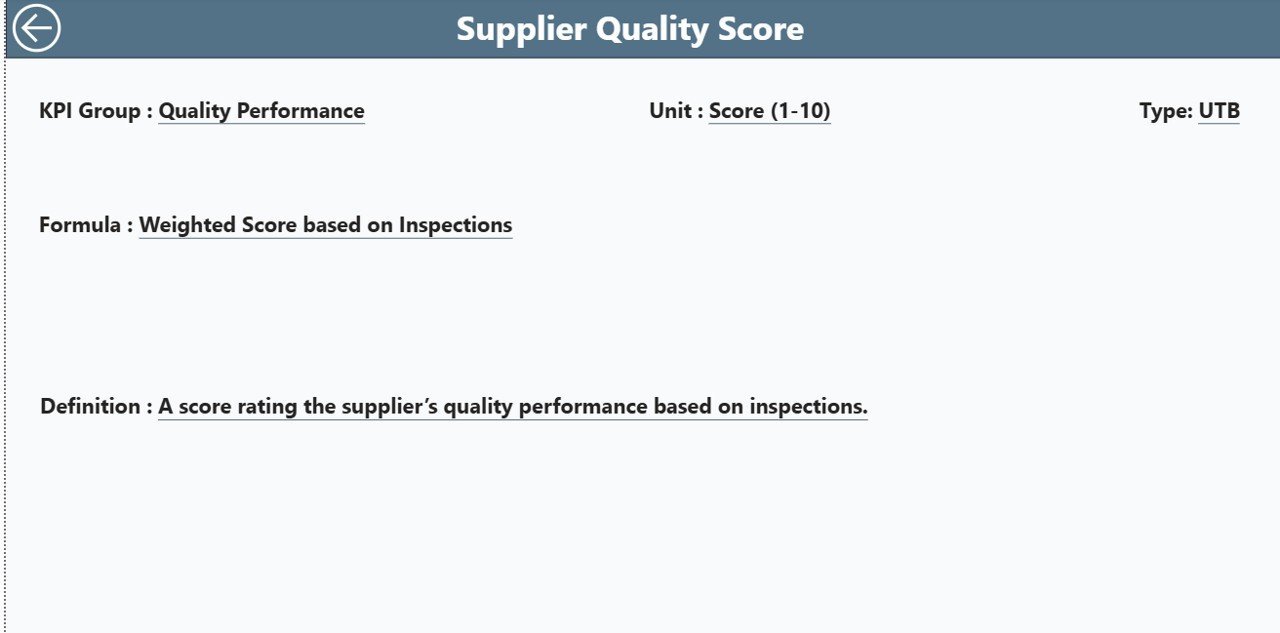
KPI Definition Page – Drill-through view showing formula, definition, and LTB/UTB classification
📋 Page 3 – KPI Definition (Hidden Drill-Through): Accessible from any Summary row via right-click drill-through. Shows KPI formula, description, unit, and type. Back button returns to Summary.
📊 Excel Source File — 3 Data Sheets:
🔹 Input_Actual – KPI name, month (first date of month), MTD actual, YTD actual.
🔹 Input_Target – Same structure for target values.
🔹 KPI Definition – KPI Number, Group, Name, Unit, Formula, Definition, and Type (LTB or UTB).
📊 Supplier Performance KPI Dashboard in Power BI vs. Tableau vs. SAP Ariba — Where This Fits
| Feature | Supplier Performance KPI Dashboard in Power BI | Tableau KPI View | SAP Ariba / Jaggaer |
|---|---|---|---|
| Cost | $11.99 one-time | $70/user/month | $5,000–$50,000/year |
| Platform | Power BI Desktop (free) | Tableau Desktop (paid) | Cloud SaaS only |
| Setup time | Under 15 minutes | Hours of data modeling | Weeks of implementation |
| MTD + YTD tracking | ✅ Built-in | Requires custom calc | ✅ Native |
| LTB/UTB logic | ✅ Pre-built rules | Manual configuration | ✅ Native |
| Drill-through KPI detail | ✅ One right-click | ✅ Available | ✅ Available |
| Excel data entry (no Power BI edit) | ✅ | ❌ | ❌ |
| Year-1 cost at 5 users | $11.99 total | $4,200+ | $20,000+ |
| No subscription required | ✅ | ❌ | ❌ |
For procurement teams that need structured supplier KPI visibility without enterprise software costs, this Power BI template sits in the sweet spot.
👥 Who This Template Is For — and Who It’s Not For
✅ This template is built for:
- Procurement managers tracking 10–50 supplier KPIs monthly
- Supply chain analysts who need MTD and YTD comparisons with prior-year data
- Operations teams presenting supplier performance in leadership reviews
- Small to mid-sized manufacturers managing a lean supplier base in Power BI
- Power BI users who want a ready-to-use KPI framework without building DAX from scratch
❌ This template is NOT for:
- Teams needing live ERP integration — this template uses Excel as the data source
- Organizations requiring automated supplier portal data feeds from third-party systems
- Enterprise teams needing multi-tenant SaaS with SSO and SOC 2 compliance
⚙️ How to Use the Supplier Performance KPI Dashboard in Power BI
- Download and unzip the file. Open the Excel data file and fill in the KPI Definition sheet with your KPI names, groups, formulas, and LTB/UTB types.
- Enter monthly actuals in Input_Actual — KPI name, first date of the month, MTD value, and YTD value per row.
- Enter targets in Input_Target using the same column structure.
- Open the .pbix file in Power BI Desktop and refresh the data source. All 3 pages auto-update.
- Use Month and KPI Group slicers on the Summary page to focus your analysis.
- Visit the KPI Trend page and select any KPI to view its monthly combo charts.
- Right-click any KPI row → Drill Through → KPI Definition to view its formula and classification.
💼 Real-World Use Cases
Ravi manages procurement at a mid-sized auto parts manufacturer. Every month he fills the Excel input sheets with delivery accuracy, defect rates, and lead times for 24 suppliers. The Power BI dashboard automatically flags which KPIs missed targets using red ▼ icons — saving 4 hours of manual analysis before the monthly operations review.
Priya is a supply chain consultant supporting 3 FMCG clients. She maintains one template per client, renaming KPI groups for each industry. The drill-through KPI Definition page lets her explain exactly how each metric is calculated during client presentations — without switching tools.
A logistics company’s operations team tracks 15 carrier KPIs including on-time delivery rate, damage claims, and invoice accuracy. The Year-over-Year columns let the VP of Operations compare current carrier performance against the same period last year in under 30 seconds.
❓ Frequently Asked Questions
How many KPIs can the Supplier Performance KPI Dashboard in Power BI track?
There is no hard KPI limit — you define your own KPIs in the Excel KPI Definition sheet. The dashboard handles dozens of KPIs across multiple groups, with a KPI Group slicer to filter by category and avoid visual overload.
What is LTB and UTB in this dashboard?
LTB (Lower the Better) applies to metrics like defect rate or lead time where lower values indicate better performance. UTB (Upper the Better) applies to metrics like on-time delivery % where higher is better. The dashboard auto-applies the correct green/red icon logic based on the type you assign in the KPI Definition sheet.
Do I need Power BI Pro to use this template?
No. The Supplier Performance KPI Dashboard in Power BI works entirely in Power BI Desktop, which is free to download from Microsoft. Power BI Pro is only needed for publishing to the Power BI Service cloud — desktop use requires no license or subscription.
How is this different from SAP Ariba or a procurement SaaS tool?
SAP Ariba costs $5,000–$50,000 per year and requires weeks of implementation. This Power BI template costs $11.99 one-time, connects to an Excel file you control, and is ready in under 15 minutes with no IT involvement, no contracts, and no subscriptions.
Can I customize the KPI names and groups?
Yes, fully. All KPI names, groups, formulas, units, and LTB/UTB types are defined in the Excel KPI Definition sheet. Update those entries and re-enter data in the Input sheets — no Power BI editing or DAX knowledge required at any point.
How do I access the KPI Definition drill-through page?
The KPI Definition page is intentionally hidden to keep the main report clean. Right-click any row in the Summary table, select Drill Through → KPI Definition. The page opens with full formula and classification details. The back button in the top-left corner returns you to Summary.
What files are included in the download?
The download includes one Power BI .pbix file and one Excel .xlsx data file with 3 pre-structured input sheets. Fill the Excel file first, then open the .pbix in Power BI Desktop and refresh to populate all 3 dashboard pages automatically.
👤 About the Author
Built by PK — Microsoft Certified Professional with 15+ years of Excel, Google Sheets, and Power BI experience. Founder of NextGenTemplates, reaching 300K+ subscribers across YouTube channels (@PK-AnExcelExpert, @NextGenTemplates, @NeoTechNavigators). Every template is hand-built and tested before release.
🔗 Explore Related Templates
🔹 Supplier Feedback Tracker in Excel — Record and analyze qualitative supplier feedback with structured Excel-based tracking.
🔹 Supply Chain Procurement Dashboard in Google Sheets — Monitor procurement pipelines, PO status, and vendor spend in Google Sheets.
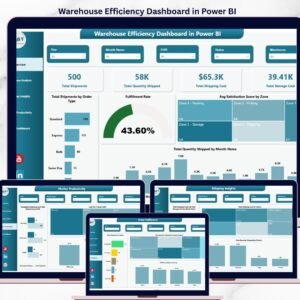
🔹 Warehouse Efficiency Dashboard in Power BI — Track warehouse throughput, utilization, and accuracy KPIs in the same Power BI environment.
Browse all Power BI KPI Dashboard Templates or explore the complete Power BI Templates collection.
📖 Click here to read the Detailed Blog Post
🎥 Visit our YouTube channel for step-by-step video tutorials
👉 YouTube.com/@NextGenTemplates
📅 Last updated: May 2026


Reviews
There are no reviews yet.