
The Regulatory Reporting KPI Dashboard in Power BI tracks your full KPI set across 3 interactive Power BI pages, with MTD and YTD performance, Target vs. Actual variance, and Current Year vs. Previous Year comparisons driven from a single Excel data source. Setup takes under 10 minutes — fill the 3 input sheets (Actual, Target, KPI Definition) and every visual, card, and drill-through updates automatically.
🌍 Join 8,400+ teams in 40+ countries using NextGenTemplates to replace paid SaaS tools with one-time-purchase Excel, Google Sheets, Power BI, and HTML templates.
✅ Instant download · One-time payment · No subscription · No per-user fees · Lifetime access
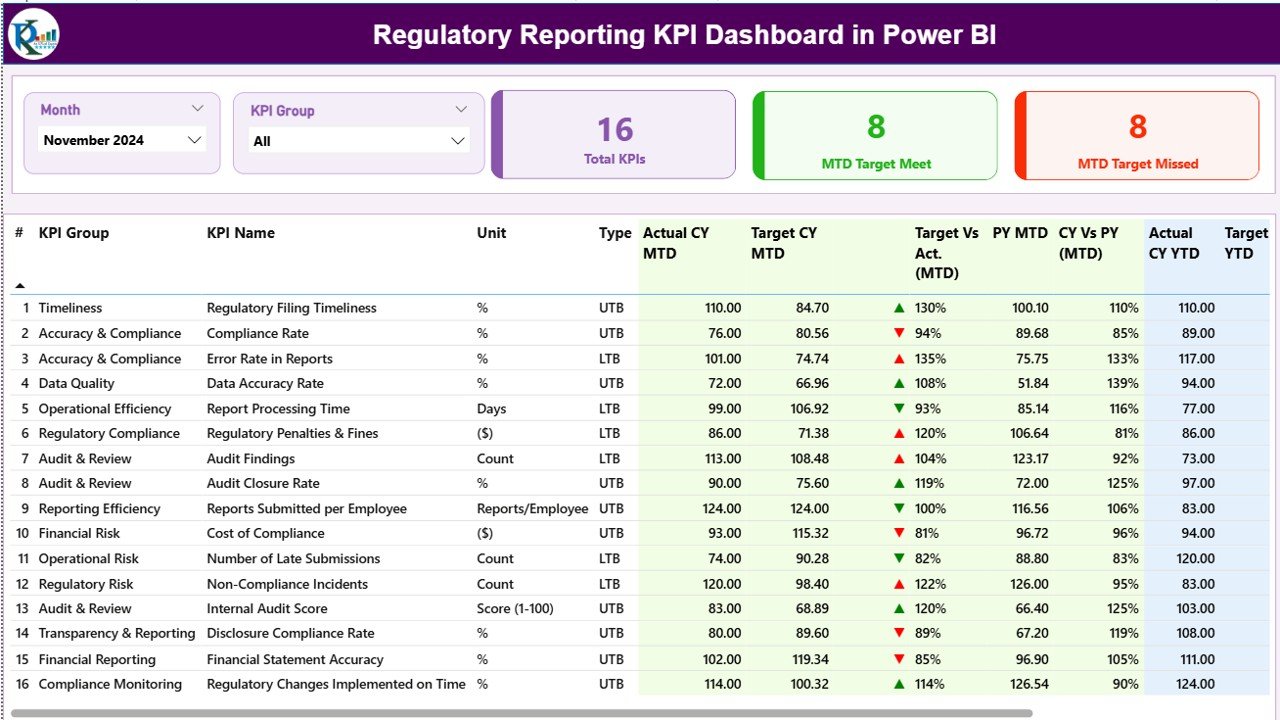
Summary Page — KPI table with MTD, YTD, Target vs. Actual, and PY comparison
🔑 Key Features of Regulatory Reporting KPI Dashboard in Power BI
📌 3-Page Power BI Report Structure – The dashboard is built across 3 dedicated pages in a .pbix file: a Summary Page for the full KPI scoreboard, a KPI Trend page for historical comparison, and a hidden KPI Definition drill-through page. Every page reads from the same Excel source, so one data refresh updates all three views.
📌 Month & KPI Group Slicers – Two slicers sit at the top of the Summary Page — Month and KPI Group — so regulatory, compliance, audit, and filing KPIs can be reviewed in isolation or as a full set. Changing either slicer recalculates the 3 summary cards and the detailed table instantly.
📌 Target Vs. Actual Direction Icons – Each KPI row shows ▲ green or ▼ red icons for both MTD and YTD performance, following each KPI’s Type field (LTB — Lower the Better, or UTB — Upper the Better). You see at a glance whether a regulatory filing metric is trending the right way without reading the numbers.
📌 MTD & YTD Variance Percentages – The table calculates Target vs. Actual % (Actual/Target) for both MTD and YTD and Current Year vs. Previous Year % (CY/PY) for MTD and YTD. That gives regulatory teams four performance lenses on every KPI from one row.
📌 Drill-Through to KPI Definition – Right-click any KPI on the Summary Page and drill through to the hidden KPI Definition page to see the KPI number, group, formula, unit, and full definition. A back button in the top-left corner returns you to the Summary Page.
📌 KPI Trend Combo Charts – The KPI Trend page displays two combo charts plotting Actual CY, Actual PY, and Target values across months for both MTD and YTD. A KPI Name slicer on the left lets you switch the trend view KPI by KPI without leaving the page.
📌 Excel-Based Data Model – The dashboard pulls from a single Excel file with 3 input sheets: Input_Actual (KPI Name, Month, MTD, YTD), Input_Target (same structure), and KPI Definition (KPI Number, Group, Name, Unit, Formula, Definition, Type). Replace sample rows with your own regulatory KPIs and refresh.
📦 What’s Inside the Regulatory Reporting KPI Dashboard in Power BI
The .pbix file contains 3 pages with the following structure:
📄 Page 1 — Summary Page: Month slicer, KPI Group slicer, Total KPIs card, MTD Target Met card, MTD Target Missed card, and the full KPI scoreboard table with columns for KPI Number, KPI Group, KPI Name, Unit, Type, Actual CY MTD, Target CY MTD, MTD Icon, Target Vs. Act. (MTD), PY MTD, CY Vs. PY (MTD), Actual CY YTD, Target CY YTD, YTD Icon, Target Vs. Act. (YTD), PY YTD, CY Vs. PY (YTD).
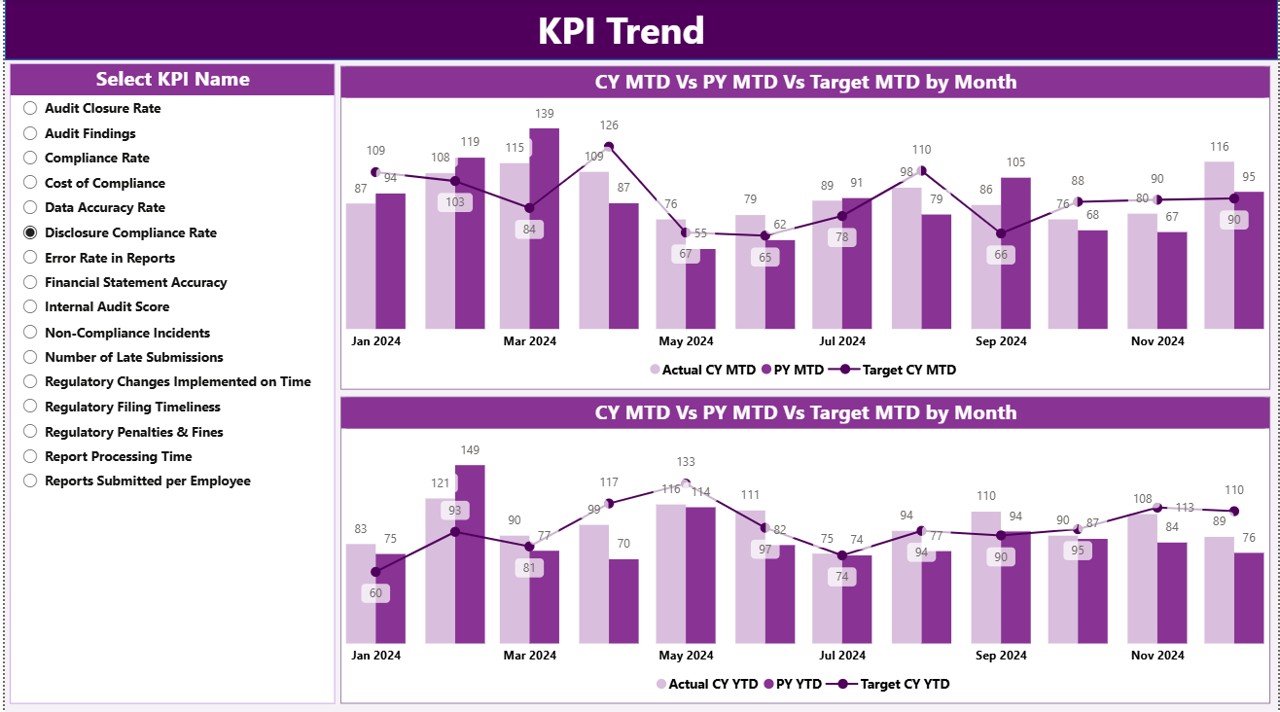
KPI Trend Page — MTD & YTD combo charts with KPI Name slicer
📄 Page 2 — KPI Trend: KPI Name slicer on the left, plus two combo charts: one showing Actual CY vs. Actual PY vs. Target for MTD, and one showing the same three series for YTD.
📄 Page 3 — KPI Definition (hidden drill-through): Displays the KPI number, group, name, unit, formula, definition, and type. Accessible only by right-clicking a KPI on the Summary Page. Use the back button at the top-left corner to return.
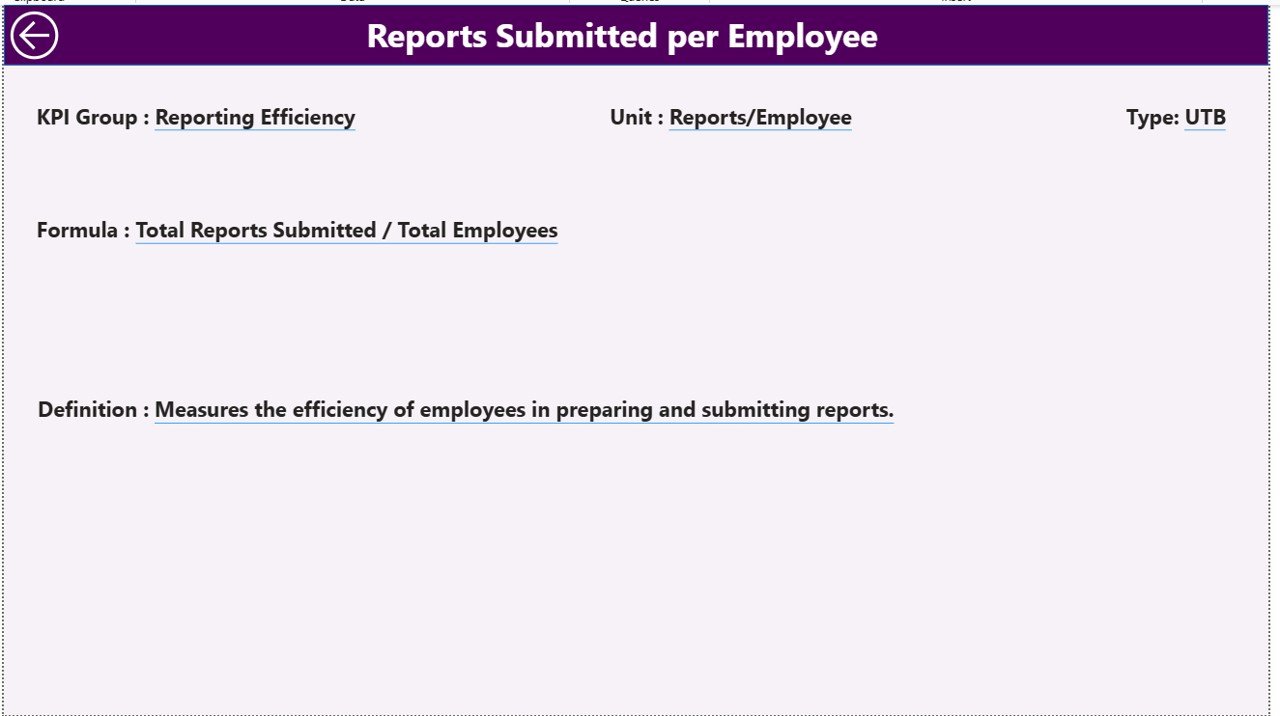
KPI Definition Page — hidden drill-through with KPI details and formulas
📊 Regulatory Reporting KPI Dashboard in Power BI vs. Tableau / Qlik vs. Paid GRC SaaS — Where This Fits
| Feature | Regulatory Reporting KPI Dashboard in Power BI | Tableau / Qlik Alternative | Paid GRC SaaS (MetricStream / LogicGate / AuditBoard) |
|---|---|---|---|
| Cost | $11.99 one-time | $70+ / user / month (Tableau Creator) | $30,000–$150,000 / year |
| Platform | Power BI Desktop (free) + Excel | Tableau Desktop or Qlik Sense | Proprietary web SaaS |
| Setup time | Under 10 minutes ✅ | 2–4 hours (data model + visuals) | 4–12 weeks implementation |
| MTD + YTD + Target + PY on one row | Built-in ✅ | Custom calculated fields required | Yes (module-dependent) |
| Drill-through to KPI Definition | Built-in ✅ | Manual configuration | Yes |
| LTB / UTB direction logic | Pre-configured ✅ | Custom DAX / expressions | Configurable |
| Excel-based input (easy for compliance teams) | Yes ✅ | Possible but clunky | Proprietary forms only |
| Year-1 cost at 5 users | $11.99 | $4,200+ | $30,000–$150,000+ |
| Lifetime access, no subscription | Yes ✅ | Subscription only | Subscription only |
For compliance and regulatory reporting teams that want MTD/YTD KPI visibility without paying six figures a year for a full GRC platform, the Regulatory Reporting KPI Dashboard in Power BI sits in the sweet spot — enterprise-grade logic, Excel-level simplicity.
👥 Who This Template Is For — and Who It’s Not For
✅ This template is built for:
- Compliance and regulatory reporting managers at banks, NBFCs, insurance firms, pharma companies, and fintech scale-ups who need monthly KPI visibility
- Internal audit teams tracking regulatory filings, SLA adherence, breach counts, and remediation timelines
- Risk & Compliance analysts who already live in Excel and want a polished Power BI layer on top of their existing data
- Consultants building regulatory scorecards for clients without the budget for MetricStream or AuditBoard
❌ This template is NOT for:
- Teams needing SOC 2 Type II, full audit trails, or regulator-submitted reporting workflows — use a GRC platform
- Organizations requiring real-time API feeds from GRC systems or case-management tools
- Users who have never opened Power BI Desktop — the free install is required
⚙️ How to Use the Regulatory Reporting KPI Dashboard in Power BI
- Download the zip file and extract both the .pbix file and the Excel data source into the same folder.
- Open the Excel file and fill the KPI Definition sheet with your KPI Number, Group, Name, Unit, Formula, Definition, and Type (LTB or UTB).
- Fill Input_Actual with KPI Name, Month (first date of month), MTD number, and YTD number for each period.
- Fill Input_Target with the same structure, using your target numbers instead of actuals.
- Open the .pbix file in Power BI Desktop (free from Microsoft), click Refresh, and the Summary, KPI Trend, and KPI Definition pages update automatically.
- Use the Month and KPI Group slicers on the Summary Page to filter, and right-click any KPI to drill through to its definition.
💼 Real-World Use Cases
Anjali leads regulatory reporting at a mid-size NBFC. She maintains 22 KPIs spanning RBI filings, KYC compliance, and audit observations. Every month she fills the 3 Excel input sheets with fresh actuals and targets, refreshes the .pbix file, and takes a single-page Summary snapshot to the monthly compliance committee — replacing a 14-tab Excel tracker and avoiding a $42,000 GRC subscription.
Daniel is an internal audit manager at a regional bank. He tracks SLA-based KPIs — audit closure time, finding age, regulatory deadline adherence — using LTB/UTB direction icons built into the template. When his CAE asks for a trend view, he switches to the KPI Trend page, picks the KPI from the slicer, and shares the visual directly without rebuilding a chart.
Priya is a Big 4 consultant building a compliance dashboard for a pharma client. She customizes the Excel definition sheet with 28 GxP and FDA-related KPIs, keeps the Power BI logic untouched, and delivers a polished drill-through dashboard in a single engagement week — billable work her client can keep using long after the project ends.
❓ Frequently Asked Questions
What KPIs does the Regulatory Reporting KPI Dashboard in Power BI track?
The Regulatory Reporting KPI Dashboard in Power BI tracks any KPI you define in the Excel KPI Definition sheet — typical examples include regulatory filing on-time rate, KYC completeness, audit observation closure rate, incident breach count, and SLA adherence percentage. Every KPI shows MTD and YTD actual, target, and previous-year comparison automatically.
Do I need a Power BI Pro license to use this dashboard?
No. The Regulatory Reporting KPI Dashboard in Power BI runs entirely in the free Power BI Desktop application on Windows. You only need a Pro license if you want to publish the report to the Power BI Service and share it with other users inside your organization.
How long does setup take?
Setup for the Regulatory Reporting KPI Dashboard in Power BI takes under 10 minutes if your KPI list and monthly numbers are already in a spreadsheet. Replace sample rows in the 3 Excel input sheets, save the file, click Refresh in Power BI Desktop, and the dashboard updates end-to-end.
How does this compare to AuditBoard or MetricStream?
AuditBoard and MetricStream are full GRC platforms priced at $30,000–$150,000 per year and built for enterprise audit workflows. The Regulatory Reporting KPI Dashboard in Power BI costs $11.99 one-time and focuses purely on KPI visibility — ideal when you need the dashboarding without the heavy GRC workflow engine.
Can I add more KPIs to the dashboard?
Yes. Add new rows to the Input_Actual, Input_Target, and KPI Definition sheets in Excel, save the file, and click Refresh in Power BI Desktop. The Regulatory Reporting KPI Dashboard in Power BI scales without any DAX or visual edits — the slicers and tables automatically pick up new KPIs and KPI groups.
Does the dashboard support LTB and UTB KPI logic?
Yes. The KPI Definition sheet has a Type column where you tag each KPI as LTB (Lower the Better — e.g., breach count) or UTB (Upper the Better — e.g., filing on-time rate). The Regulatory Reporting KPI Dashboard in Power BI uses this flag to show the correct red or green direction icon automatically.
👤 About the Author
Built by PK — Microsoft Certified Professional with 15+ years of Excel, Google Sheets, and Power BI experience. Founder of NextGenTemplates, reaching 300K+ subscribers across YouTube channels (@PK-AnExcelExpert, @NextGenTemplates, @NeoTechNavigators). Every template is hand-built and tested before release.
🔗 Explore Related Templates
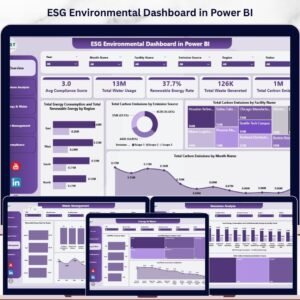
📌 ESG Environmental Dashboard in Power BI — MTD/YTD KPI tracking for sustainability and environmental reporting.
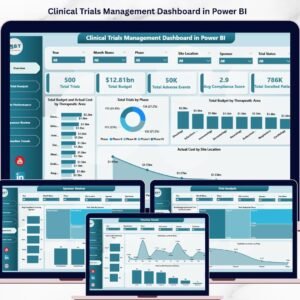
📌 Clinical Trials Management Dashboard in Power BI — regulatory-style KPI tracking for life-sciences teams.
📌 Compliance Tracking Dashboard in HTML — browser-based alternative for compliance KPIs.
📌 Tax Compliance KPI Dashboard in Google Sheets — Google Sheets alternative for compliance-KPI visibility.
📌 Browse more in Power BI Dashboard Templates and Excel Dashboard Templates.
📖 Click here to read the Detailed Blog Post
🎥 Visit our YouTube channel for step-by-step video tutorials
👉 YouTube.com/@NextGenTemplates
📅 Last updated: April 2026


Reviews
There are no reviews yet.