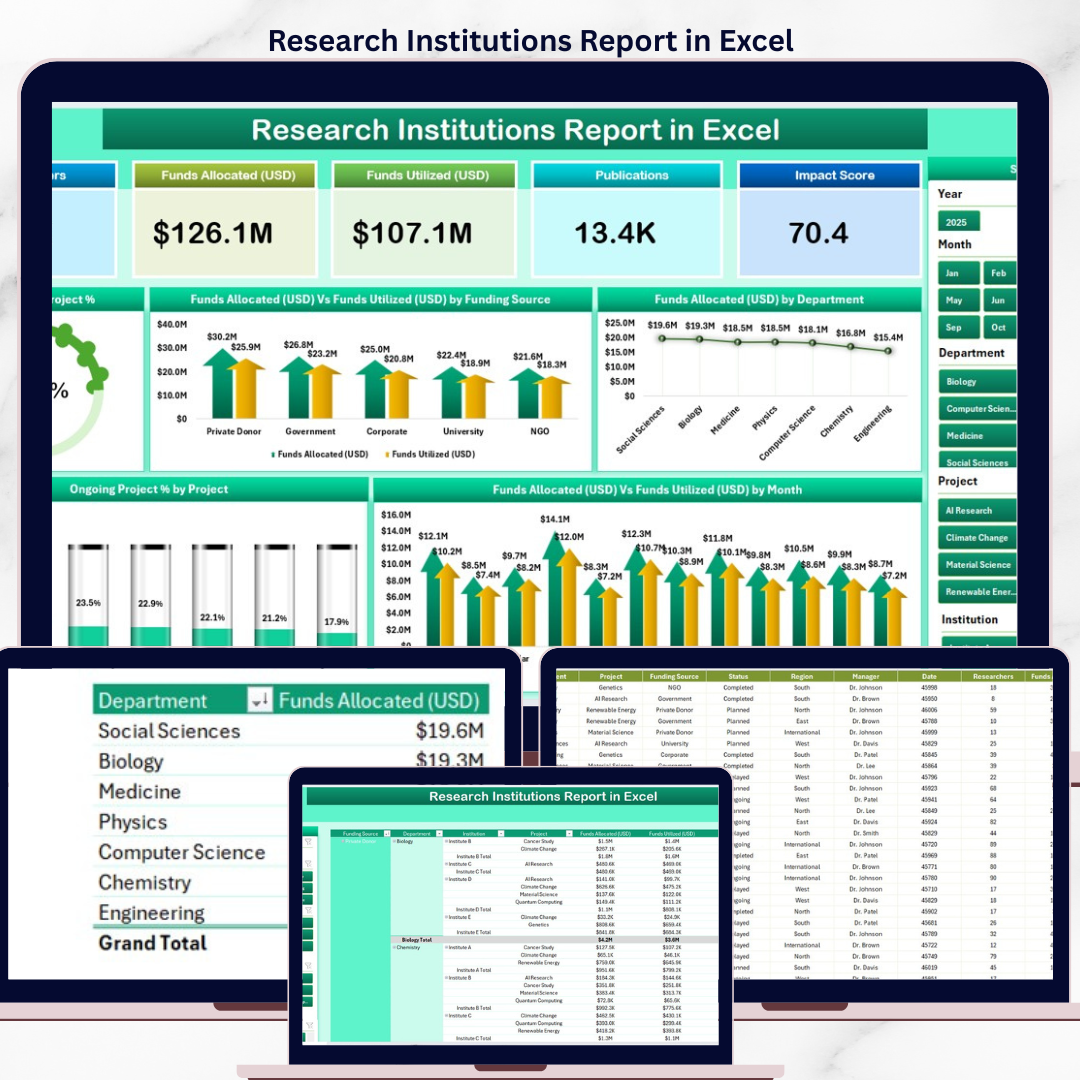
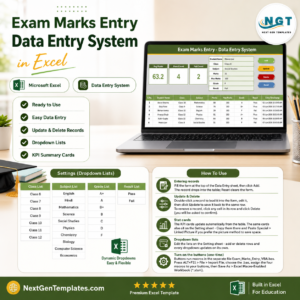
The Research Institutions Report in Excel consolidates 4 working sheets, 5 KPI cards, and 5 interactive charts into a single Excel workbook that tracks completed projects, ongoing projects, funds allocated, and funds untied across every department and funding source. Setup takes under 10 minutes — replace the sample records on the Data sheet, and every chart, slicer, and KPI card on the Summary and Report pages refreshes automatically.
🌍 Join 8,400+ teams in 40+ countries using NextGenTemplates to replace paid SaaS reporting tools with one-time-purchase Excel, Google Sheets, Power BI, and HTML templates.
✅ Instant download · One-time payment · No subscription · No per-user fees · Lifetime access
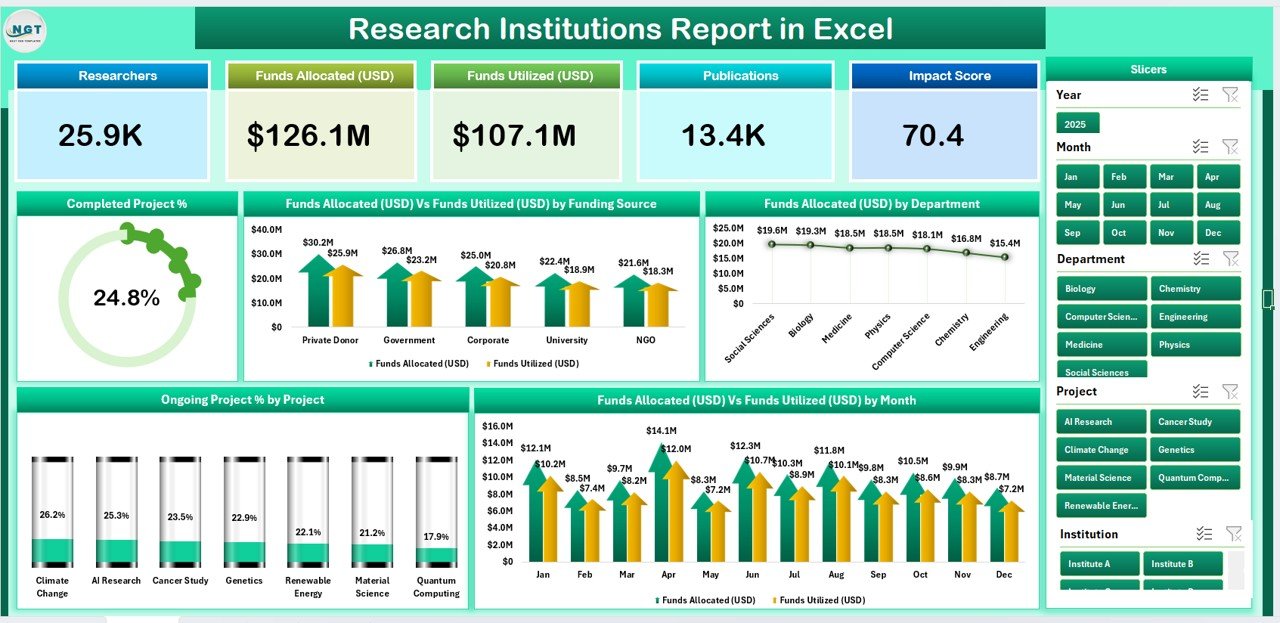
Summary page — 5 KPI cards, slicer, and 5 charts covering project status and funding
🔑 Key Features of the Research Institutions Report in Excel
📊 4 working sheets in one workbook — a Summary page for executives, a Report page for project-by-project deep dives, a Data sheet for raw entries, and a Support sheet for dropdown lists. Every page links to the same dataset, so a single edit propagates everywhere.
📌 5 KPI cards on the Summary page covering total projects, completed projects, ongoing projects, total funds allocated, and total funds untied. Each card uses simple SUMIFS formulas — no macros, no add-ins, nothing that breaks when the file is emailed.
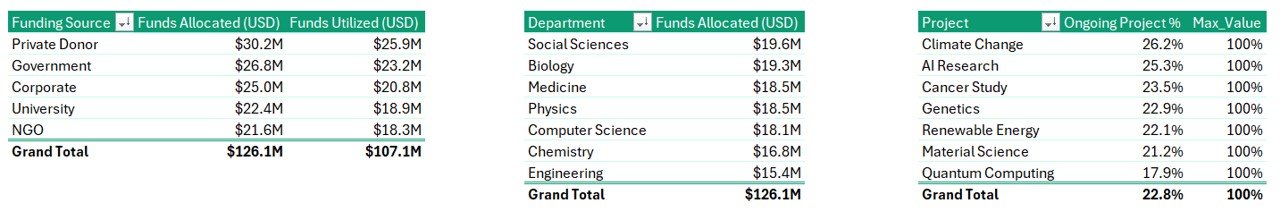
📈 5 pre-built charts — Completed Project %, Funds Allocated vs. Funds Untied by Funding Source, Funds Allocated by Department, Ongoing Project % by Project, and Funds Allocated vs. Funds Untied by Month. The charts are pivot-driven and rebuild themselves when new rows hit the Data sheet.
🎛️ Slicer-based filtering — the Summary page hosts a right-side slicer; the Report page hosts a left-side slicer. Click any value (department, funding source, status) and every visible chart, KPI, and table responds instantly.
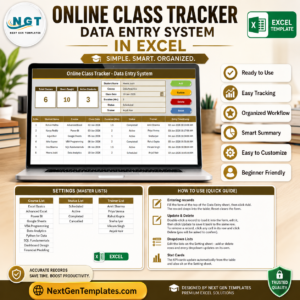
📋 Detailed Information Table on the Report page showing project name, status, funding source, department, allocated amount, untied amount, start date, and progress, all filterable from the same slicer that drives the page.
🧮 No VBA, no add-ins, no setup wizard — opens in Microsoft Excel 2016 onward, including Microsoft 365. Works with Excel for Windows, Excel for Mac, and Excel Online for read-only review.
📦 What’s Inside the Research Institutions Report in Excel
📍 Page 1 — Summary Page: 5 KPI cards anchored at the top, a vertical slicer running down the right side, and a 5-chart grid covering Completed Project %, Funds Allocated vs. Funds Untied by Funding Source, Funds Allocated by Department, Ongoing Project % by Project, and Funds Allocated vs. Funds Untied by Month.
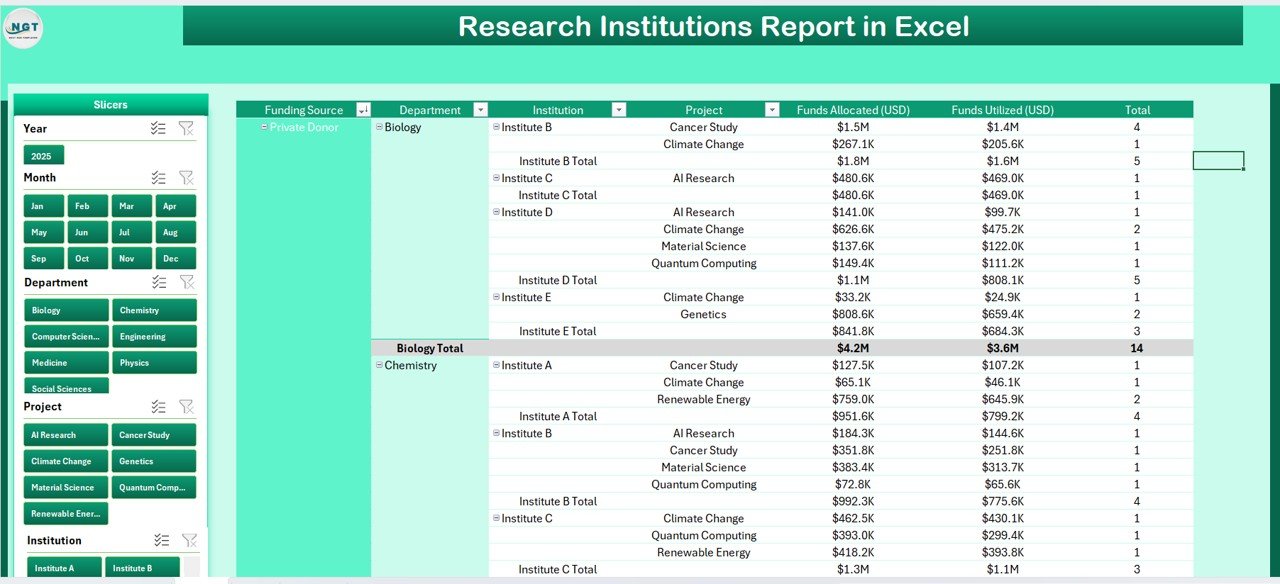
Report page — left-side slicer + project Information Table
📍 Page 2 — Report Page: A left-side slicer and a wide Information Table that reads every project record, with columns for project, department, funding source, allocated, untied, status, and dates. Filter the slicer to drill into any subset.
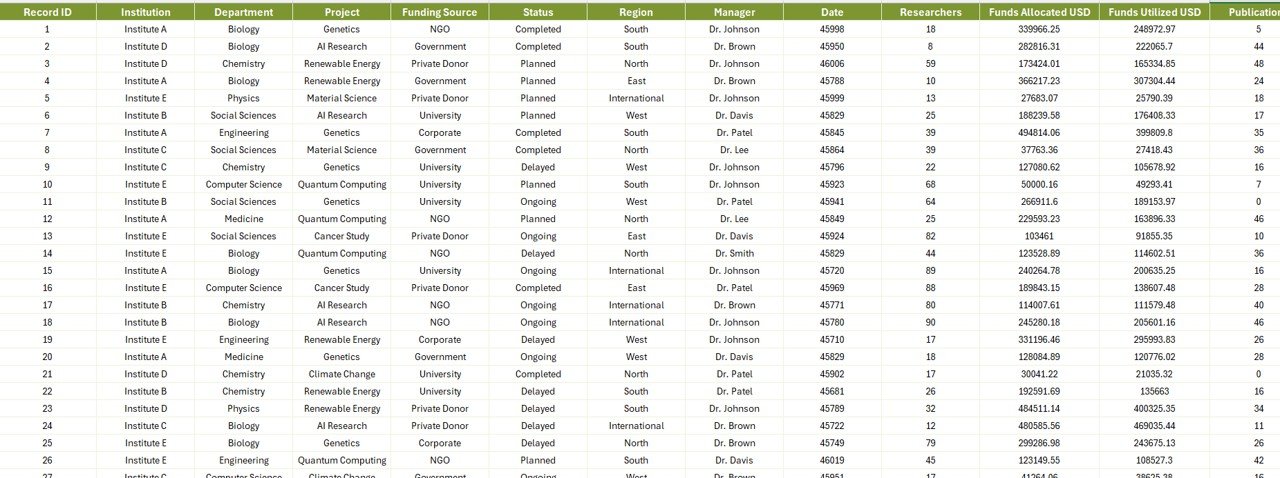
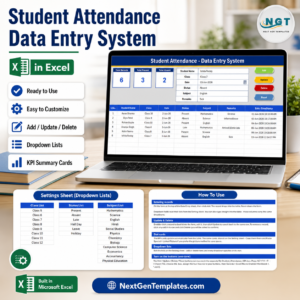
Data sheet — replace sample rows with your own project records
📍 Page 3 — Data Sheet: The single source of truth. Add, edit, or delete project rows here and every visual refreshes after a quick Refresh All. Pre-populated with sample data so you can see formulas work before you replace them.
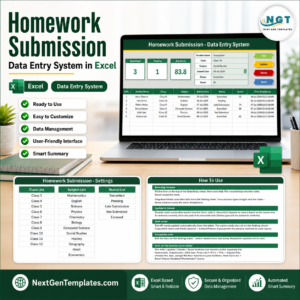
Support sheet — dropdown lists for departments, funding sources, and project status
📍 Page 4 — Support Sheet: Holds the dropdown lists used by the Data sheet — departments, funding sources, project statuses. Edit this once and every Data sheet validation updates.
📊 Research Institutions Report in Excel vs. Google Sheets vs. Paid Research SaaS — Where This Fits
| Feature | Research Institutions Report in Excel | Google Sheets equivalent | Cayuse / InfoEd / Streamlyne |
|---|---|---|---|
| Cost | $7.99 one-time | Free, build from scratch | $15,000–$60,000 / year |
| Platform | Microsoft Excel 2016+ | Google Workspace | Web SaaS |
| Setup time | Under 10 minutes | 2–4 days to design | 3–6 month implementation |
| Slicer-based filtering | ✅ Native Excel slicers | ⚠️ Filter views only | ✅ Full filter engine |
| Offline access | ✅ Yes — local .xlsx file | ❌ Internet required | ❌ Cloud-only |
| Customizable fields | ✅ Add columns freely | ✅ Yes | ⚠️ Admin-only |
| Share with link | ✅ via OneDrive / SharePoint | ✅ Native | ✅ Per-user license |
| Year-1 cost at 5 users | $7.99 total | $0–$72 | $15,000+ |
| Pivot-driven charts | ✅ 5 pre-built | ⚠️ Build manually | ✅ Pre-configured |
For research offices that want clean project-and-funding visibility without paying for an enterprise grants management suite, the Research Institutions Report in Excel sits in the sweet spot.
👥 Who This Template Is For — and Who It’s Not For
✅ This template is built for:
- Research office managers at universities and research institutes tracking 20–500 active projects
- Principal investigators reporting funds allocated vs. funds untied to department heads
- Grants administrators preparing monthly or quarterly funding reports
- Independent labs and small research nonprofits replacing manual status sheets
❌ This template is NOT for:
- Federal agencies needing FAR/2 CFR 200 compliance workflows or e-signature audit trails
- Large institutions running 5,000+ active grants — that workload belongs in Cayuse or InfoEd
- Teams requiring real-time multi-user editing on the same workbook (use the Google Sheets version instead)
⚙️ How to Use the Research Institutions Report in Excel
- Download the .xlsx file and open it in Microsoft Excel 2016 or later.
- Open the Support sheet first and edit the department, funding source, and status lists to match your institution.
- Switch to the Data sheet and replace the sample project rows with your own records — keep the column order intact.
- Hit Data → Refresh All. The Summary KPI cards and all 5 charts update automatically.
- Use the right-side slicer on Summary or the left-side slicer on Report to filter by department, funding source, or status.
- Print or export the Report page as PDF for stakeholder reviews.
💼 Real-World Use Cases
Dr. Anjali runs the research office at a 200-faculty engineering institute. She uses the Research Institutions Report in Excel to consolidate 130 active projects across 8 departments and 5 funding sources, presenting a single Summary page to the dean every month — without paying $20,000/year for a hosted grants platform.
Marcus is a grants administrator at a mid-size biomedical nonprofit. Every quarter he refreshes the Data sheet with new awards and untied amounts, prints the Report page filtered by funding source, and sends the PDF to his board — replacing four Word documents and a manual pivot table he used to rebuild from scratch.
The finance team at a regional research foundation uses the template alongside their Project Budget Request Tracker in Excel to keep proposal pipeline and active-project funding in two synchronized workbooks, both refreshed before the monthly board meeting.
❓ Frequently Asked Questions
What metrics does the Research Institutions Report in Excel track?
The Research Institutions Report in Excel tracks 5 core KPIs — total projects, completed projects, ongoing projects, funds allocated, and funds untied — broken down by department, funding source, project, and month across 5 interactive charts on the Summary page.
How is this different from a regular Excel pivot table?
The Research Institutions Report in Excel ships with the pivot tables, slicers, KPI cards, and 5 charts already wired together on a clean Summary page and a separate Report page. You skip the 4–8 hours of pivot setup and start with a finished layout that matches what executives want to see.
How does this compare to Cayuse or InfoEd?
Cayuse and InfoEd are full grants management platforms running $15,000–$60,000 per year. The Research Institutions Report in Excel is a $7.99 one-time download focused on the reporting layer — projects, departments, funding sources, allocated vs. untied — without the proposal workflow, e-signatures, or compliance modules.
How long does setup take?
Setup takes under 10 minutes. Open the Support sheet, edit the dropdown lists for your institution, paste your project records into the Data sheet, then click Data → Refresh All. The Summary KPIs and 5 charts populate immediately.
Do I need VBA or macros enabled?
No. The Research Institutions Report in Excel is built entirely with native Excel formulas, pivot tables, slicers, and charts. Macros are not required and the file is not a .xlsm — it opens cleanly in any locked-down corporate Excel environment.
Can I add my own departments and funding sources?
Yes. Open the Support sheet and edit the lists. The Data sheet’s drop-down validations read directly from the Support sheet, so any new department or funding source you add becomes available across the workbook on the next Refresh All.
Does the file work in Excel for Mac and Excel Online?
The Research Institutions Report in Excel runs in Excel for Mac 2016+ with full slicer support. Excel Online opens the file for read-only review and basic edits, but slicer interactions are best experienced in the desktop application.
👤 About the Author
Built by PK — Microsoft Certified Professional with 15+ years of Excel, Google Sheets, and Power BI experience. Founder of NextGenTemplates, reaching 300K+ subscribers across YouTube channels (@PK-AnExcelExpert, @NextGenTemplates, @NeoTechNavigators). Every template is hand-built and tested before release.
🔗 Explore Related Templates
- 📘 Open Universities KPI Dashboard in Excel — KPI-focused dashboard for open and distance learning institutions
- 🎓 Colleges & Universities Dashboard in Excel — broader academic-institution analytics across enrolment, faculty, and finance
- 📅 Grant Proposal Submission Calendar in Excel — pairs perfectly with this Report to track upstream proposal pipeline
- 💵 Project Budget Request Tracker in Excel — request-side companion to the funding-allocation view
- 📂 Browse all Excel Dashboard Templates or jump into Education Templates for more institution-ready files.
📖 Click here to read the Detailed Blog Post
🎥 Visit our YouTube channel for step-by-step video tutorials
👉 YouTube.com/@NextGenTemplates
📅 Last updated: May 2026


Reviews
There are no reviews yet.