


In today’s data-driven education landscape, success depends on real-time insights. The Education Services Dashboard in Excel is a ready-to-use, interactive reporting solution designed to help universities, colleges, and training institutes track academic and financial performance with ease. 🎓💡
This dynamic dashboard consolidates critical KPIs — such as student enrollment, graduation rate, revenue, expenses, and accreditation scores — into one visual platform. Built entirely in Microsoft Excel, it offers a professional, cost-effective, and user-friendly way to transform raw data into actionable insights.
🎯 Key Features of Education Services Dashboard in Excel
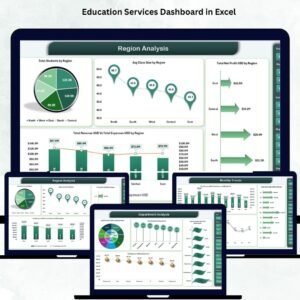
✨ Comprehensive Overview Page: Get a snapshot of institutional performance with cards displaying Total Students, Average Accreditation Score, Total Revenue, Total Expenses, and Net Profit (USD).
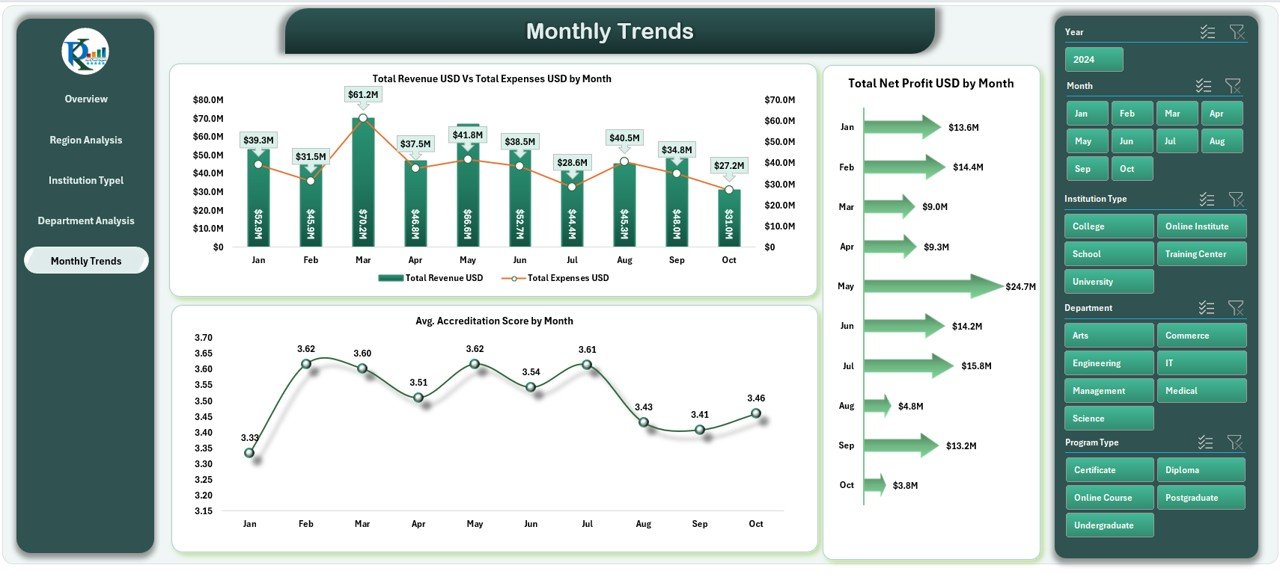
📊 Interactive Visuals: Analyze trends using dynamic charts for revenue vs. expenses, student satisfaction, graduation rates, and regional distribution.
🎛️ Smart Navigation Panel: Easily switch between analytical views such as Overview, Region, Institution Type, Department, and Monthly Trends.
📈 Automated KPI Updates: Data-driven formulas and Excel charts update automatically as new information is entered.
🧮 Data Accuracy and Transparency: Promote accountability and efficiency by centralizing academic and financial metrics in one file.
💰 Cost-Effective and Accessible: No need for complex BI tools—this Excel-based solution delivers enterprise-level analytics at a fraction of the cost.

📂 What’s Inside the Education Services Dashboard in Excel
Inside this digital product, you’ll find everything you need to manage and visualize educational data effectively:
-
Overview Sheet Tab: Institutional performance cards and visuals for total students, revenue, and satisfaction levels.
-
Region Analysis Sheet: Evaluate academic and financial outcomes by region.
-
Institution Type Analysis Sheet: Compare performance across universities, colleges, and training centers.
-
Department Analysis Sheet: Review placement rates, student distribution, and department-level expenses.
-
Monthly Trends Sheet: Monitor growth trends, monthly revenue, and accreditation scores over time.
-
Data Sheet Tab: The foundation of your dashboard, containing all raw data and formulas for automated reporting.
Each sheet is pre-designed with charts, slicers, and color-coded visuals that make it easy to understand institutional performance at a glance. 📘📊
⚙️ How to Use the Education Services Dashboard in Excel
1️⃣ Input Your Data: Enter your student, revenue, and expense data in the Data Sheet.
2️⃣ Select Filters: Use dropdowns and slicers to filter by region, program, or institution type.
3️⃣ View Instant Results: Watch KPIs and charts update automatically.
4️⃣ Analyze Performance: Identify top-performing regions, departments, and programs.
5️⃣ Share Reports: Export visuals as PDF or present them directly in Excel during reviews.
No coding or advanced Excel skills are required — just plug in your data and start analyzing instantly! ⚡
👩🏫 Who Can Benefit from This Education Services Dashboard
🎓 University Administrators: Track institutional KPIs and ensure academic excellence.
🏢 Finance & Operations Teams: Monitor revenue, expenses, and profitability in real time.
👩💼 Department Heads: Assess departmental performance, placement rates, and student success.
💻 Education Consultants: Present insights and analytics to clients using professional visuals.
📚 Training Institutes & EdTech Platforms: Manage enrollment, satisfaction, and retention metrics easily.
This dashboard is a perfect blend of functionality, visualization, and simplicity — making it an essential tool for any educational organization aiming for excellence. 🌟


Reviews
There are no reviews yet.