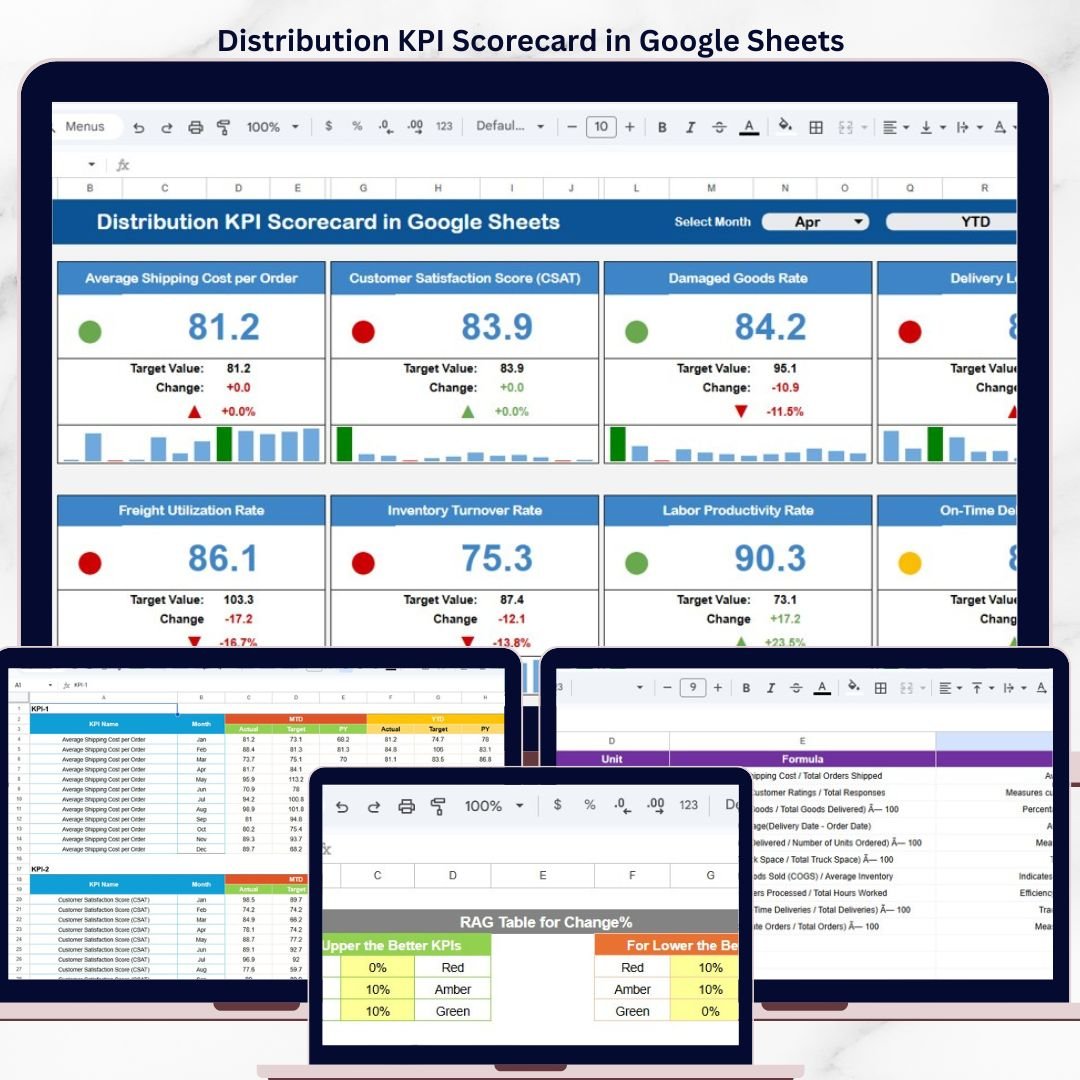


The Distribution KPI Scorecard in Google Sheets tracks 10+ distribution KPIs across 4 structured worksheets, with MTD and YTD trend charts, color-coded performance indicators, and dropdown-driven filtering. Setup takes under 10 minutes — just replace the sample data and every metric updates automatically.
🌍 Join 8,400+ teams in 40+ countries using NextGenTemplates to replace paid SaaS tools with one-time-purchase Excel, Google Sheets, Power BI, and HTML templates.
✅ Instant download · One-time payment · No subscription · No per-user fees · Lifetime access
🔑 Key Features of Distribution KPI Scorecard in Google Sheets
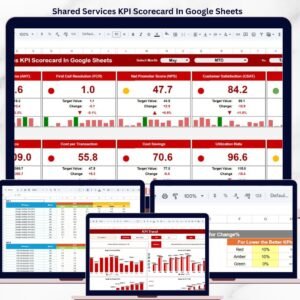
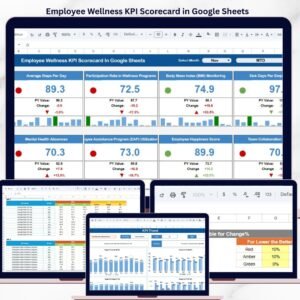
📊 Scorecard Sheet (Main Interface) — The Distribution KPI Scorecard in Google Sheets displays all KPI performance in a single view. Select the month, MTD (Month-to-Date), or YTD (Year-to-Date) using dropdown menus. Compare actual values against targets with color-coded visual indicators that flag underperforming metrics instantly. This scorecard tracks distribution-specific KPIs including on-time delivery rate, order fill rate, distribution cost per unit, warehouse utilization, fleet efficiency, and returns processing time.
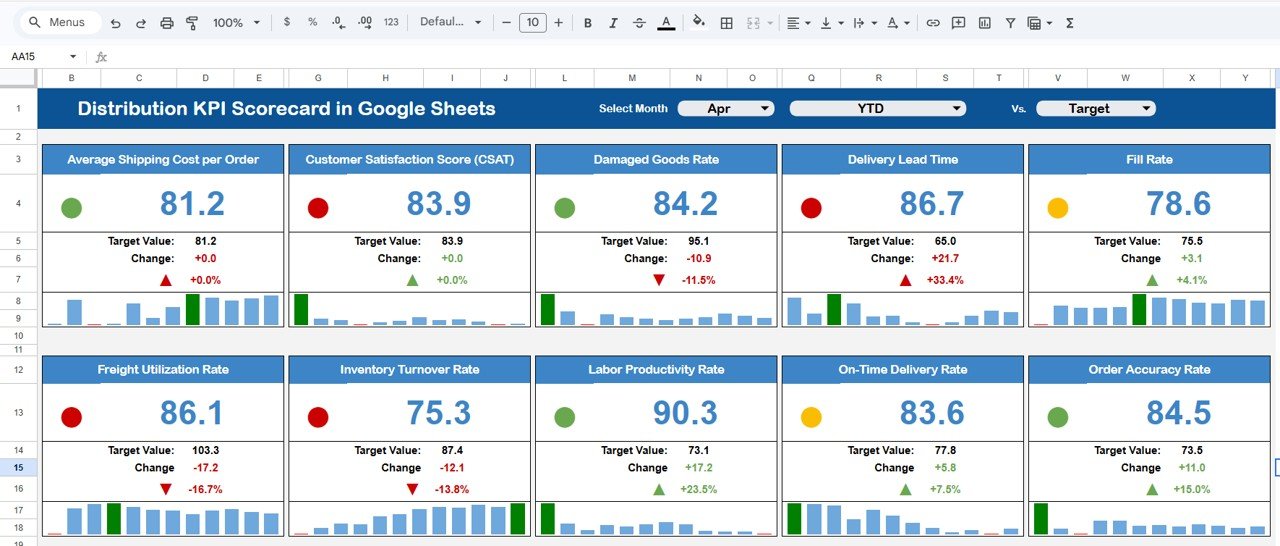
Distribution KPI Scorecard in Google Sheets
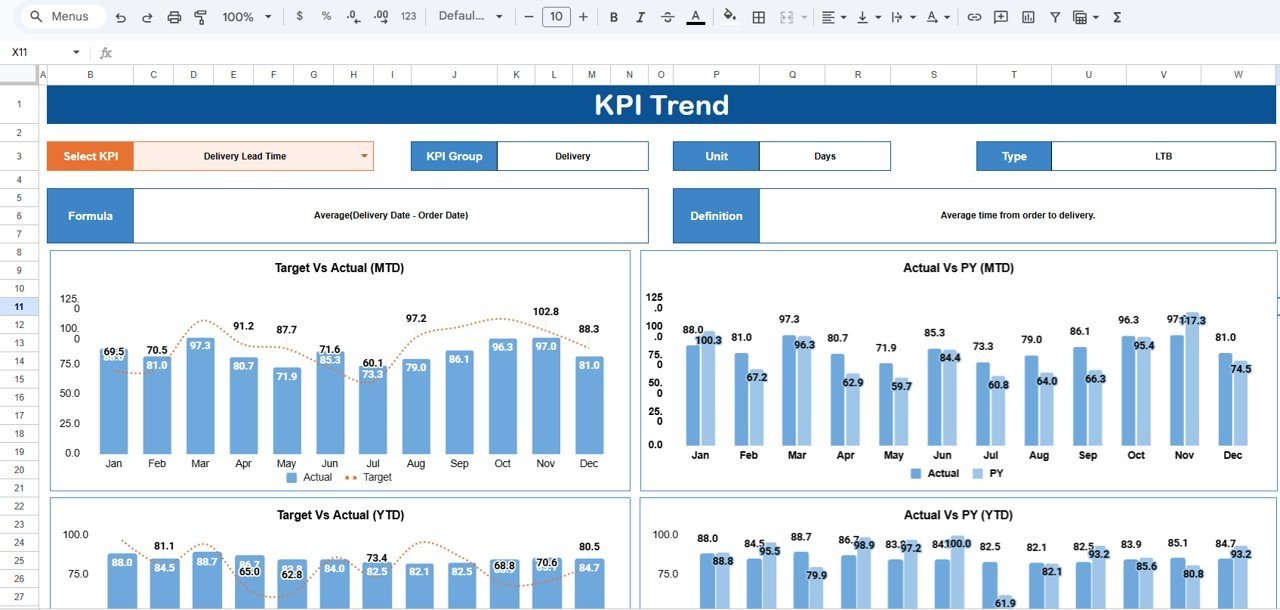
📈 KPI Trend Sheet — Select any KPI name from the dropdown on cell C3. The sheet displays the KPI Group, Unit, Type (Lower the Better or Upper the Better), Formula, and Definition. MTD and YTD trend charts compare Actual, Target, and Previous Year numbers side by side, making it easy to identify seasonal patterns and long-term distribution performance shifts.
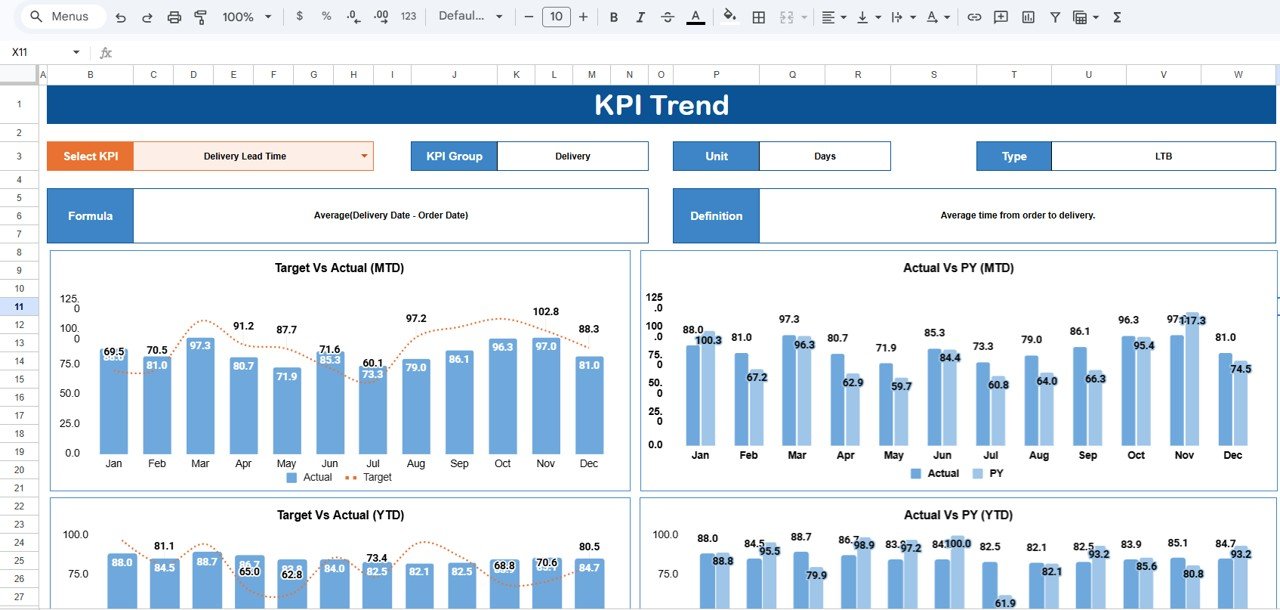
KPI Trend Sheet
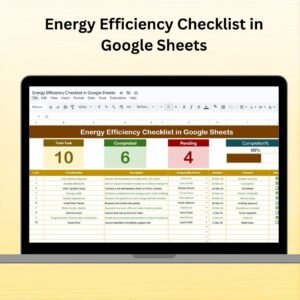
📝 Input Data Sheet — Enter actual values, targets, and other metrics for each KPI. Update data as new results become available. The scorecard recalculates all MTD, YTD, and trend comparisons automatically when you update this sheet.
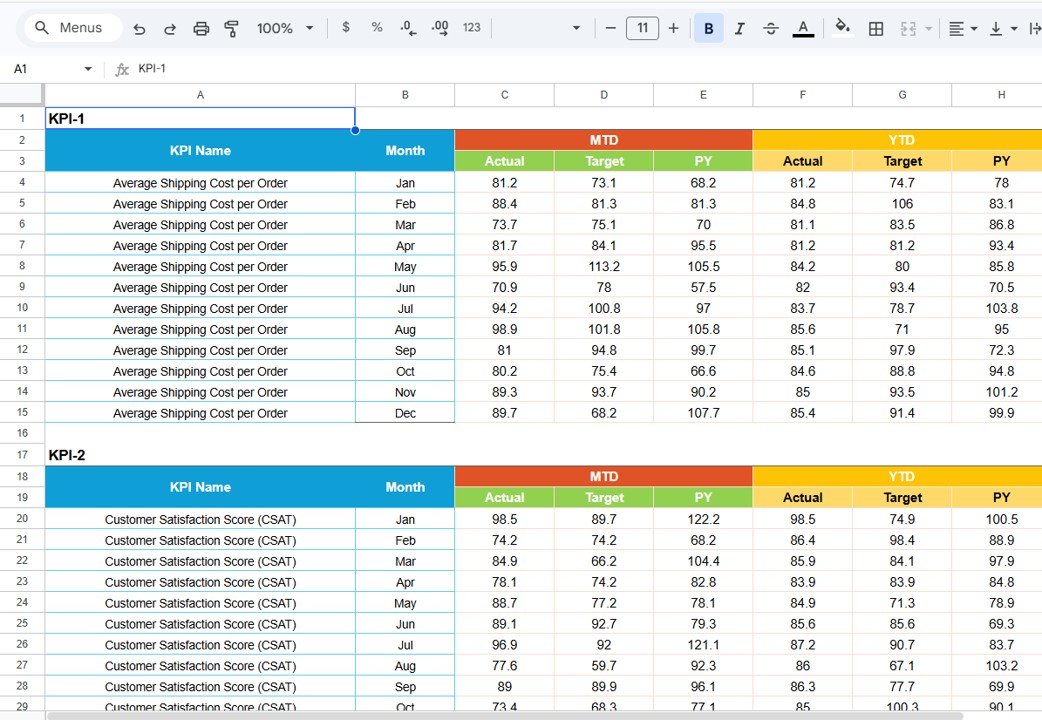
Input Data Sheet
📋 KPI Definition Sheet — Define each KPI’s name, group, unit, formula, and description. This sheet serves as the master reference that feeds all dropdown menus and labels throughout the scorecard.
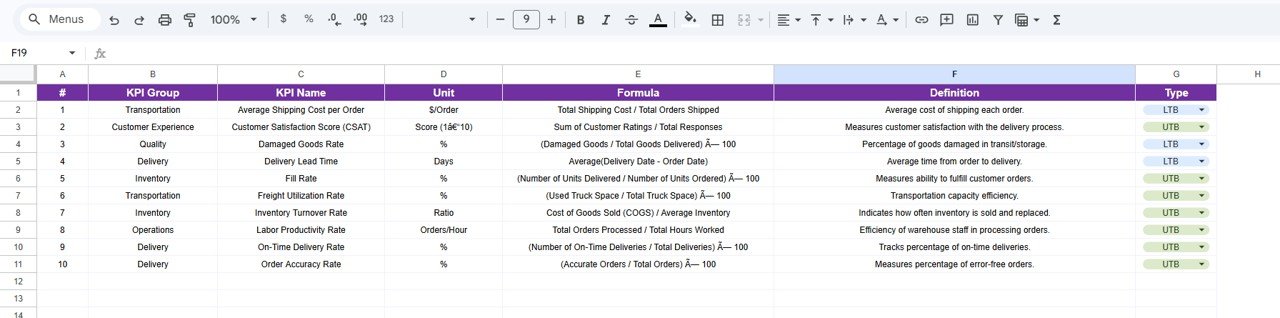
KPI Definition Sheet
📦 What’s Inside the Distribution KPI Scorecard in Google Sheets
📌 4 structured worksheets: Scorecard, KPI Trend, Input Data, and KPI Definition
📌 10+ pre-configured distribution KPIs with formulas and definitions
📌 MTD and YTD trend charts with Actual vs Target vs Previous Year comparisons
📌 Dropdown menus for month selection and KPI filtering
📌 Color-coded conditional formatting for instant performance status
📌 Editable KPI definitions, groups, units, and formulas
📌 Sample data included — replace with your own and the scorecard updates automatically
📊 Distribution KPI Scorecard in Google Sheets vs. Microsoft Excel Scorecard vs. Paid Logistics SaaS — Where This Fits
| Feature | Distribution KPI Scorecard in Google Sheets | Microsoft Excel Scorecard | Zoho Inventory / NetSuite ERP |
|---|---|---|---|
| Cost | $8.99 one-time | $10-$20 one-time (template) | $25-$150 / user / month |
| Platform | Google Sheets (free, browser-based) | Microsoft Excel (license required) | Web-based SaaS |
| Setup Time | Under 10 minutes | 10-15 minutes | 2-6 weeks onboarding |
| Real-Time Team Collaboration | ✅ Yes — built into Google Sheets | ❌ No (file sharing only) | ✅ Yes |
| Mobile Access | ✅ Yes — Google Sheets app | Limited (Excel mobile) | ✅ Yes |
| Customizable KPIs | ✅ Fully editable definitions, formulas, groups | ✅ Editable with Excel skills | Partial — vendor-defined metrics |
| Share with Link | ✅ One click | ❌ Requires email attachment | ✅ Role-based access |
| Year-1 Cost at 5 Users | $8.99 total | $10-$20 + Excel licenses | $1,500-$9,000 |
| MTD/YTD Trend Charts | ✅ Built-in with Actual, Target, PY | ✅ Available | ✅ Available |
For distribution teams that want KPI tracking with real-time collaboration without paying $100+ per user per month, the Distribution KPI Scorecard in Google Sheets sits in the sweet spot.
👥 Who This Template Is For — and Who It’s Not For
✅ This template is built for:
- Distribution managers at small to mid-sized companies (10-500 employees) tracking delivery, logistics, and warehouse KPIs
- Supply chain coordinators who need a shared, real-time scorecard for monthly performance reviews
- Operations leads at e-commerce, FMCG, or retail businesses monitoring distribution efficiency without SaaS overhead
❌ This template is NOT for:
- Enterprise logistics teams needing ERP integration, IoT sensor feeds, or SOC 2 compliance
- Companies requiring automated data ingestion from WMS or TMS systems — this scorecard uses manual data entry
⚙️ How to Use the Distribution KPI Scorecard in Google Sheets
1️⃣ Open the PDF guide included in your download and click the Google Sheets copy link to create your own editable copy in Google Drive.
2️⃣ Go to the KPI Definition sheet and enter your distribution KPI names, groups, units, formulas, and definitions.
3️⃣ Navigate to the Input Data sheet and enter your actual values, targets, and metrics for each month.
4️⃣ Open the Scorecard sheet and use the dropdown menus to select the month, MTD, or YTD view.
5️⃣ Switch to the KPI Trend sheet and select any KPI from the dropdown on C3 to view trend charts comparing Actual, Target, and Previous Year.
💼 Real-World Use Cases
Ankit manages distribution at a 200-person FMCG company in Mumbai. He uses the Distribution KPI Scorecard in Google Sheets to track on-time delivery rate, order fill rate, and distribution cost per unit across 8 regional warehouses. Every Monday, he shares the live scorecard link with his leadership team — no email attachments, no version confusion, and no $150/month SaaS subscription.
Maria runs logistics for an e-commerce brand shipping 5,000 orders per month from three US fulfillment centers. She replaced her manual Excel tracker with this Google Sheets scorecard to get real-time collaboration with warehouse supervisors. The MTD vs YTD trend charts help her spot seasonal spikes and negotiate better carrier rates quarterly.
David coordinates supply chain operations for a mid-sized electronics distributor. He tracks fleet efficiency, returns processing time, and warehouse utilization in the scorecard. The KPI Definition sheet lets him add custom metrics specific to his industry without hiring a developer or buying a $9,000/year logistics platform.
❓ Frequently Asked Questions
What KPIs does the Distribution KPI Scorecard in Google Sheets track?
The Distribution KPI Scorecard in Google Sheets tracks 10+ distribution KPIs including on-time delivery rate, order fill rate, distribution cost per unit, warehouse utilization, fleet efficiency, and returns processing time. All metrics update automatically when you replace the sample data.
How long does setup take?
Setup takes under 10 minutes. Click the copy link in the included PDF, open the KPI Definition sheet to customize your KPIs, enter your actual values in the Input Data sheet, and the scorecard calculates everything automatically.
Can I add my own custom KPIs?
Yes. The KPI Definition sheet lets you add, remove, or modify any KPI — including the name, group, unit, formula, and definition. The scorecard, trend charts, and dropdown menus update automatically.
Does this work on mobile devices?
Yes. Since it runs in Google Sheets, you can view and edit the Distribution KPI Scorecard from any device using the free Google Sheets mobile app for iOS and Android.
How does this compare to Zoho Inventory or NetSuite?
Zoho Inventory starts at $29/user/month and NetSuite ERP costs $99+/user/month. The Distribution KPI Scorecard in Google Sheets costs $8.99 one-time with no per-user fees, no subscription, and lifetime access — saving teams thousands annually.
Can multiple team members edit the scorecard simultaneously?
Yes. Google Sheets supports real-time collaboration. Share the scorecard link with your team and everyone can view or edit simultaneously — with changes visible instantly.
Is there a video tutorial available?
Visit our YouTube channel @NextGenTemplates for step-by-step video tutorials on how to set up and customize KPI scorecards in Google Sheets.
👤 About the Author
Built by PK — Microsoft Certified Professional with 15+ years of Excel, Google Sheets, and Power BI experience. Founder of NextGenTemplates, reaching 300K+ subscribers across YouTube channels (@PK-AnExcelExpert, @NextGenTemplates, @NeoTechNavigators). Every template is hand-built and tested before release.
🔗 Explore Related Templates
📌 Warehouse Management KPI Scorecard in Google Sheets — Track warehouse efficiency, inventory accuracy, and receiving speed across your distribution centers.
📌 Supply Chain – Logistics KPI Scorecard in Google Sheets — Monitor end-to-end supply chain performance including procurement, transportation, and supplier metrics.
📌 Project Management KPI Scorecard in Google Sheets — Track project milestones, budget adherence, and team productivity KPIs.
Browse all Google Sheets Dashboard Templates →
📖 Click here to read the Detailed Blog Post
🎥 Visit our YouTube channel for step-by-step video tutorials
👉 YouTube.com/@NextGenTemplates


Reviews
There are no reviews yet.