


In the competitive world of distribution, staying on top of performance is crucial for success. The Distribution KPI Dashboard in Google Sheets is designed to help businesses track their distribution metrics, make informed decisions, and improve overall efficiency. Here are the key features:

-
Dynamic Month Selection: Easily select a month from the dropdown to view the most up-to-date data for that period, including Month-to-Date (MTD) and Year-to-Date (YTD) performance.
-
Real-Time Data Updates: With Google Sheets, data updates automatically to ensure your team always has access to the latest insights.
-
Comprehensive KPI Tracking: Monitor KPIs related to delivery efficiency, cost management, order accuracy, and customer satisfaction, all in one place.
-
Previous Year Comparison: Compare current data with last year’s performance to evaluate growth, improvements, or areas needing attention.
-
Conditional Formatting: Visually track performance with color-coded arrows that highlight whether performance is improving or declining.
-
Customizable KPIs: The dashboard is fully customizable, allowing you to add or remove KPIs based on your business needs.
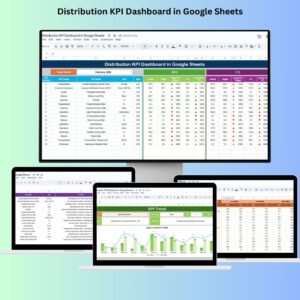
What’s Inside the Distribution KPI Dashboard 📈
This template comes with six essential worksheets to help you track and manage your distribution performance efficiently:
-
Dashboard Sheet Tab: The central hub where you can view all KPIs for the selected month, with performance indicators for MTD, YTD, and comparisons to Previous Year data.
-
KPI Trend Sheet Tab: Track the historical performance of each KPI and monitor the trend of key metrics over time.
-
Actual Number Sheet Tab: Input the actual performance data for MTD and YTD, with automatic updates based on the selected month.
-
Target Sheet Tab: Set your target numbers for each KPI to compare performance against goals for both MTD and YTD.
-
Previous Year Number Sheet Tab: Input performance data from the previous year to identify trends and compare growth over time.
-
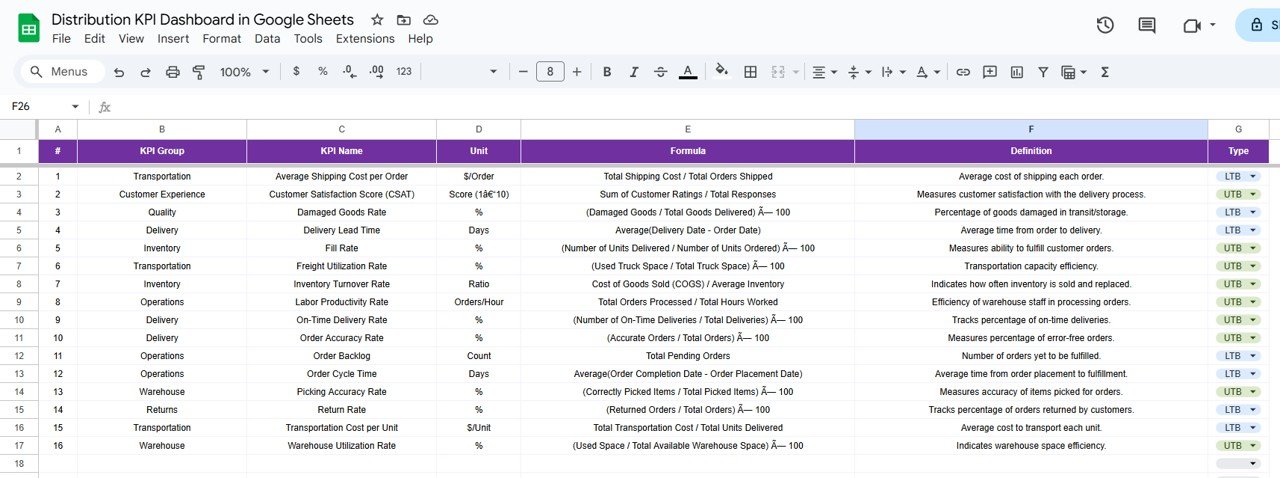
KPI Definition Sheet Tab: Provides a clear definition of each KPI, including its name, unit of measurement, formula, and significance in distribution management.
How to Use the Distribution KPI Dashboard 🛠️
Getting started with the Distribution KPI Dashboard is simple:
-
Set Up the Dashboard: Download and input your actual distribution data into the corresponding sheets (Actual Numbers, Targets, etc.).
-
Select Your Month: Use the dropdown menu in the dashboard to select the month you want to analyze. The data will update to reflect the performance for that month.
-
Enter Actual Data: Regularly update the Actual Number Sheet with the most current performance data for each KPI.
-
Review Performance: Use the dashboard’s color-coded indicators to quickly identify areas that need improvement.
-
Monitor Trends: Use the KPI Trend Sheet to track performance over time and identify opportunities for process optimization.
Who Can Benefit from This Distribution KPI Dashboard? 🏢
The Distribution KPI Dashboard is perfect for:
-
Distribution Managers: Track delivery efficiency, cost management, and order accuracy in one place.
-
Logistics Teams: Monitor KPIs related to delivery times, inventory turnover, and customer satisfaction.
-
Operations Managers: Leverage this dashboard to identify inefficiencies in the distribution process and make informed decisions for improvement.
-
Supply Chain Professionals: Evaluate the overall performance of your distribution system in relation to the entire supply chain.
-
Business Owners: Gain actionable insights to optimize your distribution process, reduce costs, and improve customer satisfaction.
This dashboard is essential for any business looking to streamline its distribution operations and improve overall performance.
Click here to read the Detailed blog post 📚
Visit our YouTube channel to learn step-by-step video tutorials
Youtube.com/@NeotechNavigators


Reviews
There are no reviews yet.