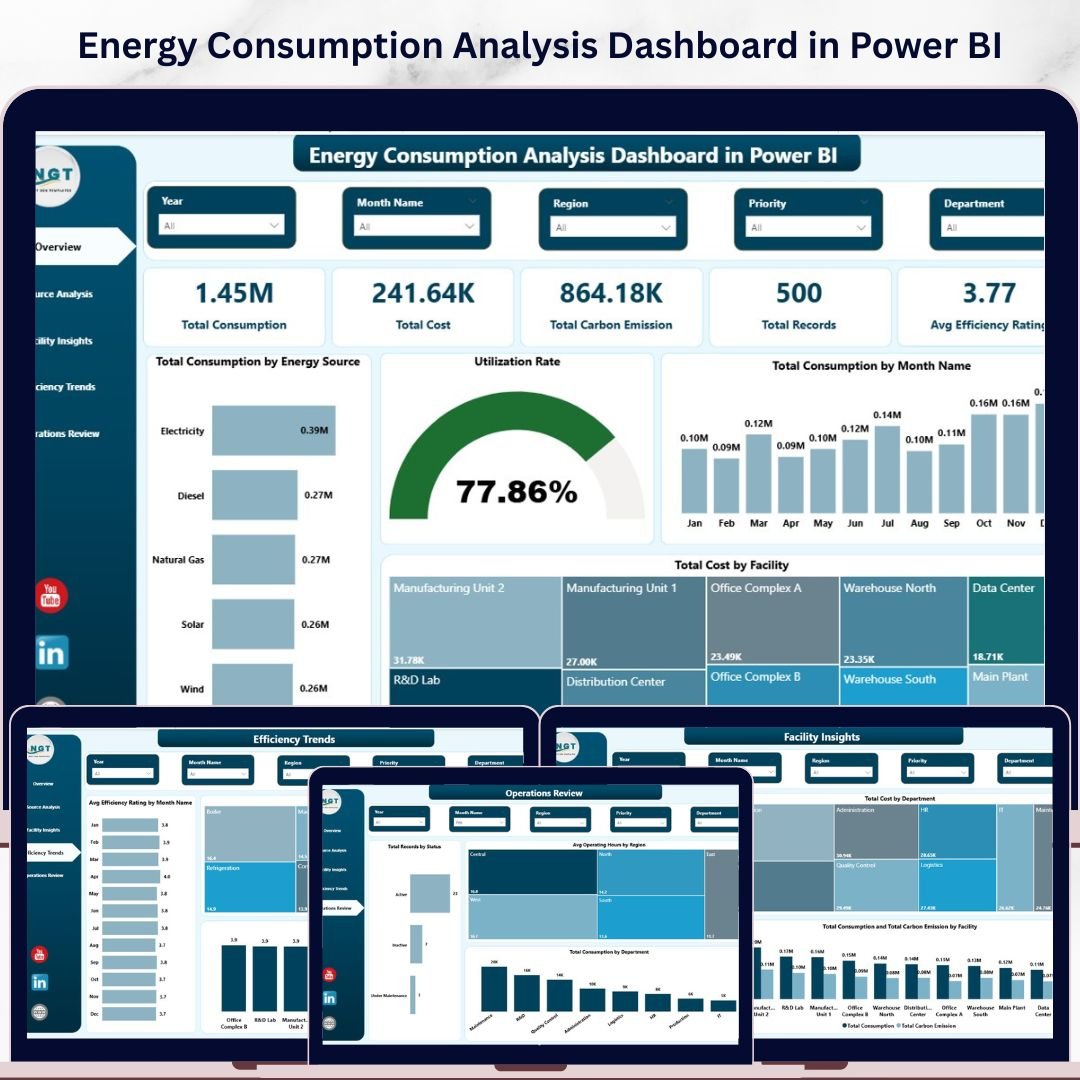
Energy Consumption Analysis Dashboard in Power BI is a professionally designed, ready-to-use interactive Power BI dashboard template built for energy managers, facility operators, sustainability officers, and operations teams who need to monitor energy consumption, costs, carbon emissions, and operational efficiency — all from one centralized Power BI Dashboard. This template includes 5 interactive dashboard pages covering Overview, Source Analysis, Facility Insights, Efficiency Trends, and Operations Review — giving you a 360-degree view of your organization’s energy performance with dynamic charts, KPI cards, slicers, and filters powered by Power BI’s analytics engine.
Managing energy data across multiple facilities, departments, and energy sources is a challenge when data lives in disconnected reports and spreadsheets. This dashboard solves that by consolidating energy consumption, costs, carbon emissions, efficiency ratings, and operational metrics into one clean, interactive, and data-driven experience. Whether you oversee commercial buildings, industrial plants, or multi-site operations, this Power BI template delivers instant insights for smarter energy decisions. If you prefer working in Excel, explore the Energy Consumption Analysis Dashboard in Excel. For a browser-based solution, check out the Energy Consumption Analysis Dashboard in HTML.
🔑 Key Features of Energy Consumption Analysis Dashboard in Power BI
📌 5 Interactive Dashboard Pages — Overview, Source Analysis, Facility Insights, Efficiency Trends, and Operations Review deliver focused insights using dynamic visuals, KPI cards, and slicer controls that let you filter data instantly by energy source, region, department, facility, equipment type, status, and time period.
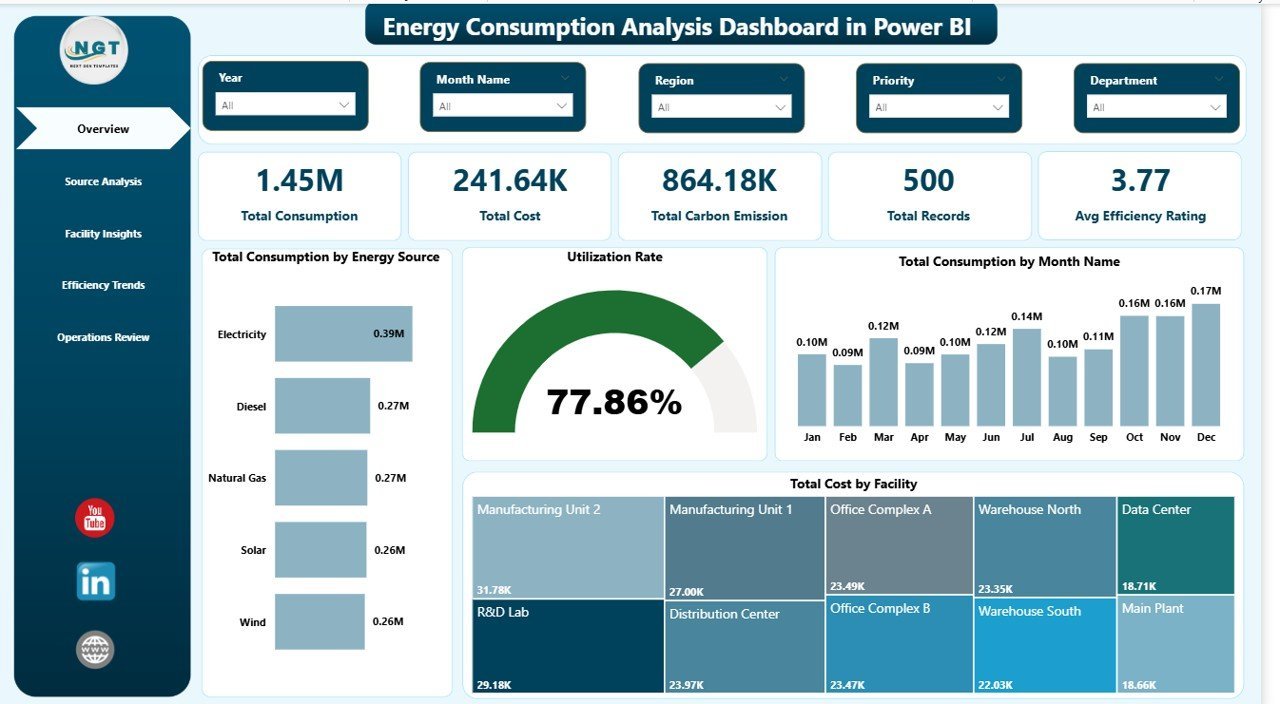
📌 Real-Time KPI Cards — Monitor Total Consumption, Total Cost, Total Carbon Emission, Total Records, and Avg Efficiency Rating at a glance from the Overview page. These 5 high-level KPI cards provide instant visibility into your organization’s energy performance.
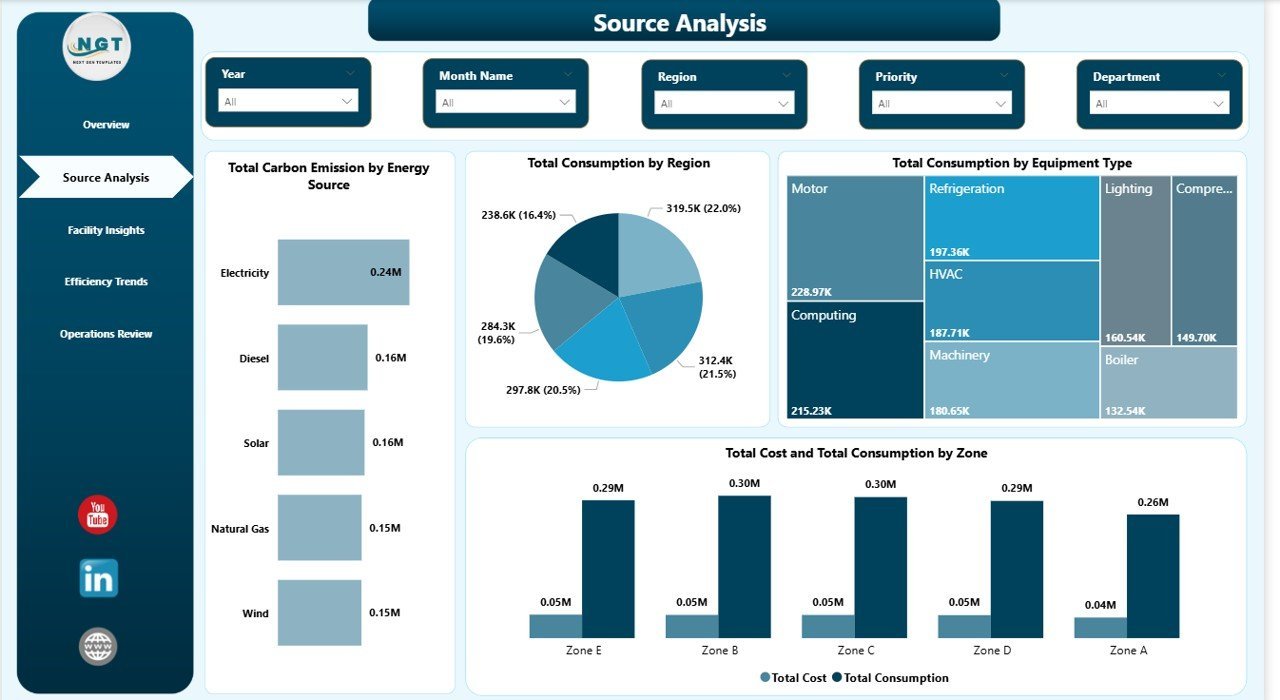
📌 Source Analysis Deep Dive — Analyze Total Carbon Emission by Energy Source, Total Consumption by Region, Total Consumption by Equipment Type, and Total Cost and Total Consumption by Zone to identify consumption hotspots and cost drivers across your energy portfolio.
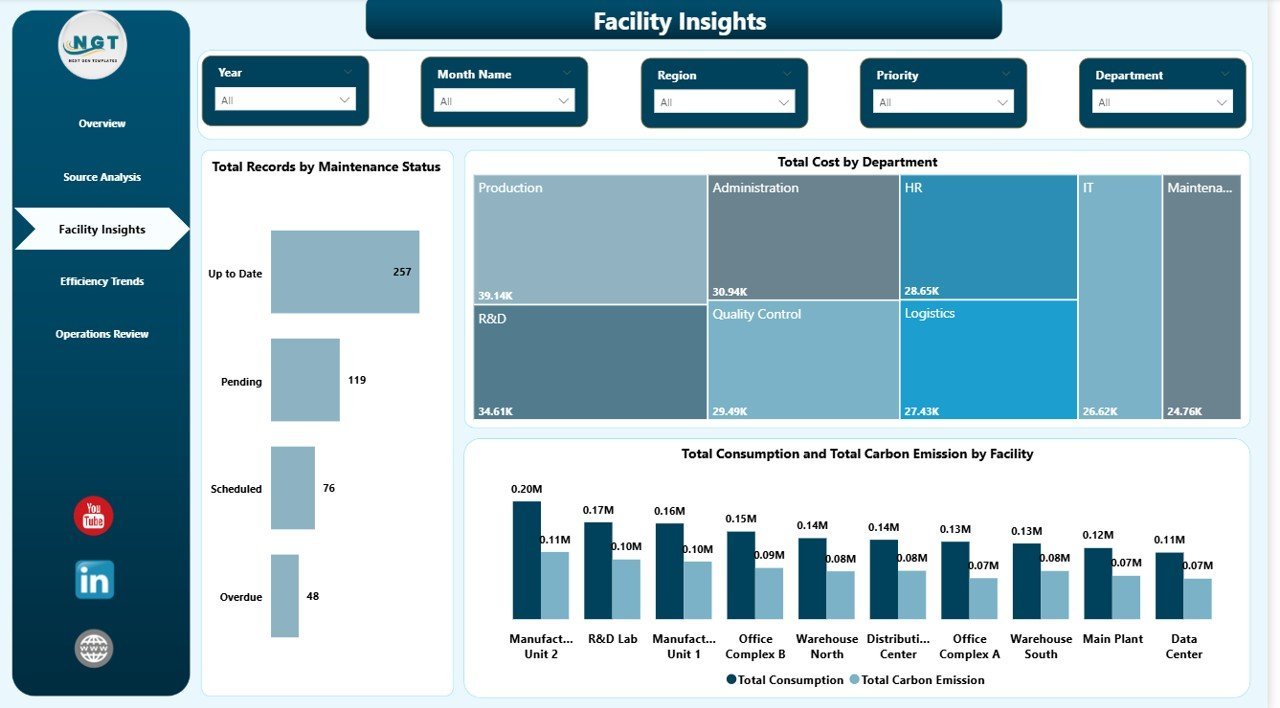
📌 Facility-Level Insights — Track Total Records by Maintenance Status, Total Cost by Department, and Total Consumption and Total Carbon Emission by Facility to evaluate operational performance at every location.
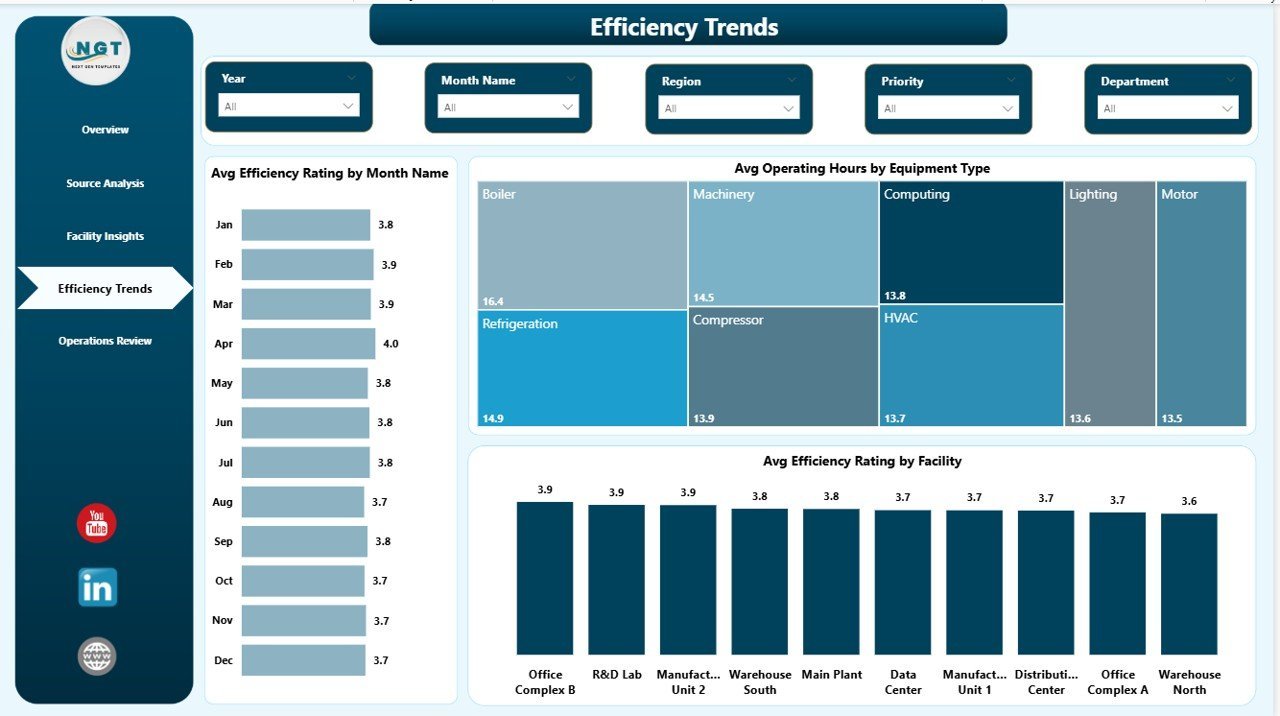
📌 Efficiency Trend Tracking — Monitor Avg Efficiency Rating by Month Name, Avg Operating Hours by Equipment Type, and Avg Efficiency Rating by Facility to benchmark efficiency performance and identify improvement opportunities over time.
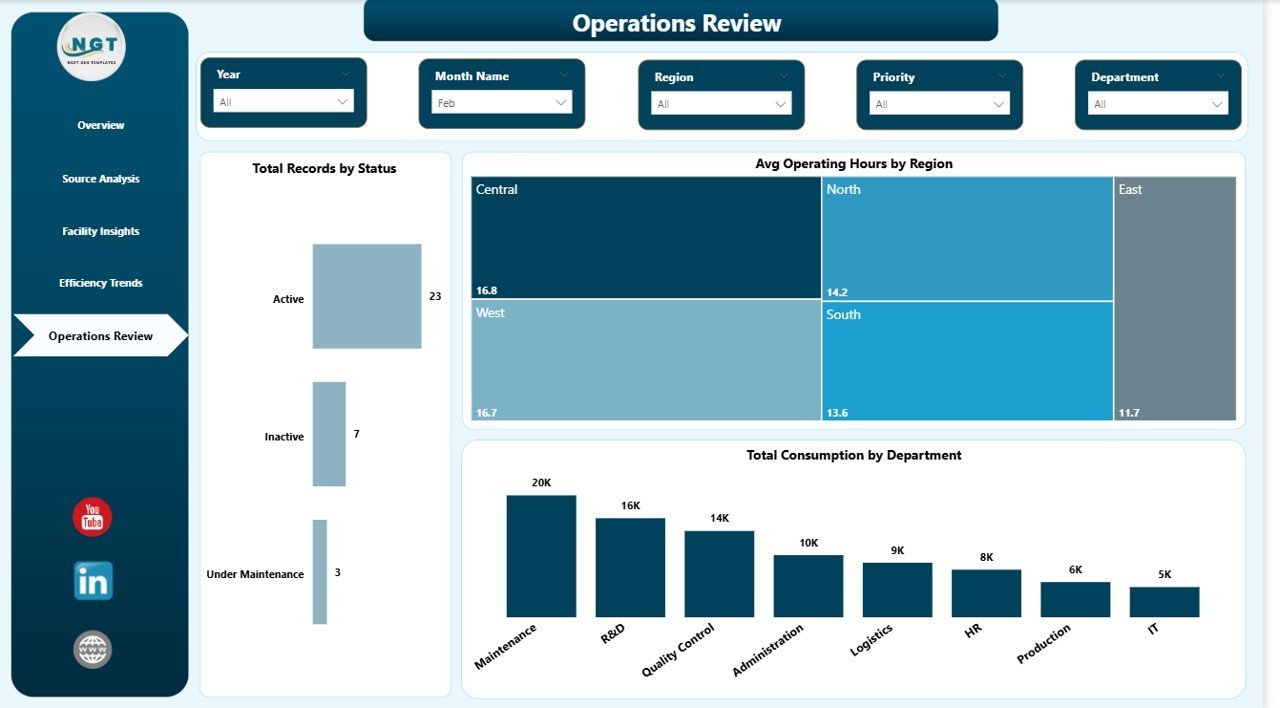
📌 Operations Review Analytics — Analyze Total Records by Status, Avg Operating Hours by Region, and Total Consumption by Department for complete operational visibility across your organization.
📌 Interactive Slicers & Filters — Every page includes multiple slicers allowing you to filter the entire dashboard by region, facility, time period, energy source, equipment type, and department for rapid drill-down analysis.
📌 Professional Design — Clean, modern layout with consistent color schemes and intuitive navigation across all 5 pages. Ready for executive presentations and board-level energy reporting.
📦 What’s Inside the Energy Consumption Analysis Dashboard in Power BI
This dashboard includes 5 interactive pages covering every aspect of energy consumption reporting:
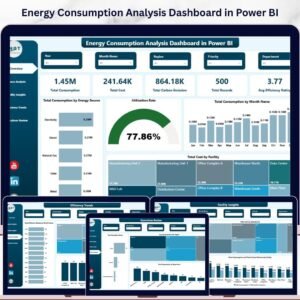
📊 Page 1 — Overview: High-level KPI cards showing Total Consumption, Total Cost, Total Carbon Emission, Total Records, and Avg Efficiency Rating. Charts include Total Consumption by Energy Source showing the distribution across fuel types, Utilization Rate providing a quick efficiency snapshot, Total Consumption by Month Name tracking usage patterns over time, and Total Cost by Facility comparing spending across locations. Multiple slicers enable quick filtering across all visuals.

Energy Consumption Analysis Dashboard in Power BI
📊 Page 2 — Source Analysis: Deep-dive into energy source performance with charts for Total Carbon Emission by Energy Source tracking environmental impact per fuel type, Total Consumption by Region showing geographic distribution, Total Consumption by Equipment Type identifying high-consumption equipment categories, and Total Cost and Total Consumption by Zone revealing cost-to-consumption relationships across operational zones.

Source Analysis
📊 Page 3 — Facility Insights: Analyze operational performance at the facility level with charts for Total Records by Maintenance Status monitoring equipment health, Total Cost by Department revealing departmental spending patterns, and Total Consumption and Total Carbon Emission by Facility comparing energy usage against environmental impact per location.

Facility Insights
📊 Page 4 — Efficiency Trends: Track efficiency performance over time with charts for Avg Efficiency Rating by Month Name monitoring efficiency patterns month by month, Avg Operating Hours by Equipment Type comparing runtime across equipment categories, and Avg Efficiency Rating by Facility ranking facilities by efficiency performance.
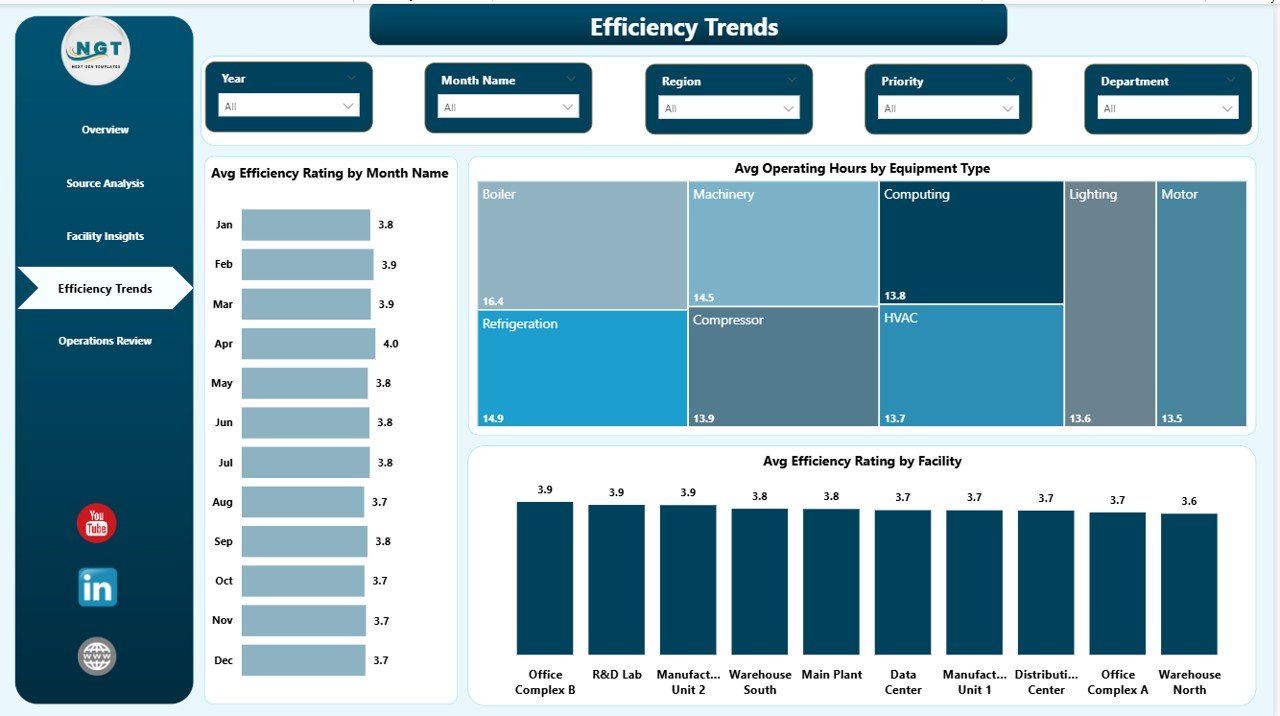
Efficiency Trends
📊 Page 5 — Operations Review: Get operational visibility with charts for Total Records by Status breaking down operational status distribution, Avg Operating Hours by Region comparing runtime across geographic areas, and Total Consumption by Department analyzing departmental consumption patterns.
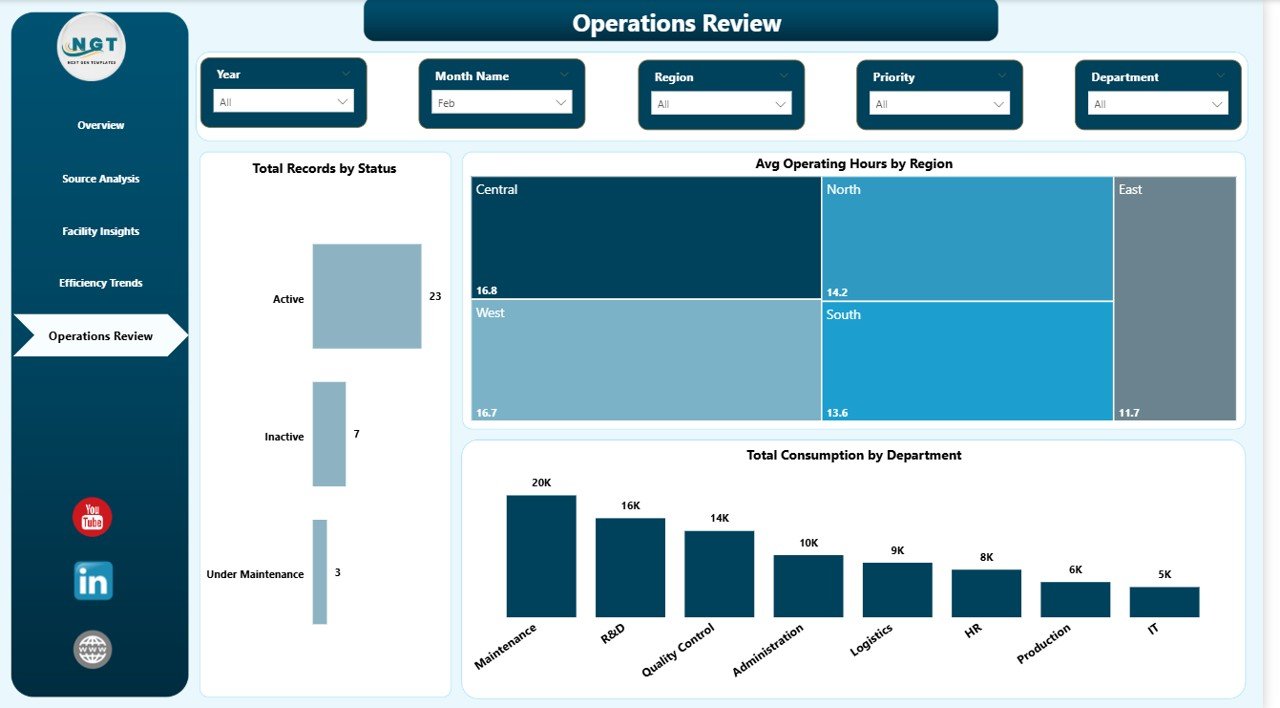
Operations Review
⚙️ How to Use the Energy Consumption Analysis Dashboard in Power BI
1️⃣ Download and unzip the template file.
2️⃣ Open the .pbix file in Power BI Desktop (free download from Microsoft).
3️⃣ Explore the 5 dashboard pages using the tab navigation at the bottom.
4️⃣ Use slicers and filters on each page to drill down by region, facility, energy source, department, or time period.
5️⃣ Replace the sample data with your own energy consumption data — all charts and KPI cards update automatically.
6️⃣ Publish to Power BI Service for team sharing, scheduled refresh, and executive access.
👥 Who Can Benefit from This Energy Consumption Analysis Dashboard
🔹 Energy Managers — Monitor consumption patterns, costs, and efficiency across all energy sources and facilities in real time.
🔹 Facility Operators — Track energy usage by facility, department, and equipment type for operational optimization.
🔹 Sustainability Officers — Analyze carbon emissions by source and facility to meet environmental compliance targets.
🔹 Data Analysts — Generate actionable insights from energy performance data with interactive Power BI visualizations.
🔹 Operations Directors — Compare efficiency trends by month and year to drive cost reduction strategies.
🔹 Consultants & Auditors — Use as a baseline template for client energy assessments and sustainability audits.
Browse our complete collection of Power BI Dashboard Templates for more professional analytics solutions.
❓ Frequently Asked Questions
What KPIs does the Energy Consumption Analysis Dashboard in Power BI track?
The Energy Consumption Analysis Dashboard in Power BI tracks 5 key performance indicators: Total Consumption, Total Cost, Total Carbon Emission, Total Records, and Avg Efficiency Rating. These KPIs are displayed as high-level cards on the Overview page and analyzed in detail across all 5 dashboard pages with over 15 interactive charts.
How many pages are included in this energy dashboard?
This template includes 5 interactive dashboard pages: Overview, Source Analysis, Facility Insights, Efficiency Trends, and Operations Review. Each page focuses on a specific aspect of energy consumption reporting with dedicated charts, KPI cards, and slicer filters.
Do I need advanced Power BI skills to use this template?
No. Simply open the .pbix file in Power BI Desktop, explore the pre-built pages, and replace the sample data with your own energy consumption data. All charts, KPI cards, and filters update automatically. No DAX or Power Query coding required.
Can I customize this dashboard for my organization?
Yes. You can modify colors, add new visuals, create additional calculated measures, adjust slicer filters, and connect your own data sources. Power BI Desktop provides full editing capability for every element.
What is the best Power BI template for tracking energy consumption?
The Energy Consumption Analysis Dashboard in Power BI is an excellent choice for tracking energy consumption. It provides dedicated analysis of Total Consumption by Energy Source, by Region, by Equipment Type, by Facility, and by Department — giving you comprehensive visibility into your organization’s energy footprint across 5 interactive pages.
How does this dashboard help with carbon emission tracking?
The dashboard includes dedicated Total Carbon Emission by Energy Source and Total Consumption and Total Carbon Emission by Facility charts that help sustainability teams monitor environmental impact and prepare compliance reports.
🔗 Explore Related Templates
🔹 Energy Consumption Analysis Dashboard in Excel — Track the same energy KPIs using Microsoft Excel with interactive pivot charts and dynamic slicers.
🔹 Energy Consumption Analysis Dashboard in HTML — Browser-based interactive version with 5 pages, filters, and CSV export.
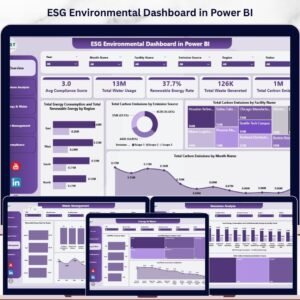
🔹 ESG Environmental Dashboard in Power BI — Track carbon emissions, water usage, waste, and compliance scores with Power BI analytics.
📖 Click here to read the Detailed Blog Post<
Watch the step-by-step video tutorial:
/h3>


Reviews
There are no reviews yet.