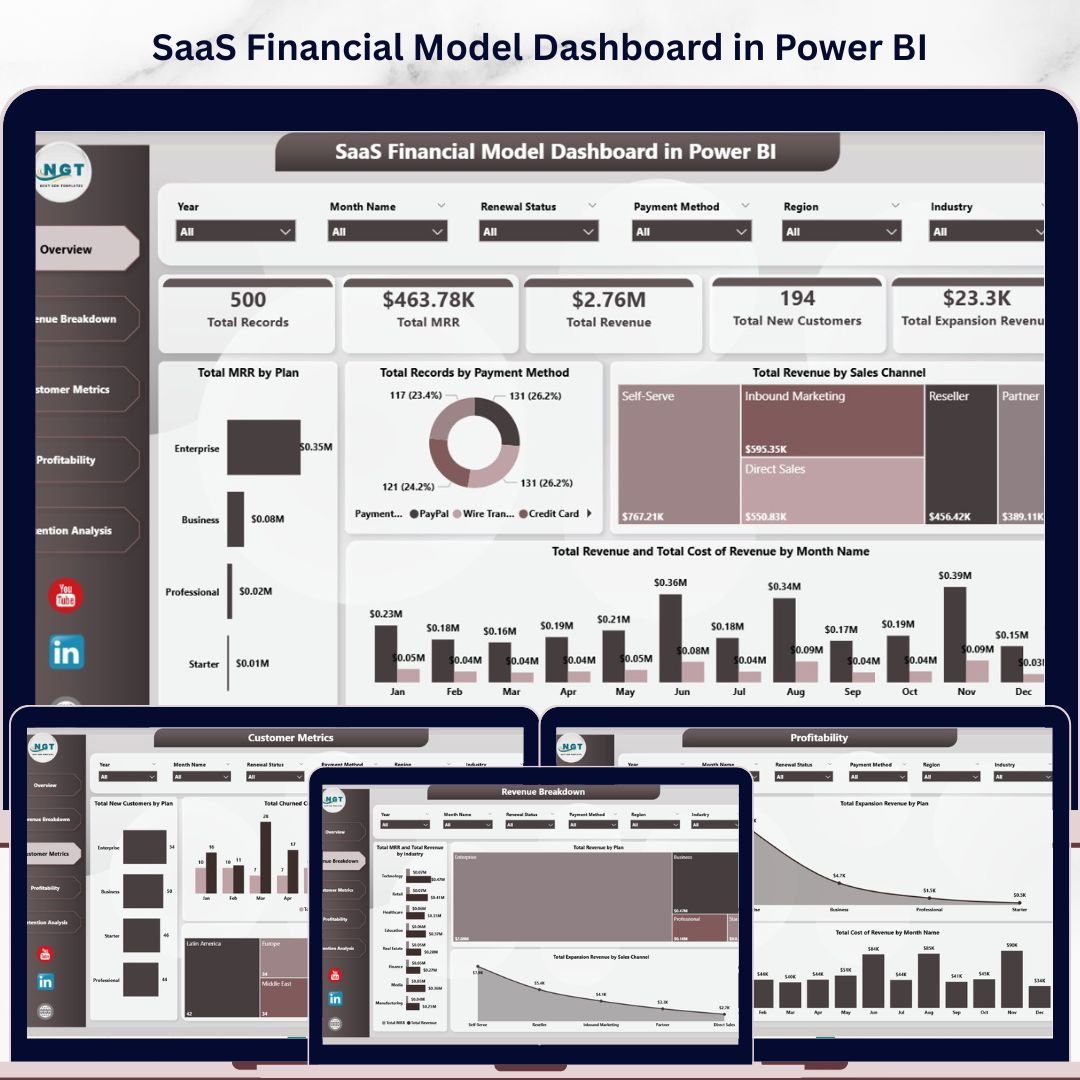


SaaS Financial Model Dashboard in Power BI is a powerful, ready-to-use Power BI template designed to help SaaS founders, finance teams, and data analysts track monthly recurring revenue, customer acquisition, churn analysis, and profitability — all in one interactive dashboard. This template includes 5 professionally designed dashboard pages covering everything from high-level financial overviews to granular retention analysis. Simply open the .pixy file in Power BI Desktop, connect your data, and start making smarter financial decisions today.
🔑 Key Features of SaaS Financial Model Dashboard in Power BI
📌 5 Interactive Dashboard Pages – Overview, Revenue Breakdown, Customer Metrics, Profitability, and Retention Analysis give you a complete view of your SaaS business health.
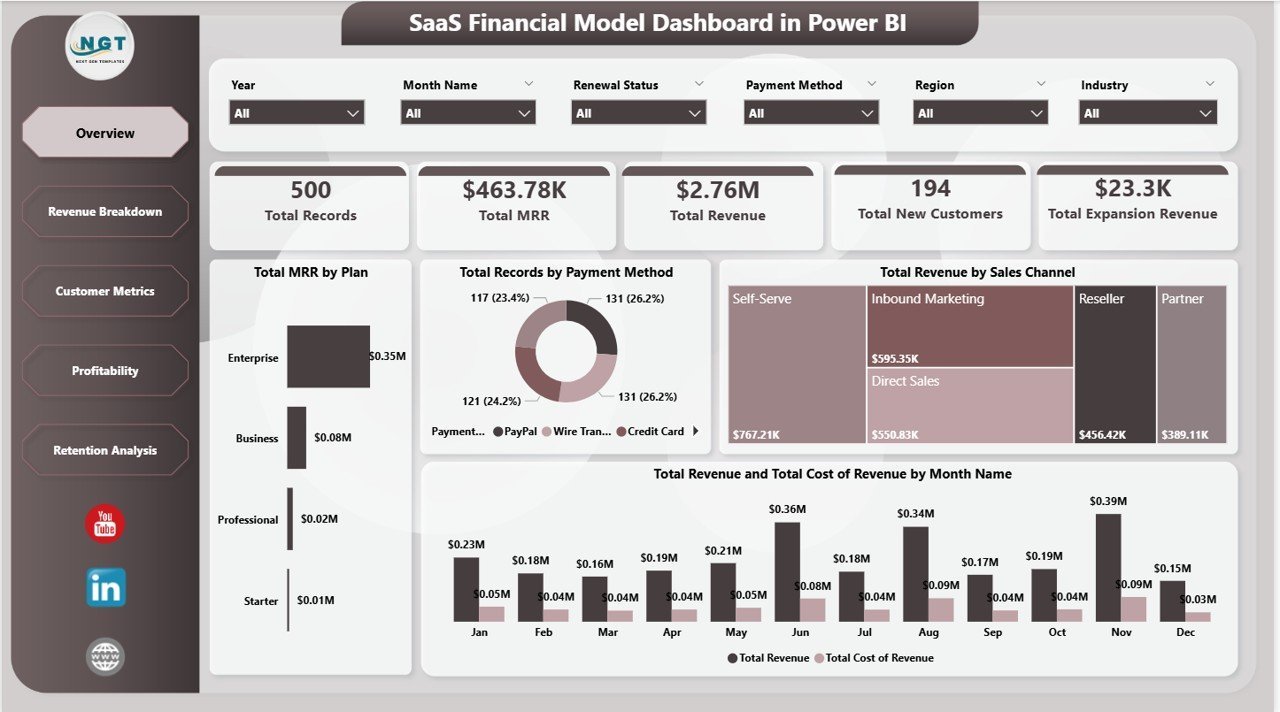
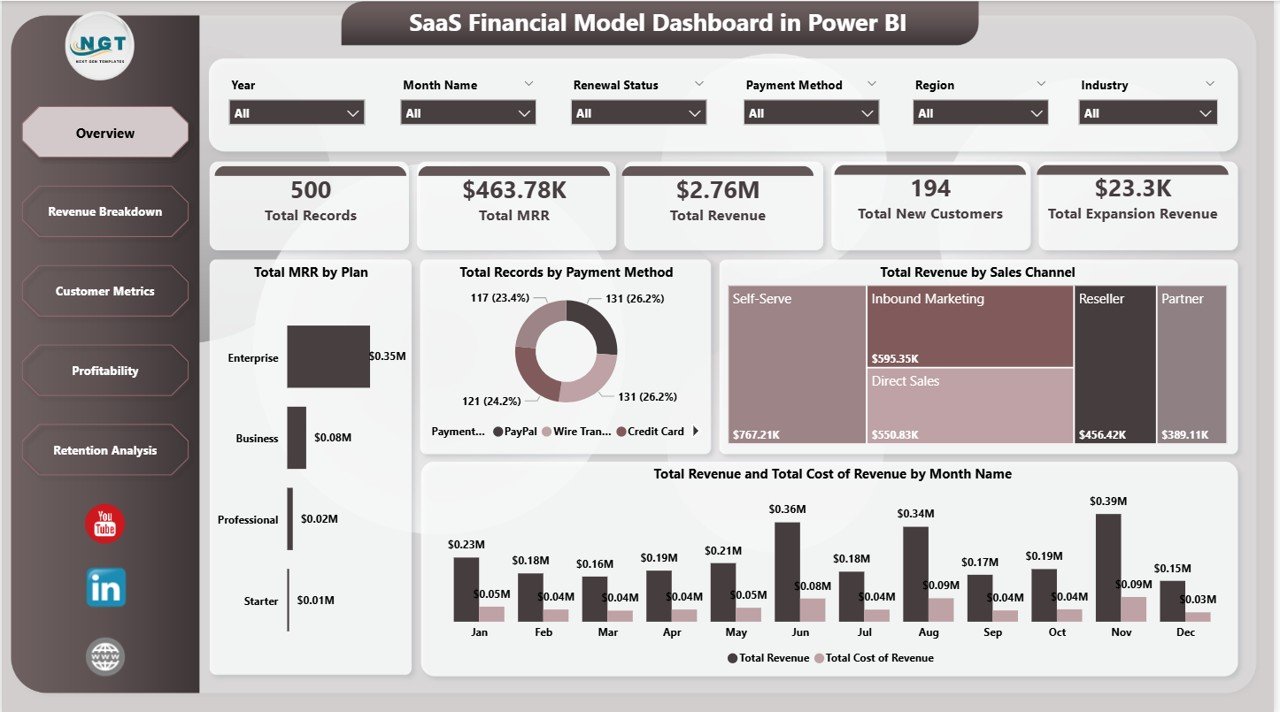
📌 Real-Time KPI Cards – Instantly see Total MRR, Total Revenue, Total New Customers, Total Records, and Total Expansion Revenue at the top of the Overview page.
📌 Dynamic Slicers and Filters – Apply quick filters across all pages to drill down by plan, region, industry, sales channel, and payment method.
📌 MRR and Revenue Tracking – Track monthly recurring revenue by plan, total revenue by sales channel, and compare revenue against cost of revenue month over month.
📌 Customer Acquisition and Churn Analysis – Visualize new customers by plan and region, monitor churned customers by month, and analyze average customer acquisition cost by plan.
📌 Profitability Insights – Break down revenue by region, expansion revenue by plan, and cost of revenue trends by month to identify growth opportunities.
📌 Clean and Professional Design – Modern layout with consistent color scheme, intuitive navigation tabs, and well-organized visual hierarchy.
📌 Plug-and-Play Template – Replace sample data with your own SaaS metrics and the entire dashboard auto-updates. No DAX expertise needed.
📦 What’s Inside the SaaS Financial Model Dashboard in Power BI
This Power BI SaaS dashboard template contains 5 dedicated pages designed to give you complete financial visibility into your subscription business:
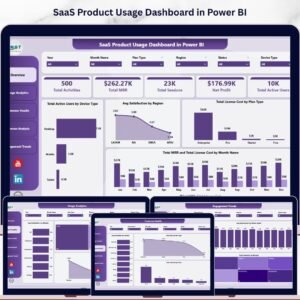
1️⃣ Overview Page – The command center of your SaaS financial model. It displays five KPI cards at the top: Total Records, Total MRR, Total Revenue, Total New Customers, and Total Expansion Revenue. Below the cards, you will find insightful visuals including Total MRR by Plan, Total Records by Payment Method, Total Revenue by Sales Channel, and a combined view of Total Revenue and Total Cost of Revenue by Month Name. Multiple slicers allow you to filter the dashboard instantly.
SaaS Financial Model Dashboard in Power BI
2️⃣ Revenue Breakdown – Dive deeper into your revenue streams. This page analyzes Total MRR and Total Revenue by Industry, Total Revenue by Plan, and Total Expansion Revenue by Sales Channel. Perfect for understanding which industries and plans drive the most revenue.
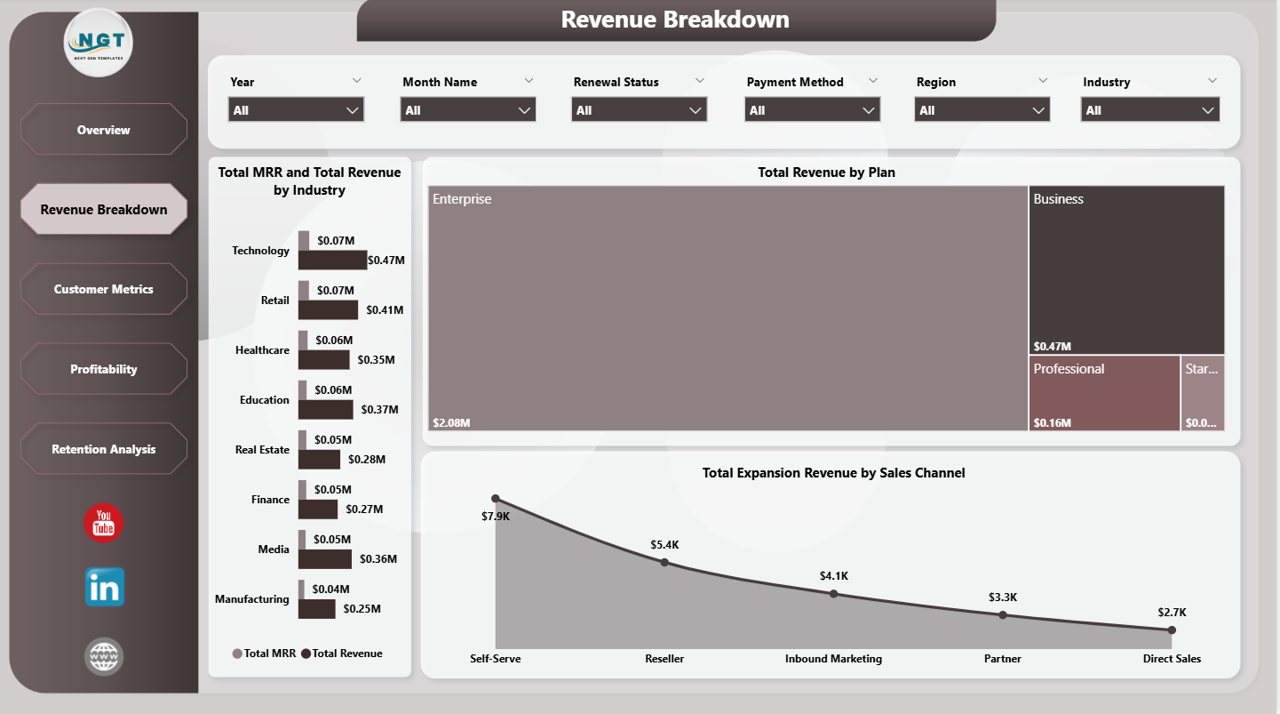
Revenue Breakdown
3️⃣ Customer Metrics – Understand your customer base with visuals showing Total New Customers by Plan, Total Churned Customers and Total New Customers by Month Name, and Total New Customers by Region. This page helps you identify acquisition trends and churn patterns across your business.
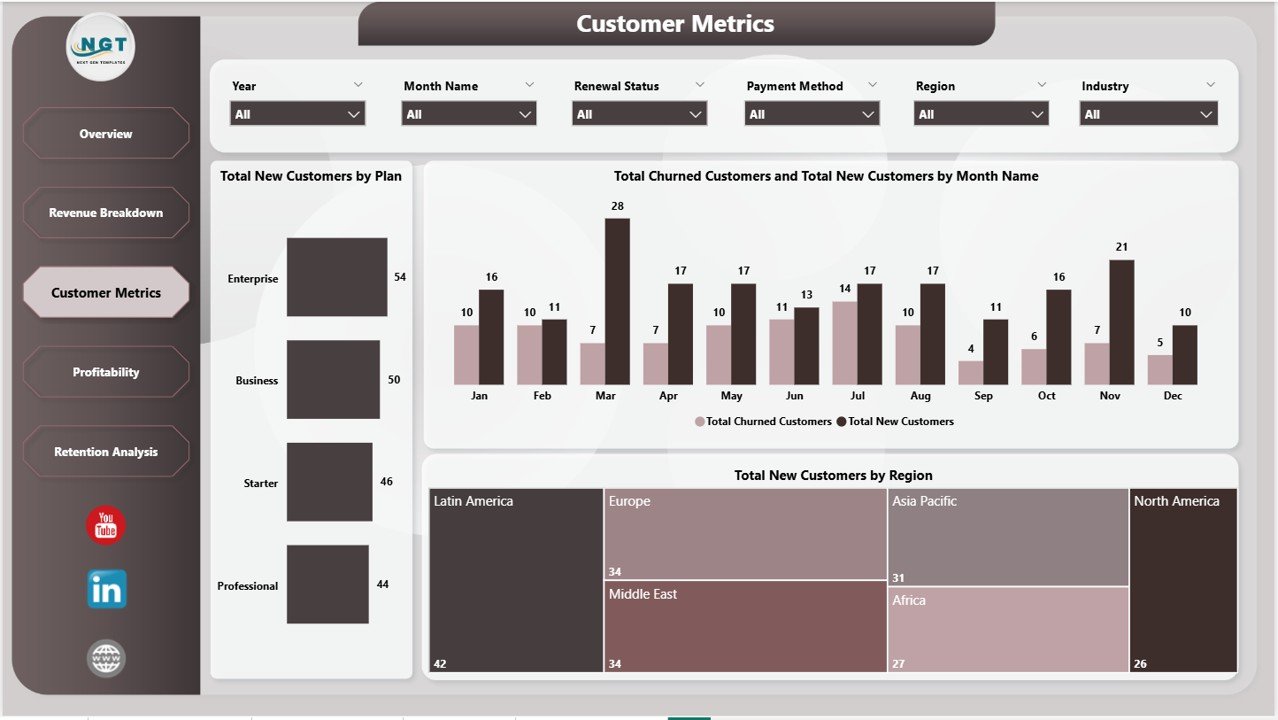
Customer Metrics
4️⃣ Profitability – Keep your margins healthy. This page tracks Total Revenue by Region, Total Expansion Revenue by Plan, and Total Cost of Revenue by Month Name — giving you clear visibility into where your profits are coming from and where costs are trending.
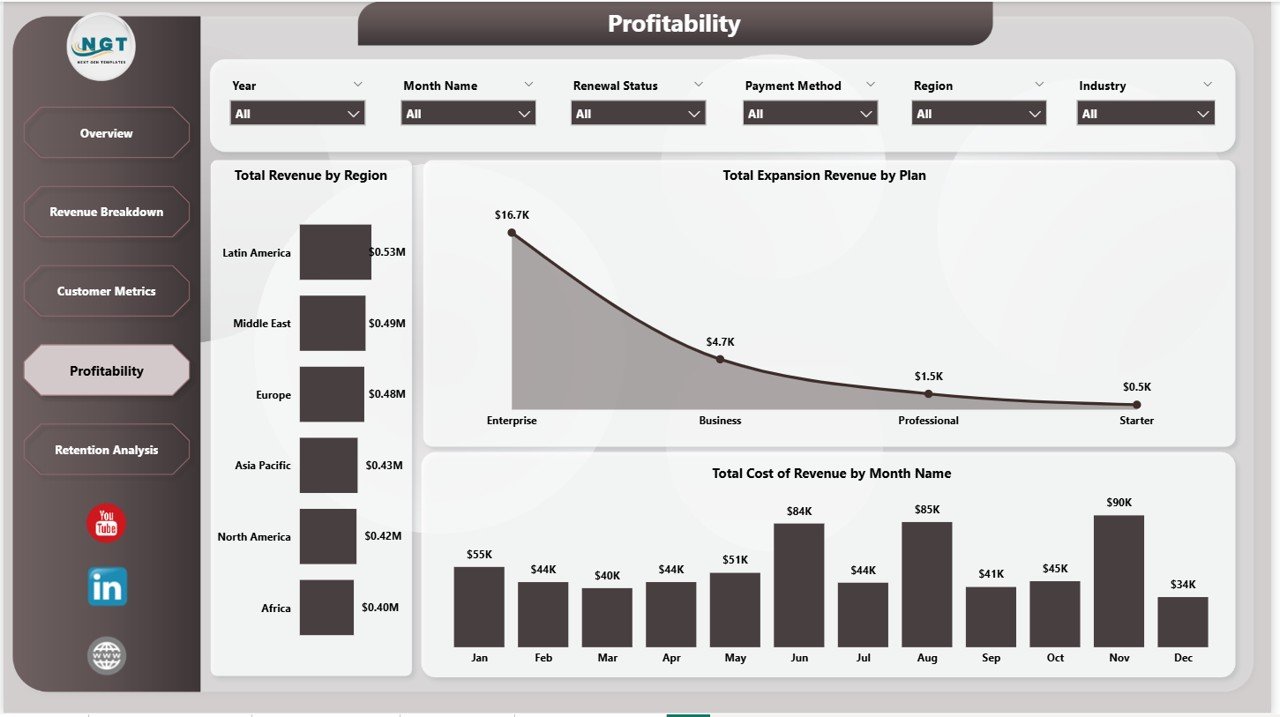
Profitability
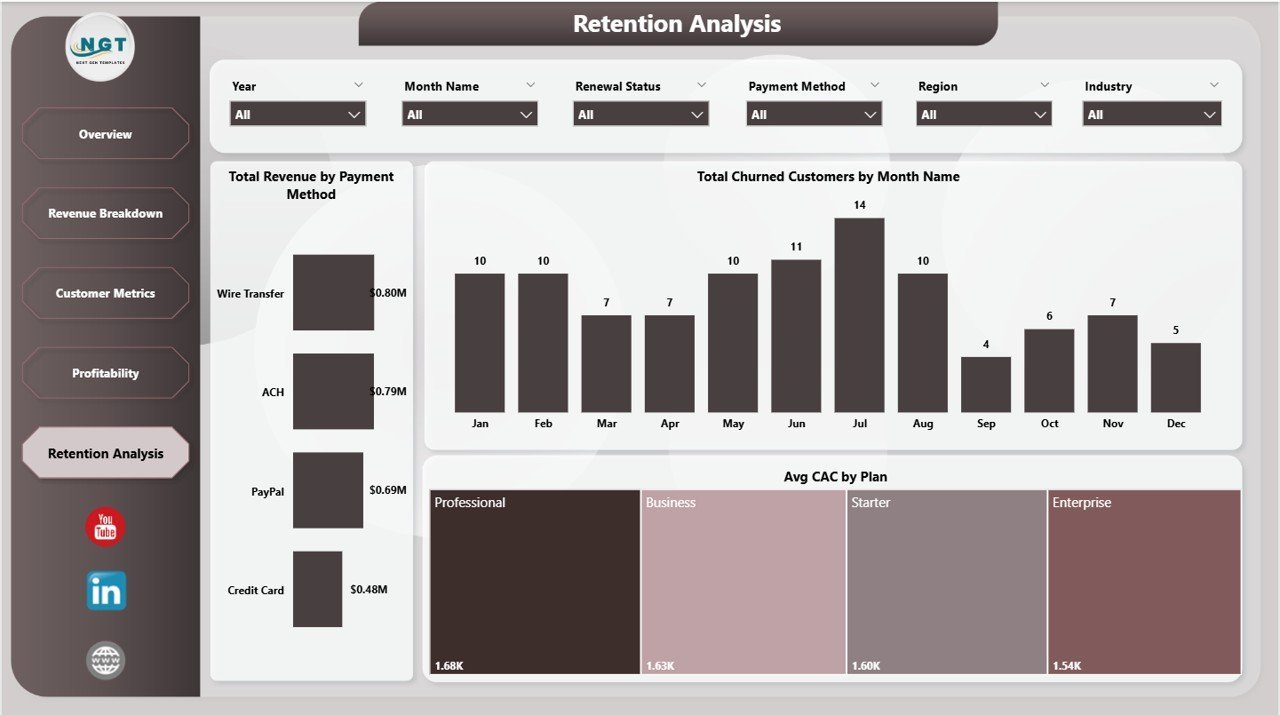
5️⃣ Retention Analysis – The final page focuses on retention health. It visualizes Total Revenue by Payment Method, Total Churned Customers by Month Name, and Avg CAC by Plan. Use this page to monitor how efficiently you are retaining customers and controlling acquisition costs.

Retention Analysis
⚙️ How to Use the SaaS Financial Model Dashboard in Power BI
1️⃣ Download and unzip the template file after purchase.
2️⃣ Open the .pbix file using Power BI Desktop (free download from Microsoft).
3️⃣ Navigate through the 5 dashboard tabs — Overview, Revenue Breakdown, Customer Metrics, Profitability, and Retention Analysis.
4️⃣ Replace the sample data with your own SaaS financial data and all visuals refresh automatically.
5️⃣ Use slicers to filter by plan, region, industry, sales channel, or payment method for targeted insights.
👥 Who Can Benefit from This SaaS Financial Model Dashboard in Power BI
📌 SaaS founders and startup CEOs tracking MRR growth and unit economics
📌 Finance and FP&A teams building financial models for investor reporting
📌 Data analysts visualizing subscription revenue and churn patterns
📌 Product managers monitoring customer acquisition trends by plan
📌 Venture capital and private equity analysts evaluating SaaS portfolio companies
📌 Business consultants advising SaaS clients on revenue optimization
❓ Frequently Asked Questions
What KPIs does the SaaS Financial Model Dashboard in Power BI track?
The SaaS Financial Model Dashboard in Power BI tracks 5 key performance indicators including Total MRR, Total Revenue, Total New Customers, Total Expansion Revenue, and Total Records. It also provides deep analysis of churn rate, CAC by plan, revenue by industry, and cost of revenue trends across 5 interactive dashboard pages.
Do I need advanced Power BI skills to use this dashboard?
No. This is a plug-and-play template. Simply open the .pbix file in Power BI Desktop, replace the sample data with your own SaaS metrics, and all charts, cards, and visuals update automatically. No DAX coding required.
Can I customize this Power BI SaaS dashboard for my business?
Absolutely. You can modify colors, add new measures, connect to live data sources like SQL Server or Excel, and create additional pages to match your specific SaaS reporting needs.
What is the best Power BI template for tracking SaaS MRR and revenue?
The SaaS Financial Model Dashboard in Power BI is one of the best templates for tracking MRR, revenue breakdown, customer churn, and profitability in a single interactive report. It is specifically designed for subscription-based businesses.
How is this different from the SaaS Metrics Dashboard in Power BI?
While the SaaS Metrics Dashboard in Power BI focuses on operational SaaS metrics, this SaaS Financial Model Dashboard emphasizes financial modeling aspects including profitability analysis, cost of revenue tracking, and expansion revenue by sales channel — ideal for CFOs and finance teams.
🔗 Explore Related Templates
📌 SaaS Metrics Dashboard in Power BI – Track operational SaaS KPIs including churn rate, LTV, and customer health metrics.
📌 Subscription Business Dashboard in Power BI – Comprehensive subscription analytics with renewal tracking and cohort analysis.
📌 SaaS Financial Model Dashboard in Excel – Prefer Excel? Get the same SaaS financial model in a familiar spreadsheet format.
Explore our complete collection of Power BI Dashboard Templates for every industry and department.
📖 Click here to read the Detailed Blog Post
🎥 Visit our YouTube channel to learn step-by-step video tutorials
👉 YouTube.com/@NextGenTemplates
Watch the step-by-step video tutorial:
YouTube


Reviews
There are no reviews yet.