

🔑 Key Features of the Dental Practice Dashboard in Excel
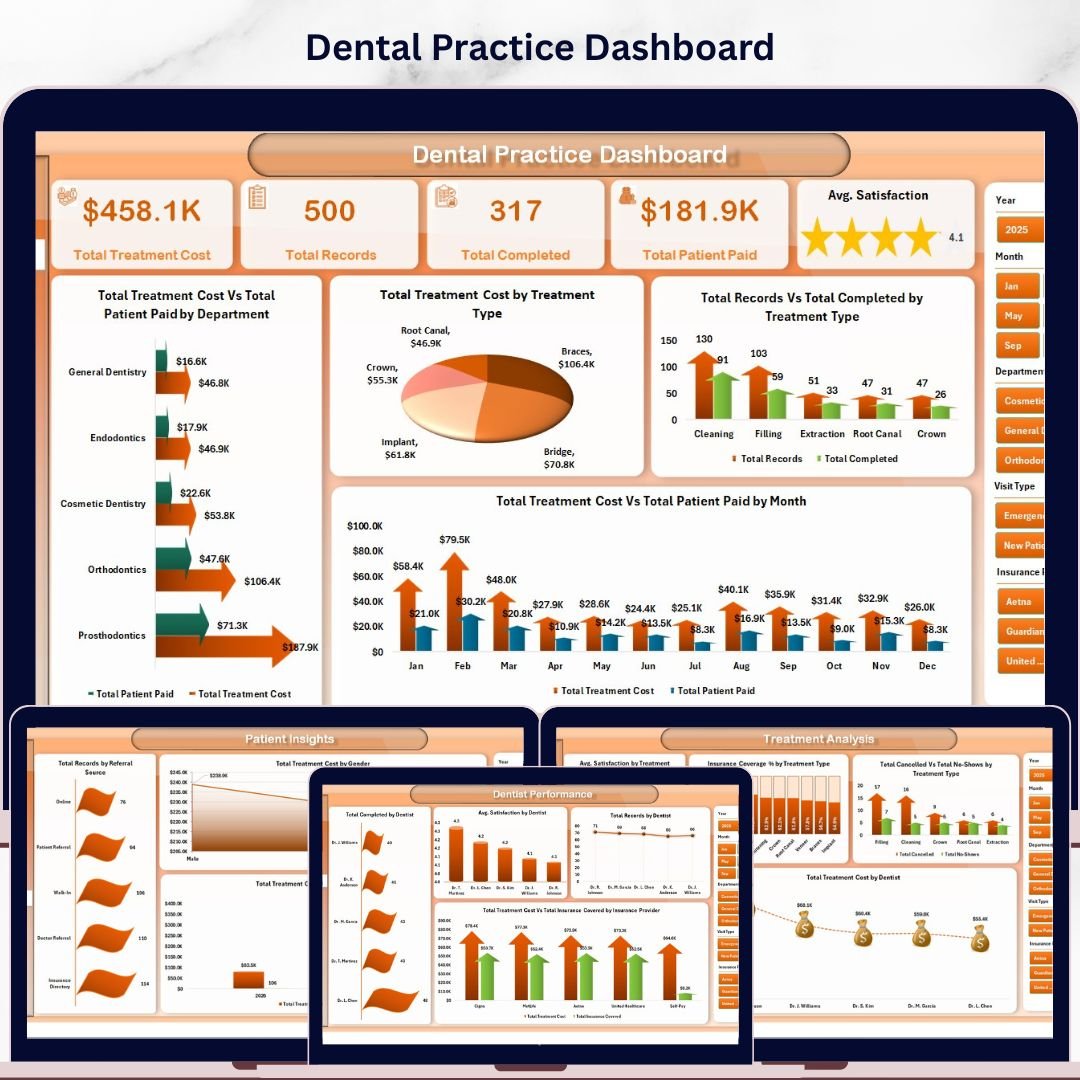
The Dental Practice Dashboard in Excel is a powerful analytics template built to help dental clinics, orthodontic offices, and oral healthcare providers monitor every aspect of their practice from a single Excel workbook. This template includes 5 interactive dashboard pages, a structured data sheet, and a support sheet with pivot tables that auto-refresh your entire dashboard. It tracks critical dental practice metrics including total treatment cost, total records, total completed treatments, total patient paid amounts, and average satisfaction scores across departments, treatment types, dentists, insurance providers, and referral sources.
Whether you manage a small dental office or a multi-location dental group, this ready-to-use Excel dashboard transforms raw appointment and billing data into clear visual insights — no advanced Excel skills required. Simply replace the sample data with your own and every chart updates automatically. Explore more Excel Dashboard Templates and Healthcare Templates on our store.
📦 What’s Inside the Dental Practice Dashboard in Excel
This comprehensive dental analytics template is organized into 7 sheet tabs, each serving a specific purpose:
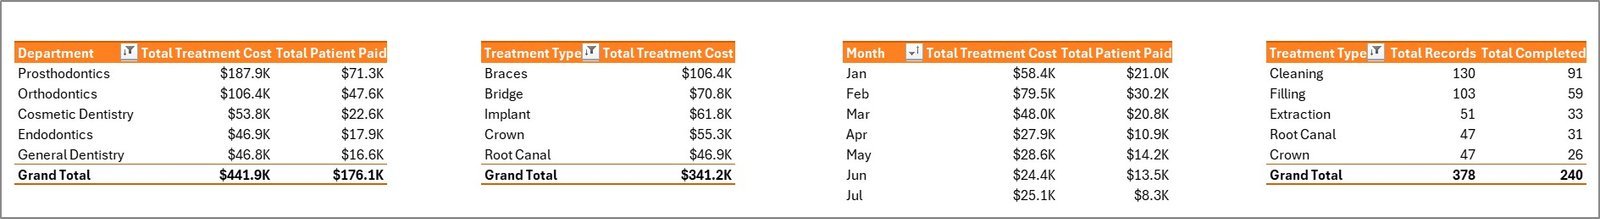
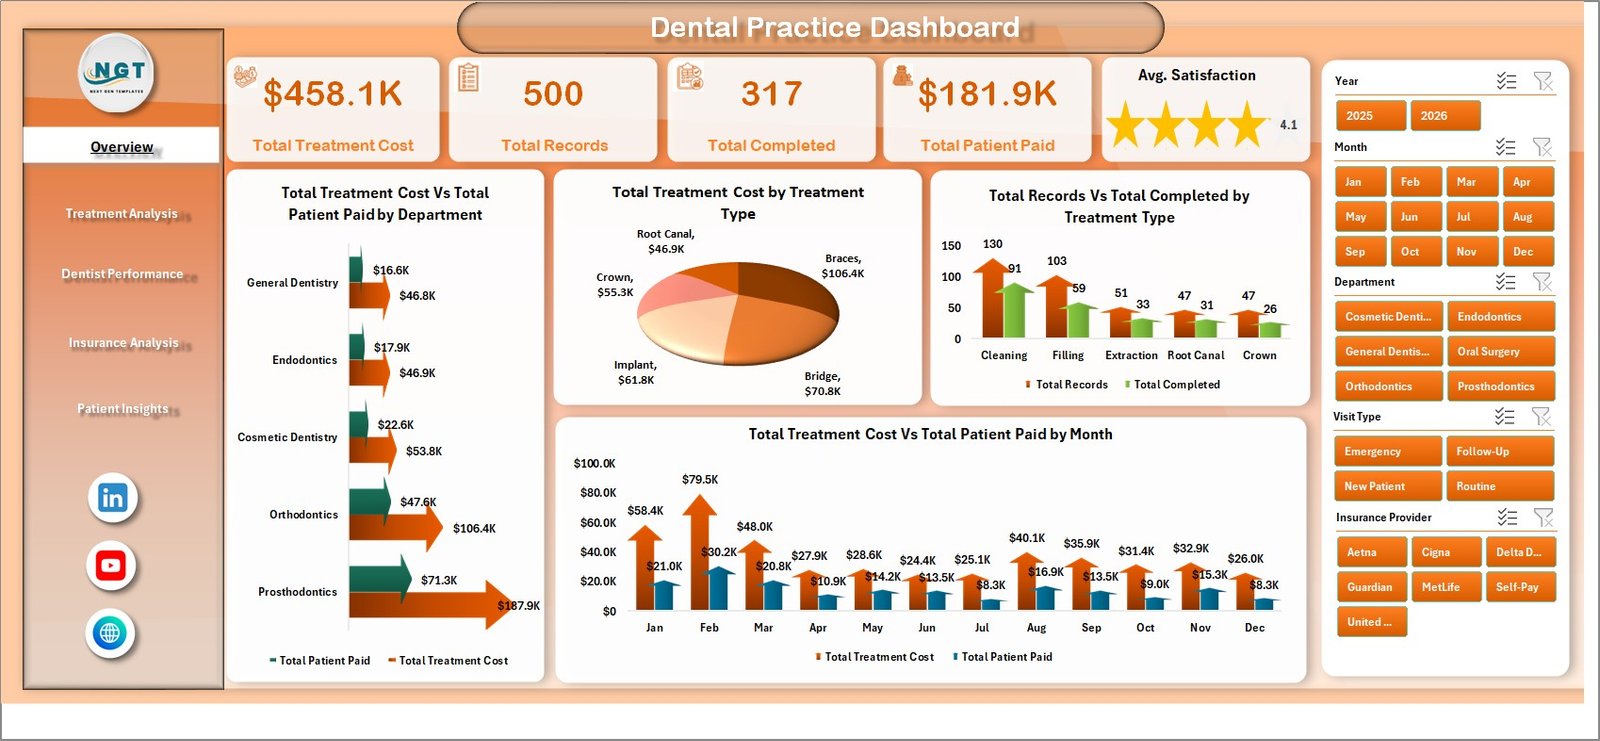
📊 Overview Page — High-level KPI cards displaying Total Treatment Cost, Total Records, Total Completed, Total Patient Paid, and Avg. Satisfaction. Interactive charts include Total Treatment Cost Vs Total Patient Paid by Department, Total Treatment Cost by Treatment Type, Total Records Vs Total Completed by Treatment Type, and Total Treatment Cost Vs Total Patient Paid by Month. Multiple slicers let you filter the entire dashboard instantly.
 Dental Practice Dashboard
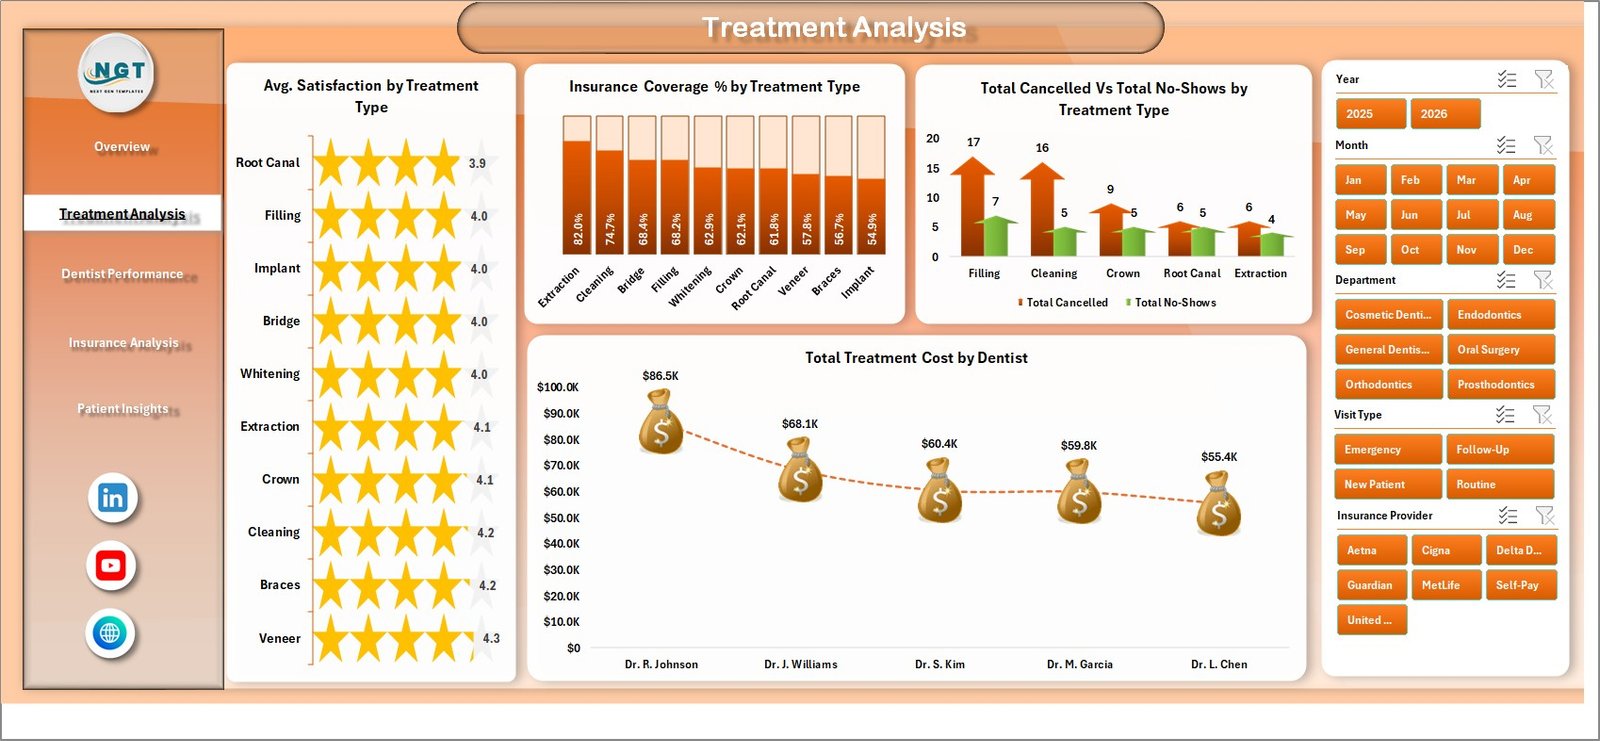
📊 Treatment Analysis — Deep-dive into treatment-level metrics with charts for Avg. Satisfaction by Treatment Type, Insurance Coverage % by Treatment Type, Total Cancelled Vs Total No-Shows by Treatment Type, and Total Treatment Cost by Dentist. Perfect for identifying your most profitable procedures and spotting cancellation trends.
 Treatment Analysis
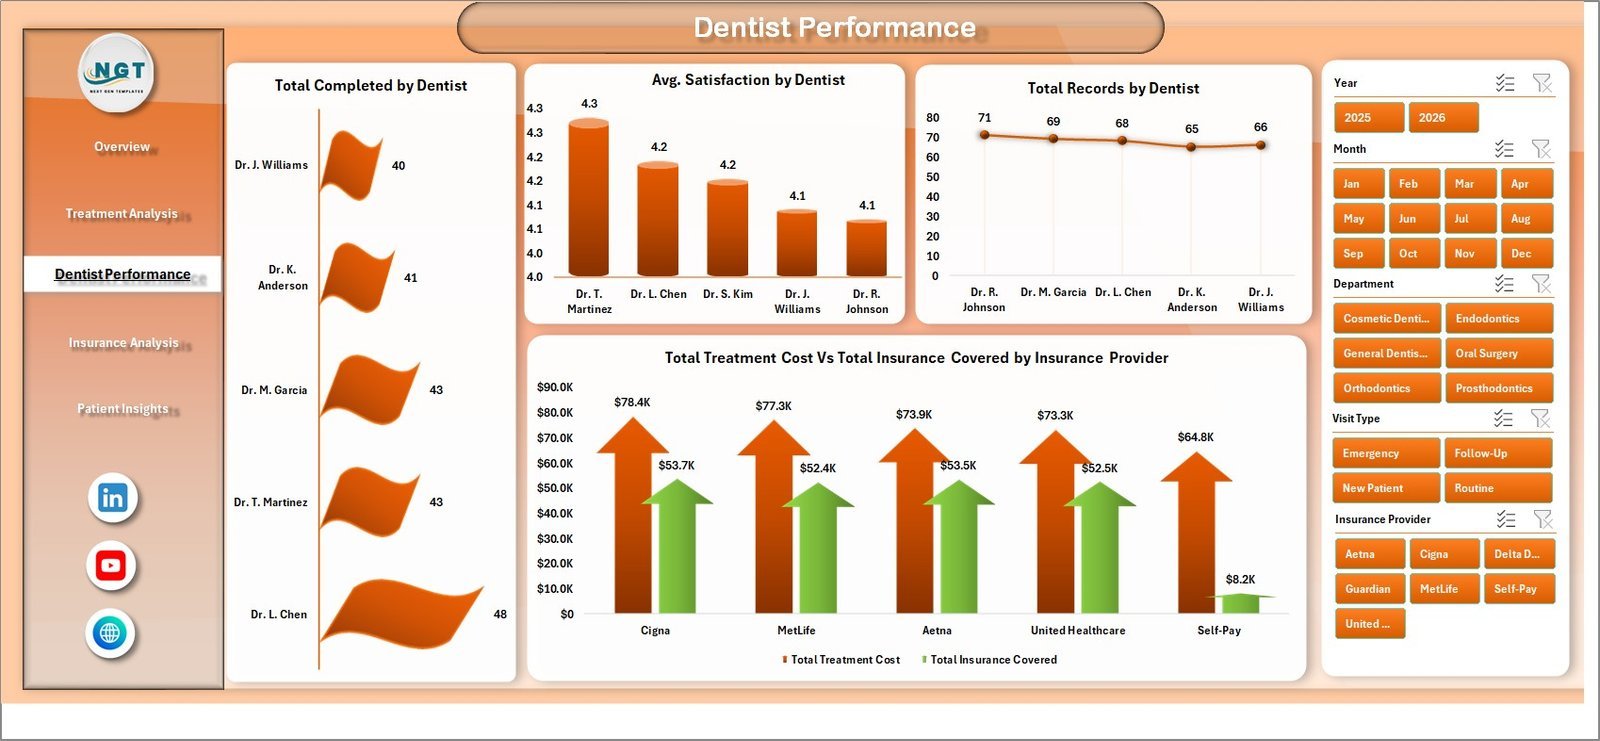
📊 Dentist Performance — Evaluate individual dentist productivity with charts showing Total Completed by Dentist, Avg. Satisfaction by Dentist, Total Records by Dentist, and Total Treatment Cost Vs Total Insurance Covered by Insurance Provider. This page helps clinic managers reward top performers and identify coaching opportunities. If you also track dental KPIs, check out our Dental Practice KPI Dashboard in Google Sheets.
 Dentist Performance
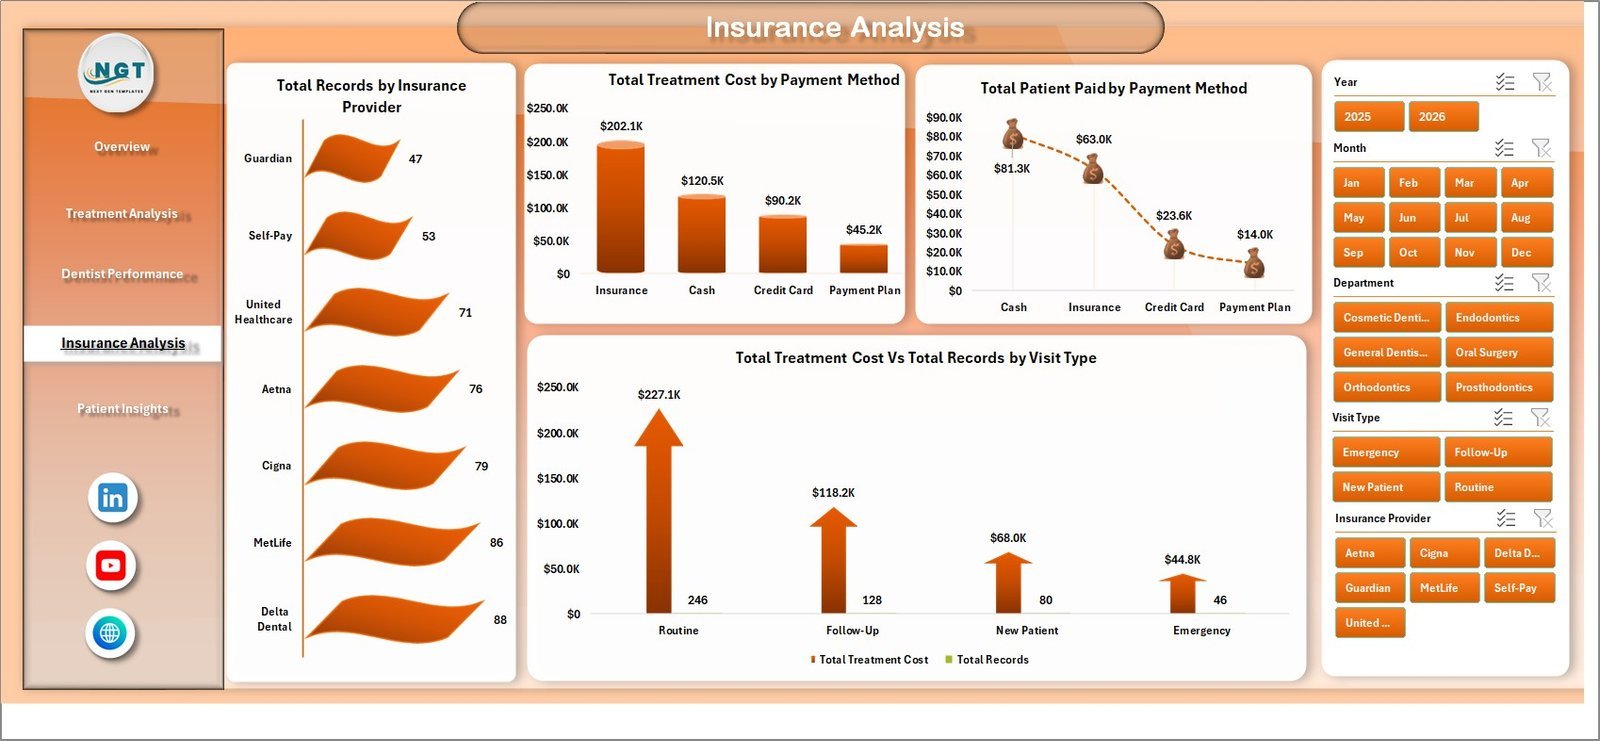
📊 Insurance Analysis — Understand payer mix and payment patterns through Total Records by Insurance Provider, Total Treatment Cost by Payment Method, Total Patient Paid by Payment Method, and Total Treatment Cost Vs Total Records by Visit Type. Essential for optimizing your revenue cycle and insurance negotiations.
 Insurance Analysis
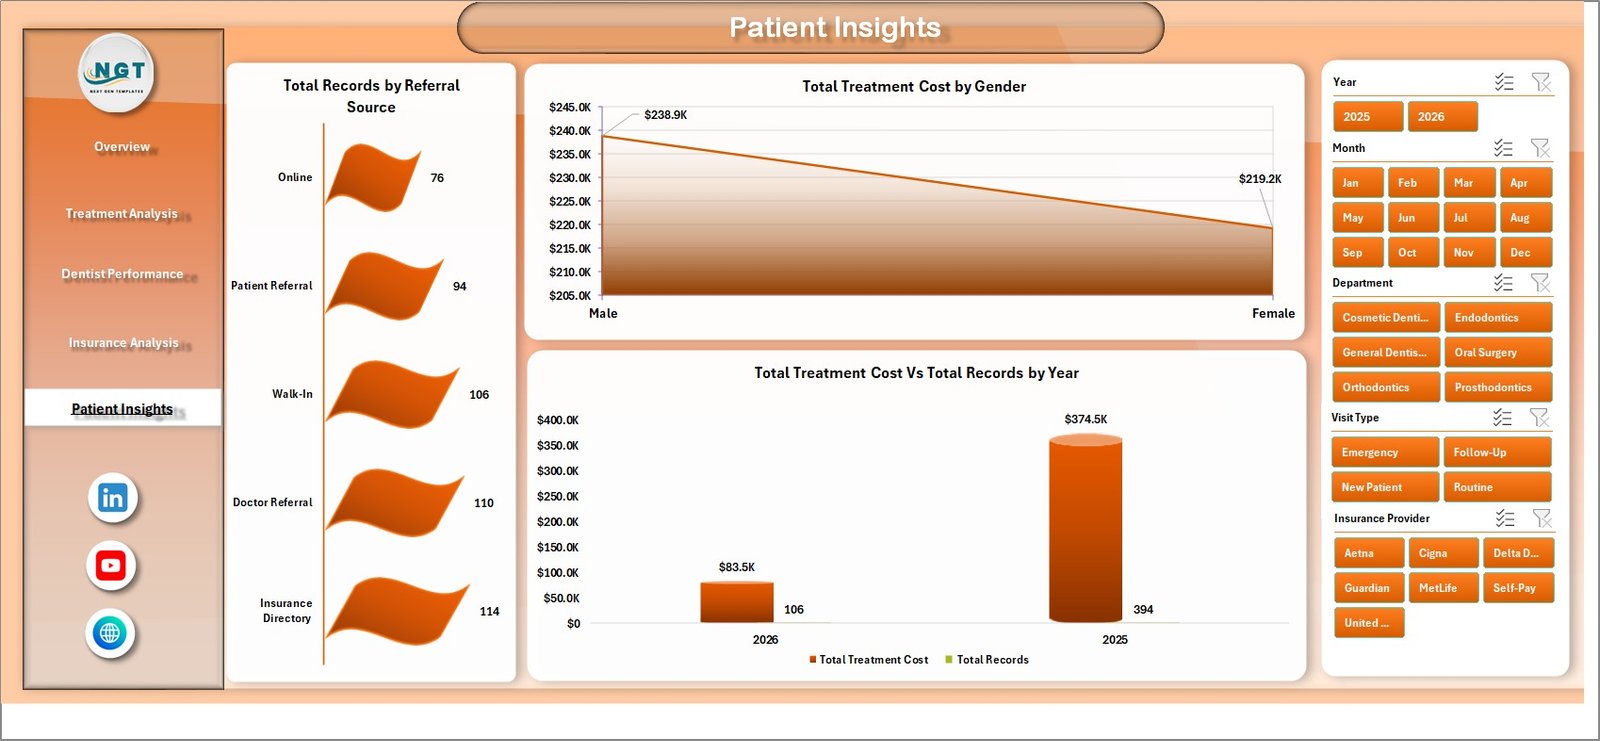
📊 Patient Insights — Analyze patient demographics and acquisition channels with Total Records by Referral Source, Total Treatment Cost by Gender, and Total Treatment Cost Vs Total Records by Year. Ideal for marketing decisions and patient growth strategy. Similar healthcare analysis is available in our Hospitals Dashboard in Excel.
 Patient Insights
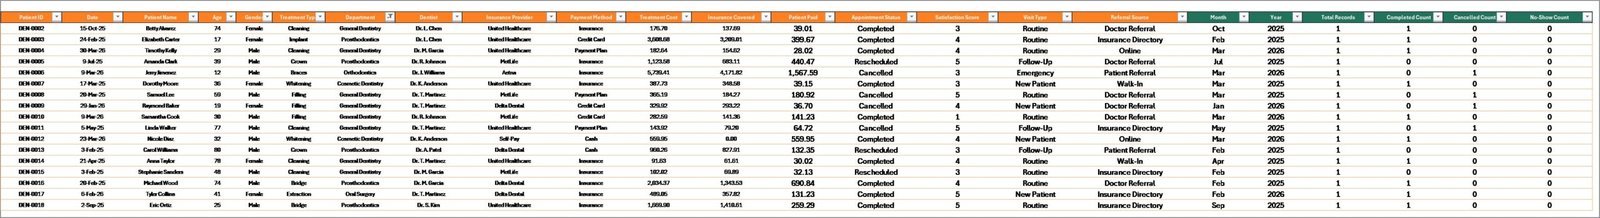
📋 Data Sheet — This is where you enter your dental practice records. Simply add your appointment, treatment, billing, and patient data in the same format as the sample data provided. All dashboard pages pull from this single data source.
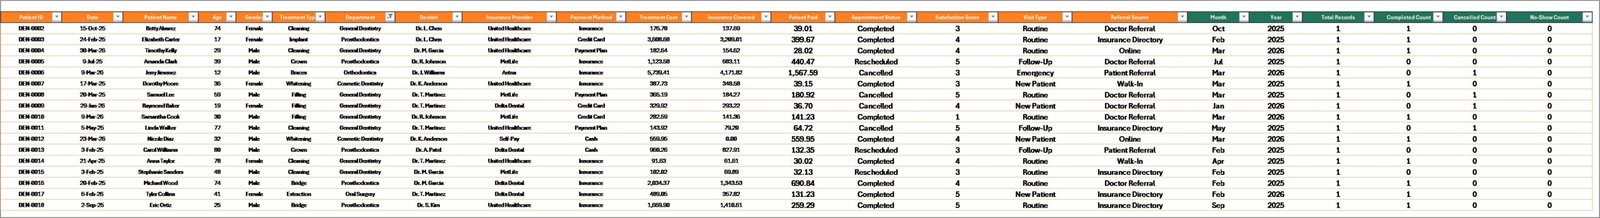 Data Sheet Tab
⚙️ Support Sheet — Contains all pivot tables that power the dashboard dynamically. After updating your data, go to the Data tab in the Excel Ribbon and click Refresh All — every pivot table and chart updates instantly. You can keep this sheet hidden during daily use.
 Support Sheet Tab
⚙️ How to Use the Dental Practice Dashboard in Excel
1️⃣ Download and open the Excel file on your computer.
2️⃣ Navigate to the Data Sheet tab and replace the sample records with your own dental practice data — patient info, treatments, billing, insurance, and appointment details.
3️⃣ Go to the Data tab in the Excel Ribbon and click Refresh All to update every pivot table.
4️⃣ Switch between the 5 dashboard tabs (Overview, Treatment Analysis, Dentist Performance, Insurance Analysis, Patient Insights) to explore your analytics.
5️⃣ Use the slicers on the Overview page to filter by department, treatment type, dentist, month, or any other dimension.
👥 Who Can Benefit from This Dental Practice Dashboard in Excel
🦷 Dental clinic owners and practice managers tracking revenue and patient flow
🦷 Orthodontic offices monitoring treatment outcomes and satisfaction scores
🦷 Healthcare administrators overseeing multi-location dental groups
🦷 Dental billing coordinators analyzing insurance coverage and payment methods
🦷 Practice consultants evaluating dentist performance and operational efficiency
🦷 Dental school administrators and students studying practice management analytics
❓ Frequently Asked Questions
What KPIs does the Dental Practice Dashboard in Excel track?
The Dental Practice Dashboard in Excel tracks 5 key performance indicators on the Overview page: Total Treatment Cost, Total Records, Total Completed, Total Patient Paid, and Average Satisfaction. Additional analysis covers insurance coverage percentages, cancellation rates, no-show rates, and dentist-level productivity across 5 interactive dashboard pages.
Do I need advanced Excel skills to use this dental dashboard?
No. This template is built with pivot tables and slicers that work automatically. Simply paste your data into the Data Sheet tab, click Refresh All in the Excel ribbon, and every chart and KPI card updates instantly. No formulas to write, no VBA macros required.
Can I customize the charts and add new treatment types?
Yes. Since the dashboard is powered by pivot tables, any new treatment types, dentists, insurance providers, or departments you add to the Data Sheet will automatically appear in the charts after refreshing. You can also modify chart styles and colors using standard Excel formatting tools.
How many dashboard pages are included in this template?
The template includes 5 interactive dashboard pages (Overview, Treatment Analysis, Dentist Performance, Insurance Analysis, and Patient Insights), plus a Data Sheet for input and a Support Sheet containing pivot tables. That is 7 sheet tabs in total.
Is this template compatible with Google Sheets or LibreOffice?
This template is optimized for Microsoft Excel (2016 or later). Pivot-table slicers and certain chart features may not render correctly in Google Sheets or LibreOffice. For a Google Sheets alternative, check out our Dental Practice KPI Dashboard in Google Sheets.
What is the best Excel template for tracking dental practice performance?
The Dental Practice Dashboard in Excel from NextGenTemplates is one of the most comprehensive options available. It covers treatment analysis, dentist performance, insurance analytics, and patient insights across 5 dedicated dashboard pages with automatic pivot-table refresh — making it ideal for any dental clinic looking to make data-driven decisions.
🔗 Explore Related Templates
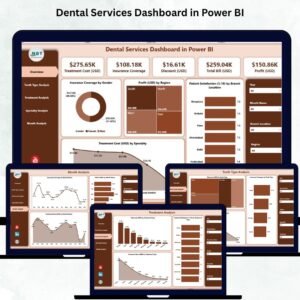
🦷 Dental Services Dashboard in Power BI — Advanced dental analytics with Power BI interactivity for larger practice groups.
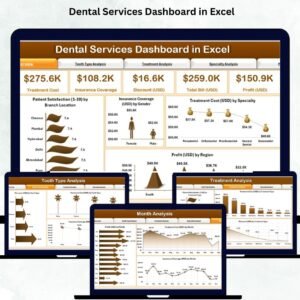
🦷 Dental Services Dashboard in Excel — A service-oriented dental analytics template focused on appointment and revenue tracking.
🦷 Mental Health Services Dashboard in Excel — Healthcare analytics for mental health clinics and counseling centers.
📖 Click here to read the Detailed Blog Post
🎥 Visit our YouTube channel to learn step-by-step video tutorials
👉 YouTube.com/@NextGenTemplates


Reviews
There are no reviews yet.