


🔑 Key Features of Amazon FBA Seller Dashboard in Google Sheets
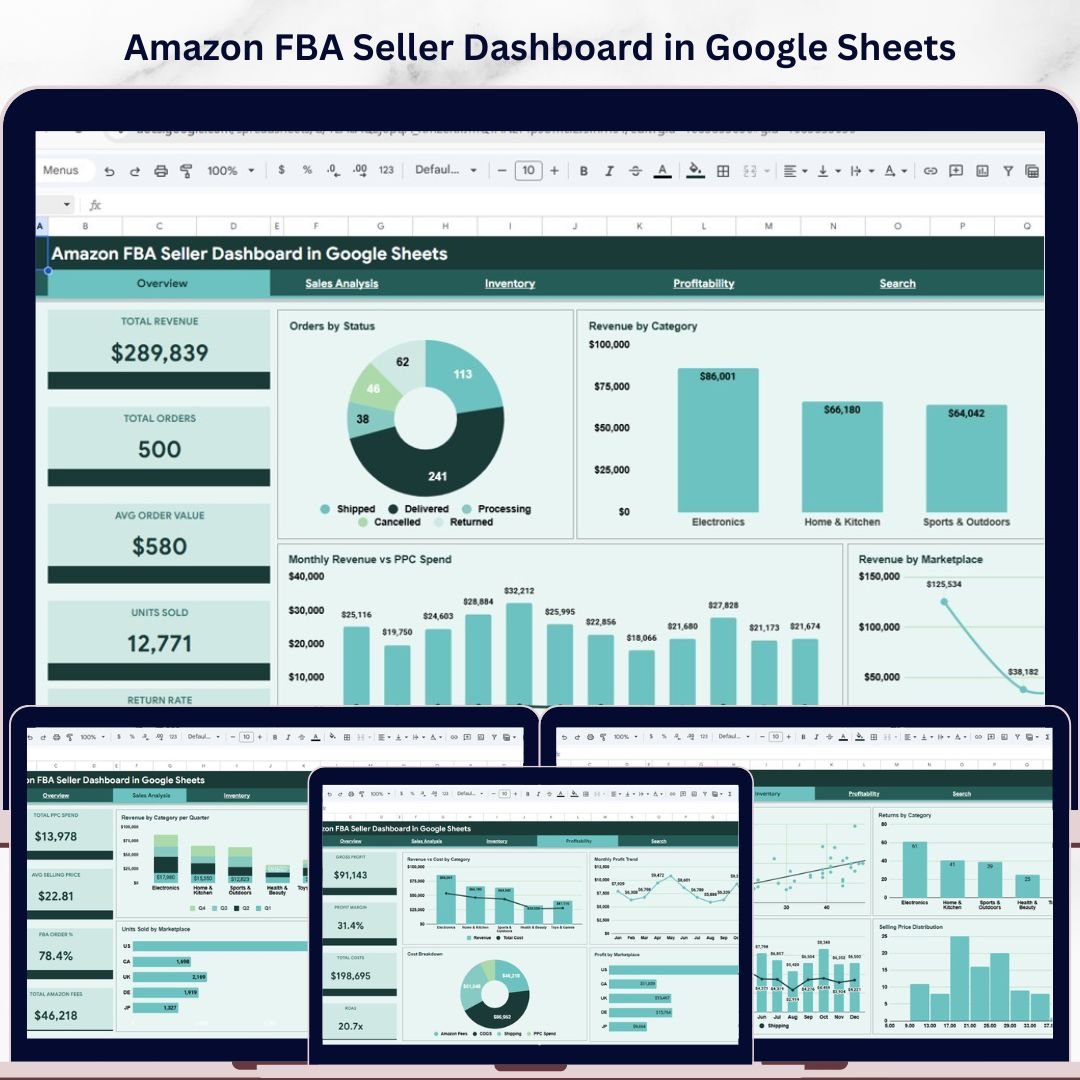
Amazon FBA Seller Dashboard in Google Sheets is a comprehensive, ready-to-use analytics template designed specifically for Amazon FBA sellers who want to monitor revenue, orders, profitability, inventory costs, PPC advertising spend, and marketplace performance — all from one centralized Google Sheets workbook. This template includes 6 interactive sheet tabs covering Overview, Sales Analysis, Inventory, Profitability, a Search Page, and a Data Sheet — making it one of the most complete Google Sheets Dashboard Templates available for Amazon FBA sellers.
Whether you run a private label business or manage wholesale products on Amazon, this dashboard transforms your raw FBA order data into actionable visual insights without any complex setup. Simply paste your data into the Data sheet and all 4 dashboard pages update instantly with dynamic charts and KPI cards 🚀. If you prefer a desktop application, check out our Amazon FBA Seller Dashboard in Excel or Amazon FBA Seller Dashboard in Power BI as well.
📦 What’s Inside the Amazon FBA Seller Dashboard in Google Sheets
This template contains 6 professionally designed sheet tabs that work together as a complete Amazon FBA analytics system:
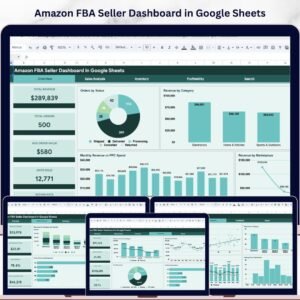
📊 Overview Page — The main landing page features 5 high-level KPI cards showing Total Revenue, Total Orders, Avg Order Value, Units Sold, and Return Rate. Below the cards, interactive charts display Orders by Status showing how orders are distributed across fulfillment stages, Revenue by Category breaking down income across product types, Monthly Revenue vs PPC Spend tracking advertising ROI trends over time, and Revenue by Marketplace identifying which Amazon marketplaces drive the most sales. Multiple slicers allow you to filter the entire dashboard instantly.
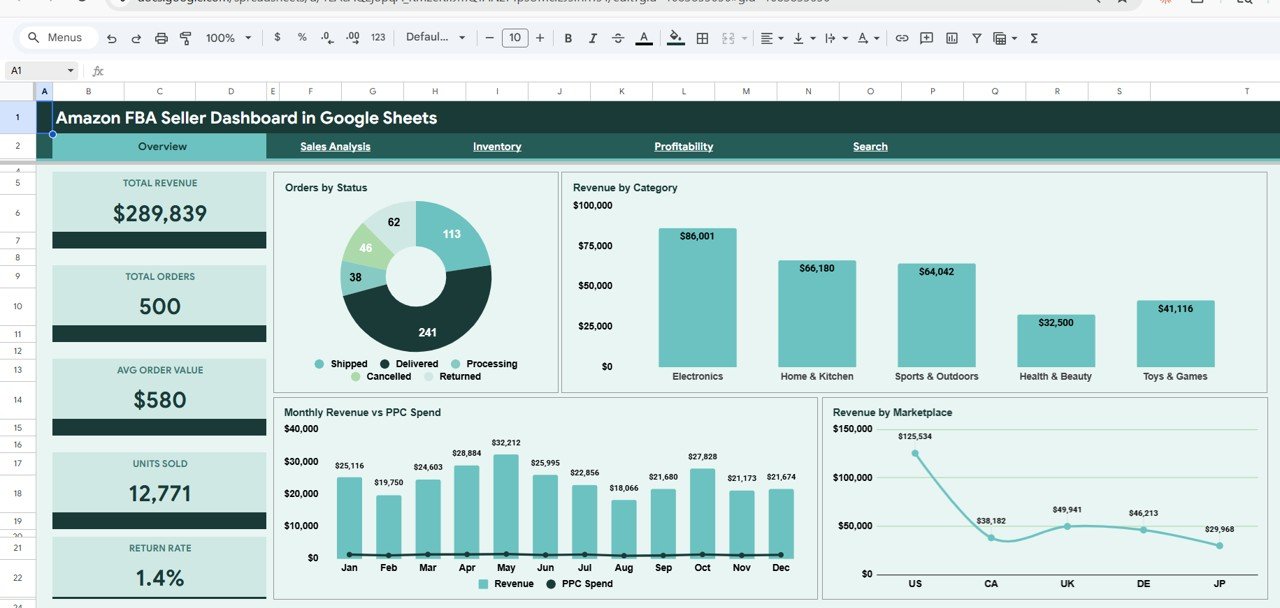 Overview Page
📈 Sales Analysis — This page dives deep into sales metrics with KPI cards for Total PPC Spend, Avg Selling Price, FBA Order %, and Total Amazon Fees. Charts include Revenue by Category per Quarter analyzing seasonal performance across product types, Monthly Units Sold vs Returned tracking return trends, Units Sold by Marketplace comparing volume across Amazon regions, and FBA vs FBM Orders showing fulfillment method distribution.
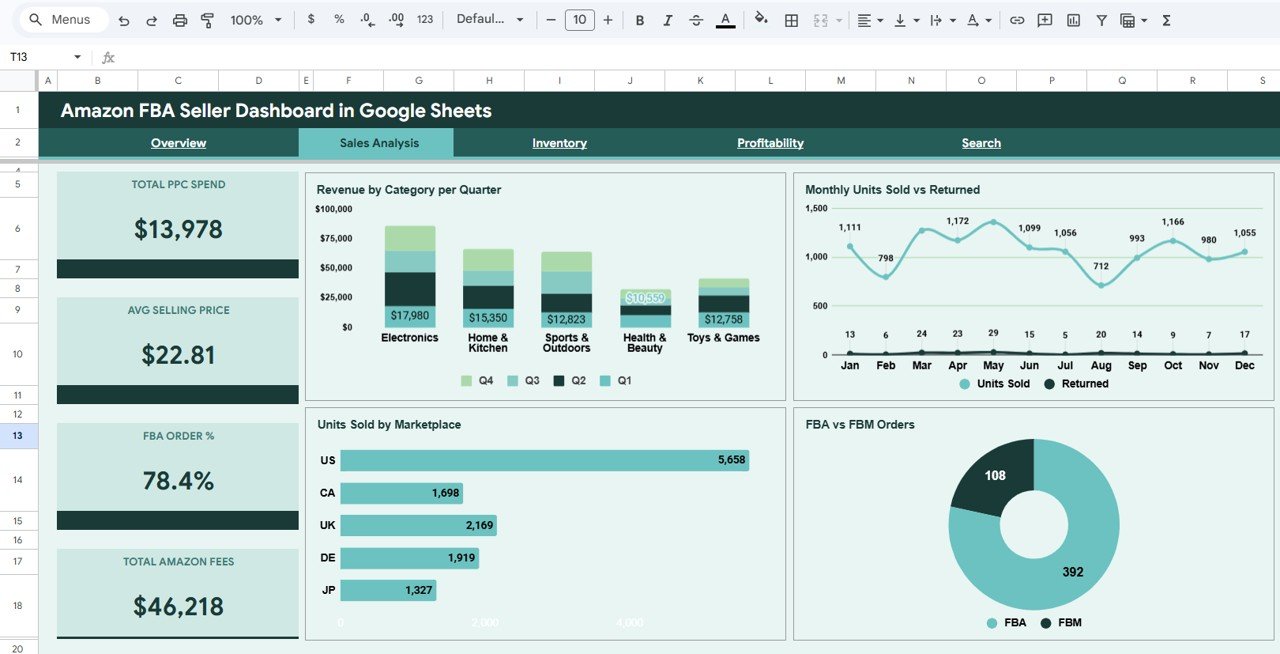 Sales Analysis
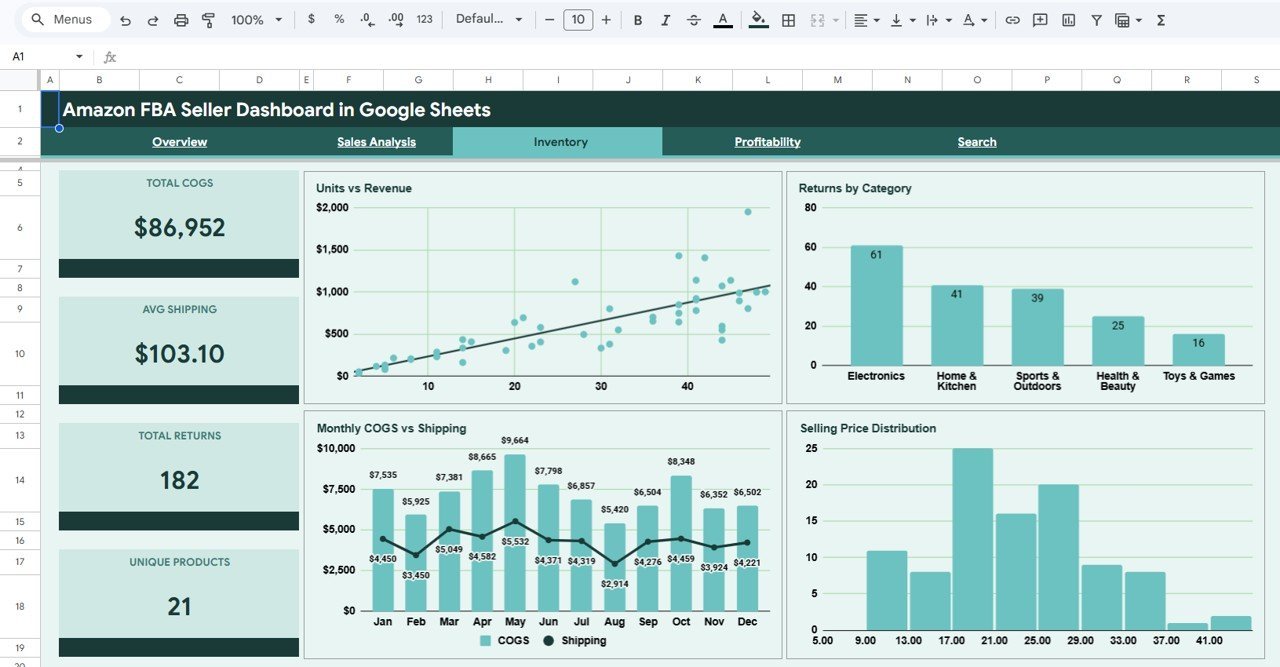
📦 Inventory — Analyze your inventory and cost metrics with KPI cards for Total COGS, Avg Shipping, Total Returns, and Unique Products. Charts display Units vs Revenue comparing volume against income, Returns by Category identifying problem product lines, Monthly COGS vs Shipping tracking cost trends over time, and Selling Price Distribution showing how your products are priced across ranges.
 Inventory
💰 Profitability — The most critical page for any Amazon FBA seller features KPI cards for Gross Profit, Profit Margin, Total Costs, and ROAS (Return on Ad Spend). Charts include Revenue vs Cost by Category comparing income against expenses per product type, Monthly Profit Trend tracking your bottom line over time, Cost Breakdown showing the proportion of Amazon fees, COGS, shipping, and PPC spend, and Profit by Marketplace revealing which Amazon regions deliver the highest margins.
Profitability🔍 Search Page — This powerful lookup sheet lets you search for any specific order by selecting the Order ID from the dropdown. It instantly displays all the details including Order ID, Date, ASIN, Product Name, Category, Marketplace, Units Ordered, Units Returned, Selling Price, Amazon Fees, Cost of Goods, Shipping Cost, PPC Spend, and Revenue.
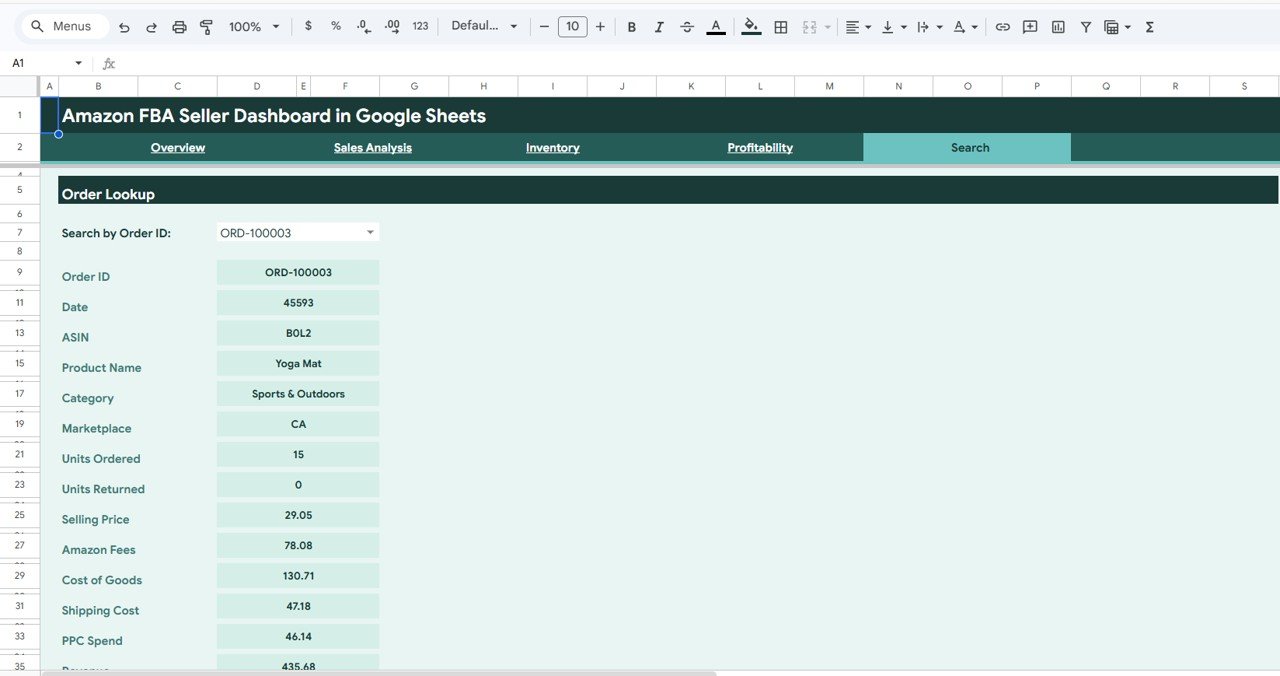 Search Sheet Tab
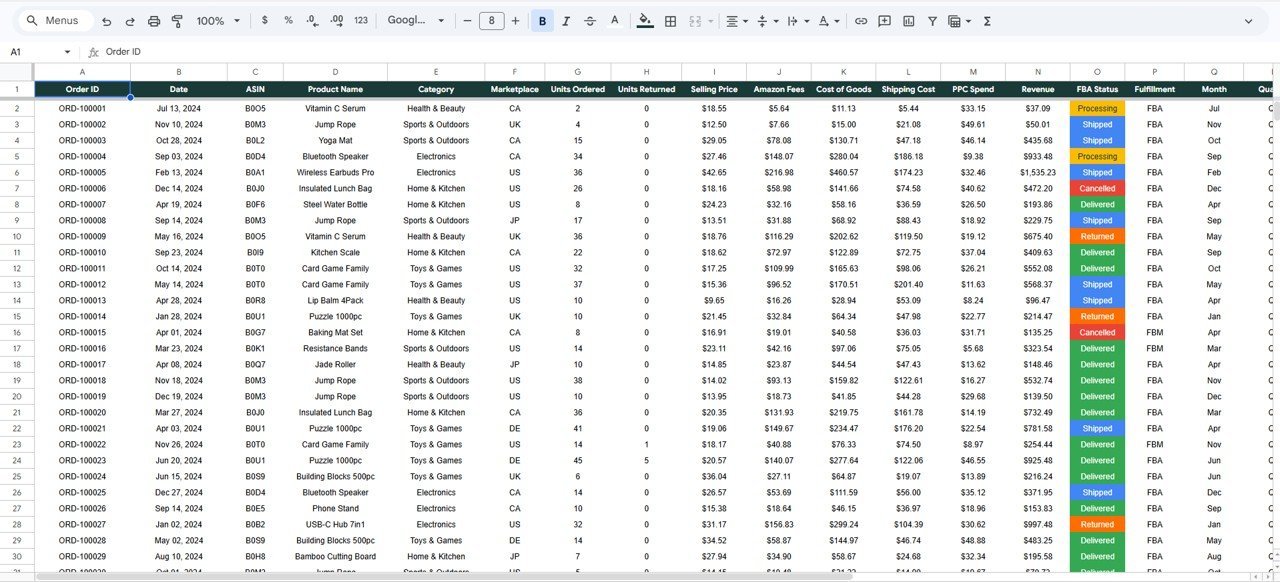
📋 Data Sheet — This is where you enter your Amazon FBA order data. Simply paste your data in the same format as the sample and all dashboard pages update automatically.
 Data Sheet Tab
⚙️ How to Use the Amazon FBA Seller Dashboard in Google Sheets
1️⃣ Open the PDF guide included in your download and click the Google Sheets copy link to create your own editable copy in Google Drive.
2️⃣ Go to the Data Sheet tab and replace the sample data with your actual Amazon FBA order data in the same column format.
3️⃣ All 4 dashboard pages, the Search page, KPI cards, and charts update automatically — no manual editing required.
4️⃣ Use the slicers on each dashboard page to filter data by category, marketplace, fulfillment method, and more.
5️⃣ Use the Search page to look up individual order details instantly by selecting an Order ID.
👥 Who Can Benefit from This Amazon FBA Seller Dashboard
📌 Amazon FBA Sellers — Track revenue, orders, PPC spend, and profitability from one centralized dashboard.
📌 E-commerce Analysts — Monitor multi-marketplace FBA data with interactive charts and filters.
📌 Private Label Brand Owners — Analyze which product categories and ASINs drive the most revenue and profit.
📌 Amazon Advertising Managers — Measure PPC spend effectiveness with ROAS tracking and monthly ad spend trends.
📌 Freelancers & Consultants — Manage client Amazon FBA accounts with professional analytics reporting.
Explore more analytics tools in our Google Sheets Dashboard Templates collection and our Excel Dashboard Templates library.
❓ Frequently Asked Questions
What KPIs does the Amazon FBA Seller Dashboard in Google Sheets track?
The Amazon FBA Seller Dashboard in Google Sheets tracks 17+ key metrics including Total Revenue, Total Orders, Avg Order Value, Units Sold, Return Rate, Total PPC Spend, Avg Selling Price, FBA Order %, Total Amazon Fees, Total COGS, Avg Shipping, Unique Products, Gross Profit, Profit Margin, Total Costs, and ROAS across 4 interactive dashboard pages.
Do I need advanced Google Sheets skills to use this Amazon FBA dashboard?
No. Simply paste your Amazon FBA order data into the Data Sheet tab and all charts, KPI cards, and dashboard pages update automatically. No formulas, scripts, or technical knowledge required.
What is the best Google Sheets dashboard for Amazon FBA sellers?
The Amazon FBA Seller Dashboard in Google Sheets from NextGenTemplates is purpose-built for Amazon FBA sellers. It includes 4 interactive dashboard pages covering overview, sales analysis, inventory, and profitability — plus a search page and data sheet — making it one of the most comprehensive Amazon FBA analytics solutions available in Google Sheets format.
Can I track PPC advertising spend and ROAS with this dashboard?
Yes. The Sales Analysis page tracks Total PPC Spend and Monthly Revenue vs PPC Spend trends. The Profitability page calculates ROAS (Return on Ad Spend) automatically so you can measure exactly how much revenue your advertising generates per dollar spent.
Can I compare FBA vs FBM order performance?
Yes. The Sales Analysis page includes an FBA vs FBM Orders chart that shows the distribution between Fulfillment by Amazon and Fulfillment by Merchant orders so you can evaluate which fulfillment method performs better.
Is this template also available in Excel or Power BI?
Yes. We also offer the Amazon FBA Seller Dashboard in Excel and Amazon FBA Seller Dashboard in Power BI with similar analytics features optimized for those platforms.
🔗 Explore Related Templates
📎 Amazon FBA Seller Dashboard in Excel — Track Amazon FBA sales, costs, PPC spend, and profitability with 5 interactive Excel dashboard pages.
📎 Amazon FBA Seller Dashboard in Power BI — Advanced Power BI version with drill-through capabilities and interactive filters for enterprise-level Amazon FBA analytics.
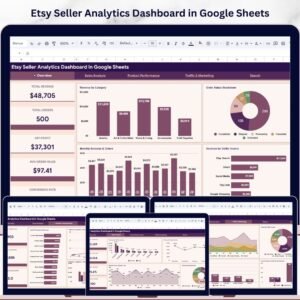
📎 Etsy Seller Analytics Dashboard in Google Sheets — Track Etsy sales, traffic, product performance, and costs with 4 interactive Google Sheets dashboard pages.
📖 Click here to read the Detailed Blog Post about Amazon FBA Seller Dashboard in Google Sheets
Watch the step-by-step video tutorial:


Reviews
There are no reviews yet.