Managing port operations in today’s fast-moving global trade environment is not easy. Every day, ports handle massive cargo volumes, multiple shipping lines, and complex logistics activities. However, when your data is scattered across different systems, it becomes difficult to track performance, identify delays, and control costs.
👉 What if you could manage everything in one powerful dashboard?
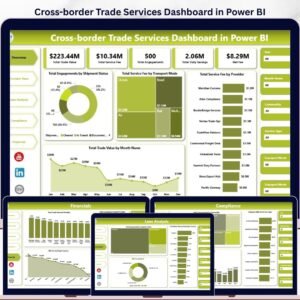
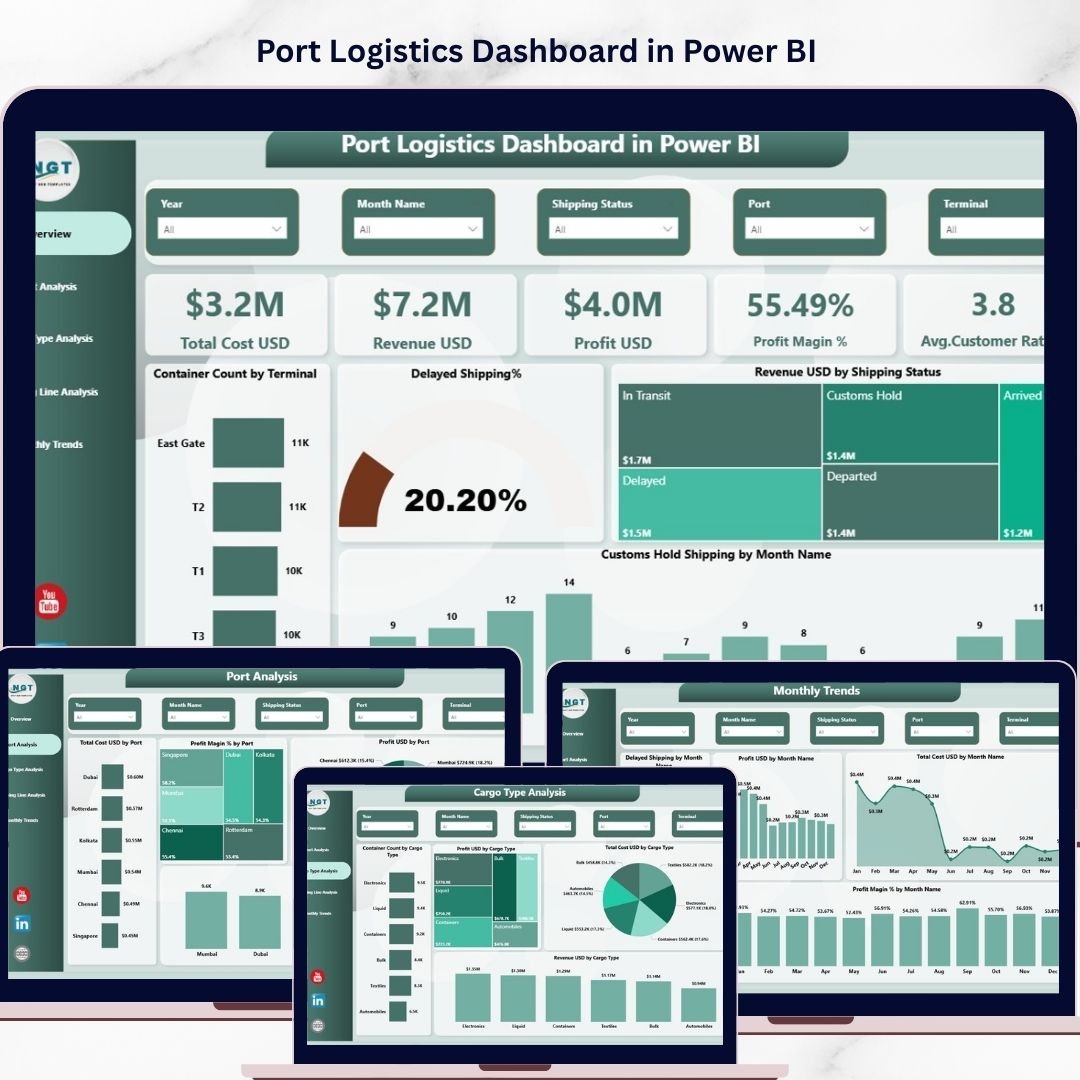
Introducing the Port Logistics Dashboard in Power BI — a ready-to-use, interactive solution designed to help you monitor, analyze, and optimize your logistics operations in real time. This dashboard transforms raw data into actionable insights so you can make faster, smarter, and more profitable decisions.
✨ Key Features of Port Logistics Dashboard in Power BI
📊 5 Interactive Dashboard Pages – Get complete control with dedicated pages for Overview, Port Analysis, Cargo Analysis, Shipping Line Analysis, and Monthly Trends.
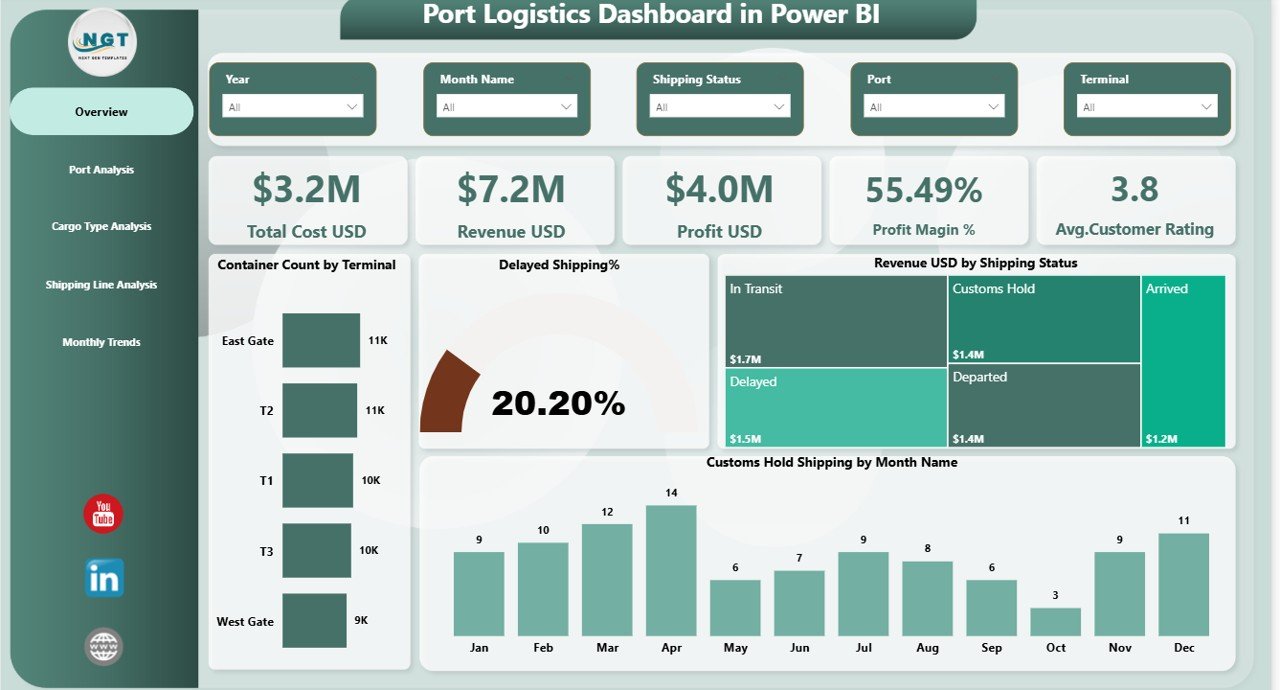
📈 Powerful KPI Cards – Track Total Cost, Revenue, Profit, Profit Margin, and Customer Rating instantly.
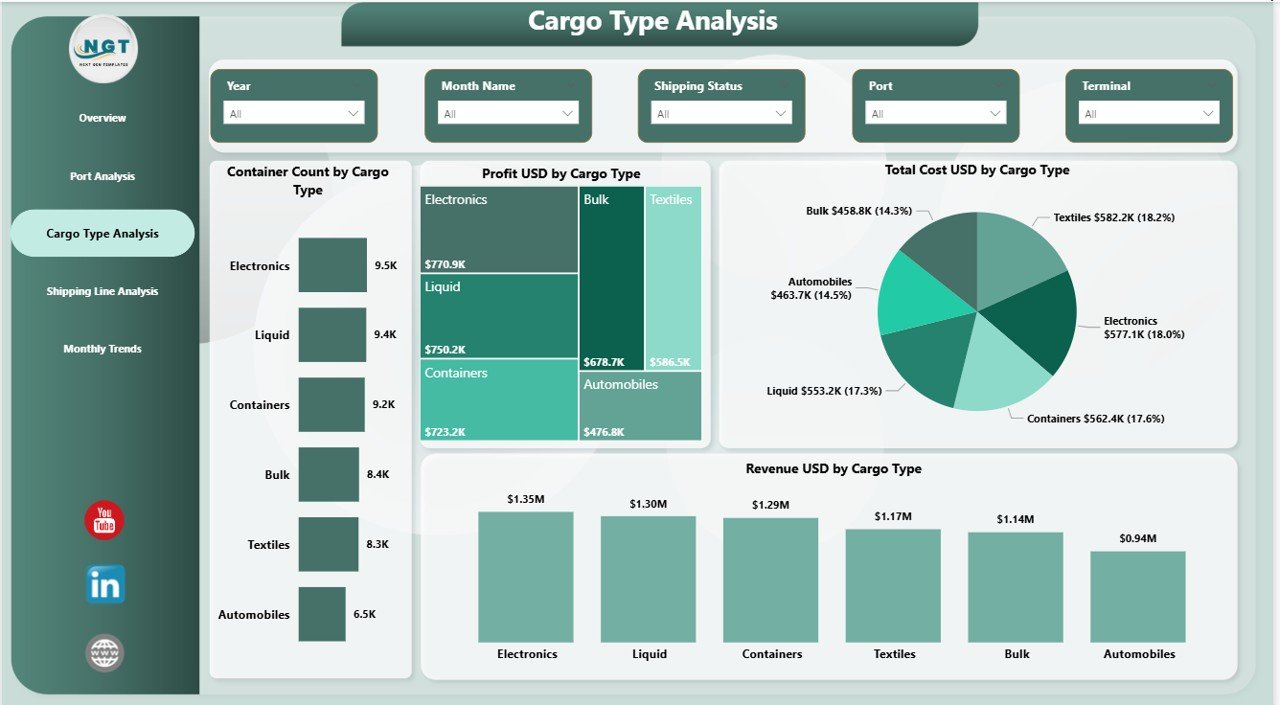
📦 Container & Cargo Insights – Analyze container count, cargo types, and performance to optimize operations.
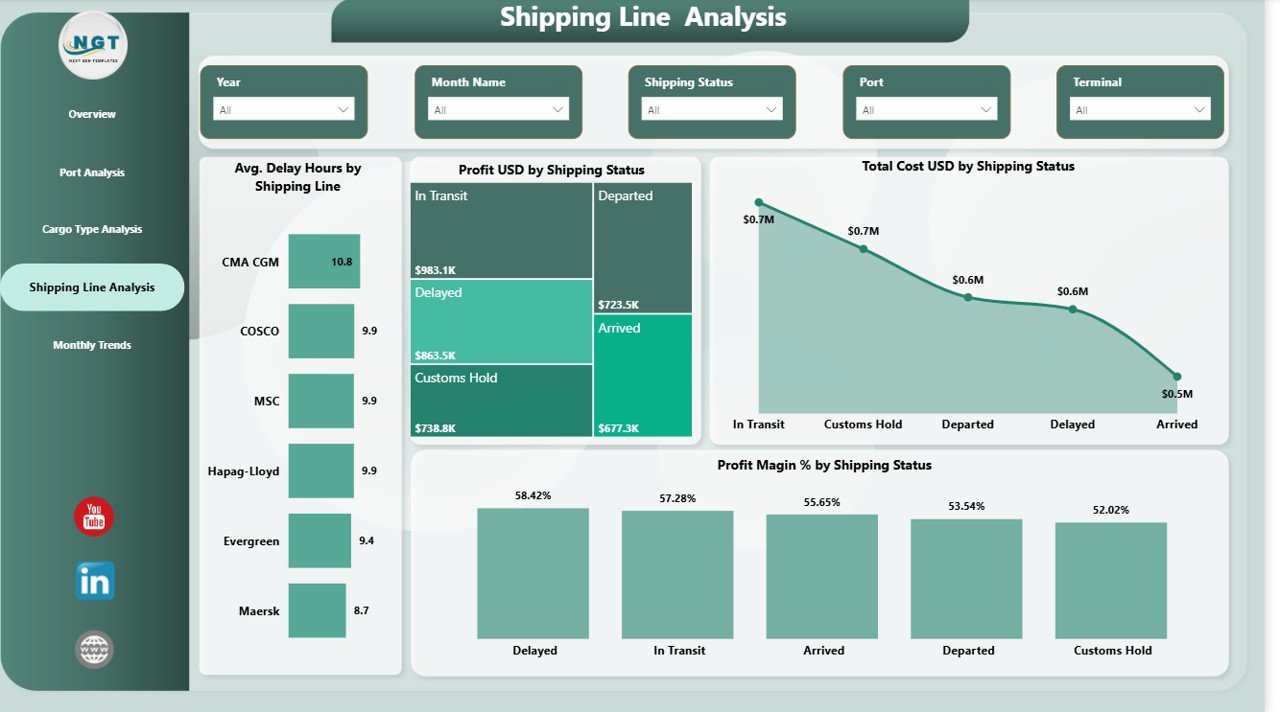
🚢 Shipping Performance Tracking – Monitor delay hours, shipping status, and partner performance easily.
📉 Delay Monitoring – Identify delayed shipments and bottlenecks quickly to reduce inefficiencies.
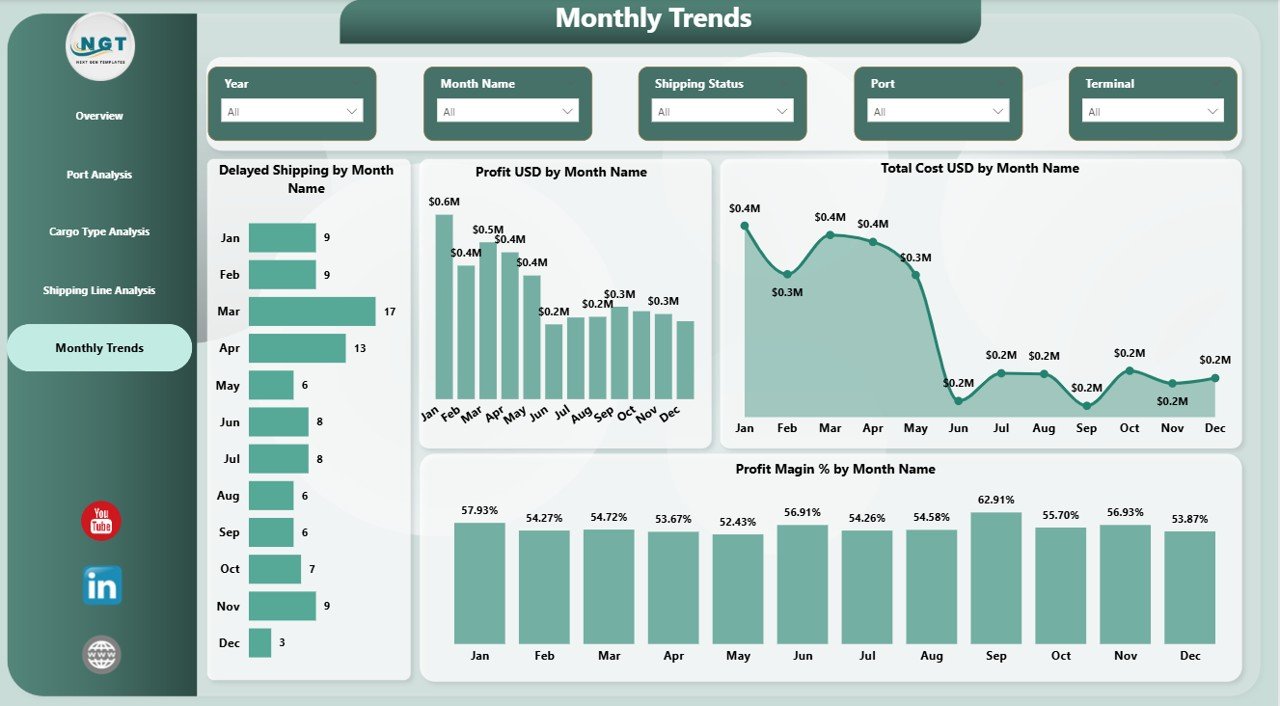
📅 Monthly Trend Analysis – Track cost, profit, and delay trends over time for better planning.
🎯 Interactive Filters (Slicers) – Filter data by port, cargo type, shipping line, or time period.
💡 Data-Driven Insights – Turn complex logistics data into simple, actionable visuals.
📂 What’s Inside the Port Logistics Dashboard in Power BI
📄 Overview Page – Your main command center with KPI cards and high-level insights.
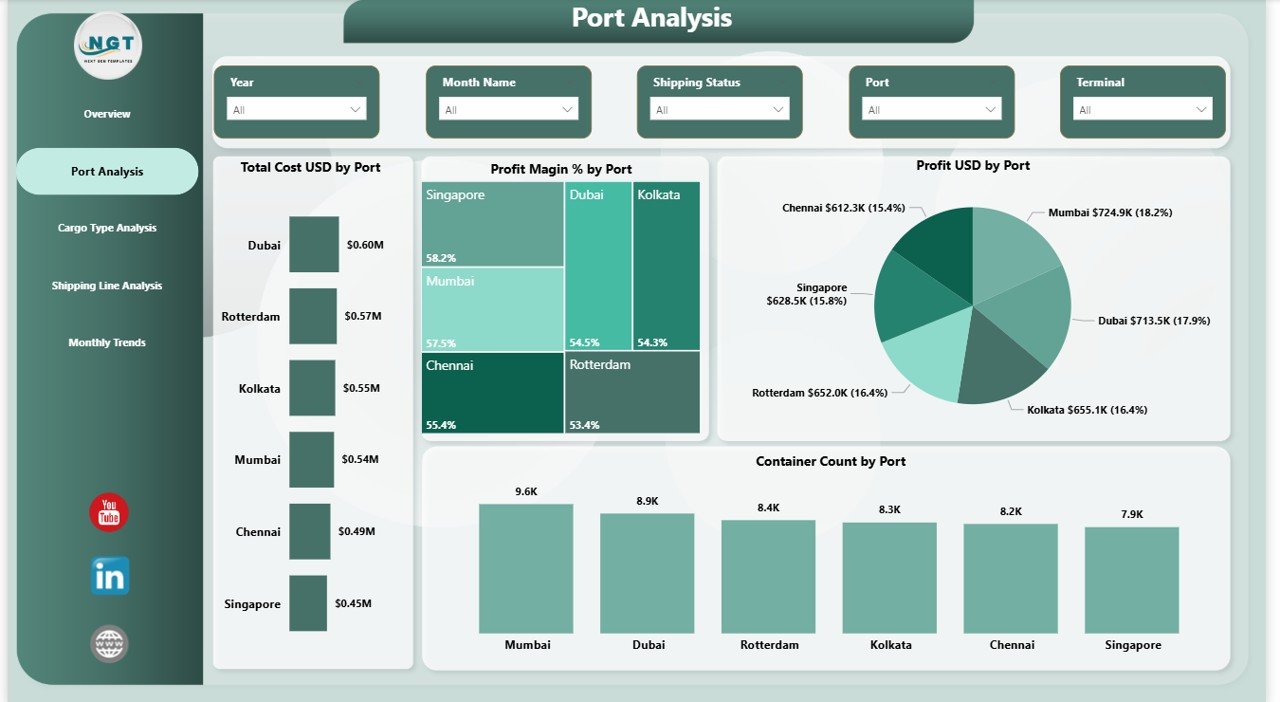
⚓ Port Analysis Page – Compare cost, profit, and container volume across ports.
📦 Cargo Type Analysis Page – Understand which cargo types generate the most revenue and profit.
🚢 Shipping Line Analysis Page – Evaluate shipping partners and identify delays.
📅 Monthly Trend Page – Track performance changes and seasonal trends over time.
📊 Dynamic Visual Charts – Includes bar charts, trend charts, and performance visuals.
🪜 How to Use the Port Logistics Dashboard in Power BI
1️⃣ Import your logistics data into Power BI
2️⃣ Connect your dataset to the dashboard
3️⃣ Use slicers to filter by port, cargo type, or time
4️⃣ Analyze KPI cards and charts
5️⃣ Identify delays, costs, and performance gaps
6️⃣ Take data-driven actions to improve operations
👉 Within minutes, you can transform your logistics data into powerful insights.
💼 Who Can Benefit from This Port Logistics Dashboard
🚢 Port Authorities – Monitor and optimize port operations efficiently
📦 Logistics Managers – Track shipments, delays, and cargo performance
🚛 Supply Chain Professionals – Improve operational visibility and planning
📊 Business Analysts – Generate insights and support decision-making
🌍 Shipping Companies – Evaluate performance and reduce inefficiencies
🏭 Import/Export Businesses – Gain full control over logistics costs and performance
This dashboard is not just a reporting tool—it’s a complete decision-making system. It helps you reduce delays, improve efficiency, and increase profitability by giving you full visibility into your logistics operations.
If you want to stay competitive in the logistics industry, this dashboard is your ultimate solution.
Click here to read the Detailed blog post
Watch the step-by-step video tutorial: