


In today’s booming esports industry, data is the real gamechanger. Millions of viewers, multiple streaming platforms, and diverse revenue streams make performance tracking complex. However, without the right tools, you risk missing critical insights that can drive growth.
That’s exactly where the Esports Streaming Dashboard in Power BI steps in! 🎯
This powerful, ready-to-use dashboard helps you track revenue, costs, profit, and viewer engagement in one centralized system. Instead of juggling multiple spreadsheets, you get a clear, visual, and interactive solution that simplifies decision-making and boosts performance.
Whether you’re a streamer, esports team, or analyst, this dashboard transforms your data into actionable insights—helping you grow faster and smarter. 🚀
📊 Key Features of Esports Streaming Dashboard in Power BI
✨ All-in-One Performance Tracking – Monitor cost, revenue, profit, and viewer metrics in one place.
📈 Interactive KPI Cards – Instantly view Total Revenue, Profit, Profit Margin %, and Avg. Viewers.
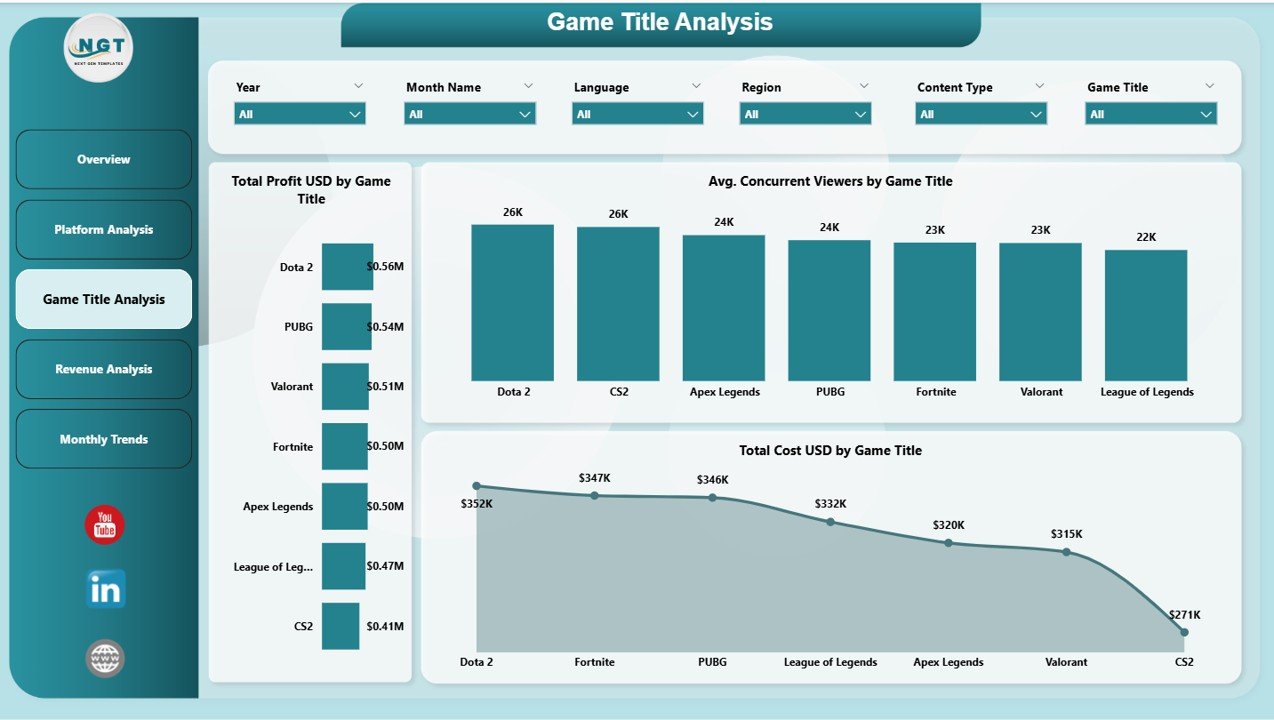
🎮 Game Performance Insights – Identify top-performing games driving engagement and revenue.
📺 Platform Analysis – Compare platforms to see where your content performs best.
🌍 Regional Insights – Understand audience behavior across different regions.
💸 Revenue Breakdown – Analyze ad revenue, subscriptions, and donations easily.
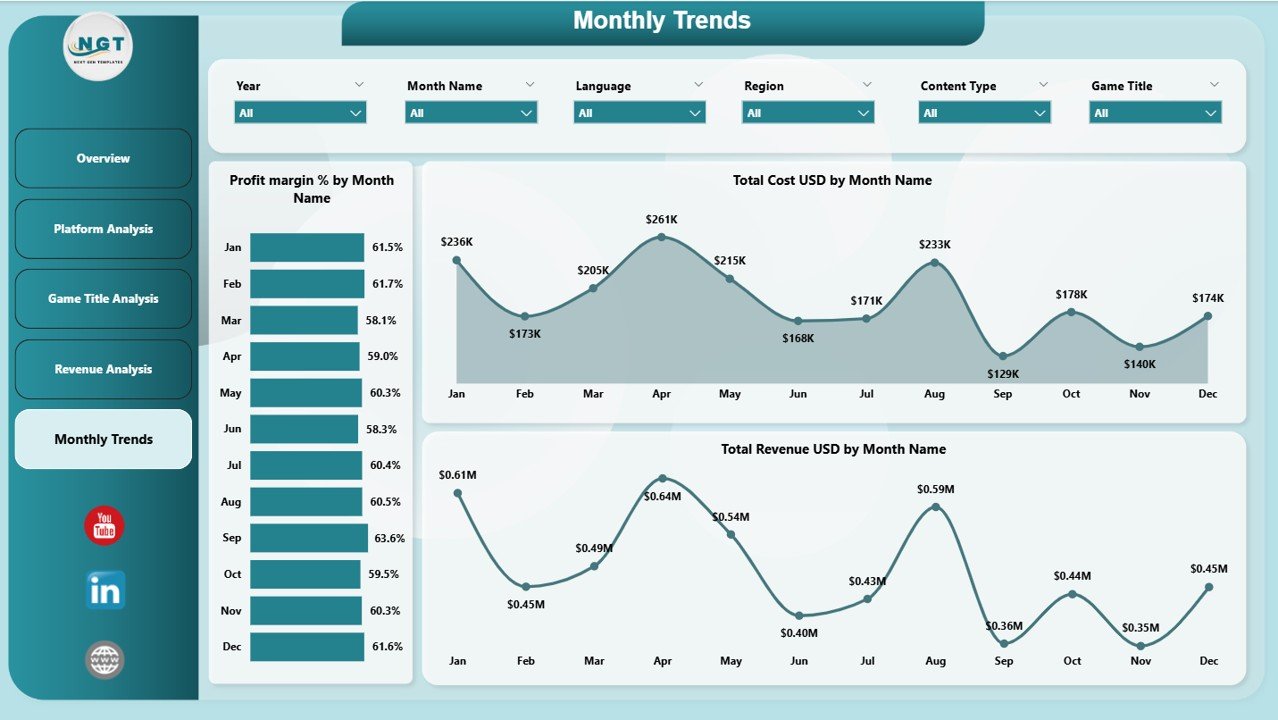
📅 Monthly Trends Analysis – Track growth patterns and performance over time.
⚡ Real-Time Updates – Make quick decisions with dynamic and updated data.
🎯 User-Friendly Interface – Easy navigation with slicers and filters.
📂 What’s Inside the Esports Streaming Dashboard in Power BI
This dashboard includes 5 powerful and interactive pages designed for deep insights:

📊 Overview Page – Get a complete snapshot with KPIs and performance charts.
📺 Platform Analysis – Compare revenue, cost, and profit across platforms.
🎮 Game Title Analysis – Analyze which games bring the most viewers and profit.
💰 Revenue Analysis – Break down revenue sources by platform, region, and tier.
📅 Monthly Trends – Track performance changes and growth over time.
Each page is designed to give you clear, actionable insights for better decisions. 🔍
⚙️ How to Use the Esports Streaming Dashboard in Power BI
Getting started is simple and quick:
📥 Import Your Data – Load your streaming data into Power BI.
🔗 Connect Data Sources – Link your datasets to the dashboard.
🎛️ Use Filters & Slicers – Analyze data by platform, region, or game.
📊 Monitor KPIs – Track revenue, profit, and engagement instantly.
🔍 Explore Insights – Drill down into charts for detailed analysis.
📈 Track Trends – Monitor monthly growth and performance patterns.
Within minutes, you can turn raw data into powerful insights! ⚡
👥 Who Can Benefit from This Esports Streaming Dashboard in Power BI
This dashboard is perfect for:
🎮 Esports Teams – Track team performance and revenue streams.
📺 Streamers & Creators – Optimize content and maximize earnings.
📊 Data Analysts – Gain deep insights with interactive visuals.
🏢 Gaming Companies – Monitor business performance effectively.
📢 Marketing Teams – Improve audience engagement strategies.
If you’re involved in esports, this tool is a must-have! 🏆
📖 Click here to read the Detailed blog post
🎥 Visit our YouTube channel to learn step-by-step video tutorials
👉 https://www.youtube.com/@PKAnExcelExpert


