Managing financial transactions effectively is one of the most critical responsibilities for any organization. Businesses process hundreds or even thousands of financial transactions each month, including revenue entries, expense payments, departmental spending, and approval workflows. However, when financial data is stored in scattered spreadsheets or manual reports, finance teams often struggle to analyze transaction patterns and monitor financial performance.Financial Transactions Dashboard in Google Sheets
As a result, finance managers may find it difficult to track revenue trends, evaluate departmental expenses, monitor transaction approvals, and identify important financial patterns.
To solve these challenges, organizations increasingly adopt data-driven dashboards to transform financial data into clear visual insights.
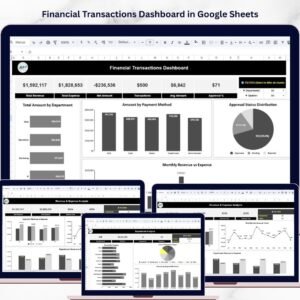
The Financial Transactions Dashboard in Google Sheets is a powerful and ready-to-use analytics solution that helps finance teams monitor revenue, expenses, approvals, and financial trends using an interactive dashboard system.
This dashboard centralizes financial transaction data and converts it into visual reports using charts, KPIs, and filters. Because it is built in Google Sheets, teams can collaborate in real time, update financial records instantly, and access insights from anywhere.
Instead of manually analyzing transaction data, finance professionals can quickly understand financial performance using interactive charts, KPI cards, and trend analysis dashboards.
📊 Key Features of the Financial Transactions Dashboard
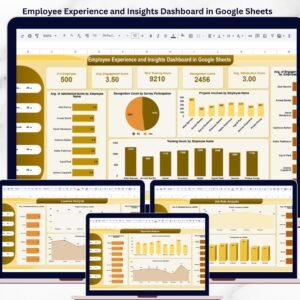
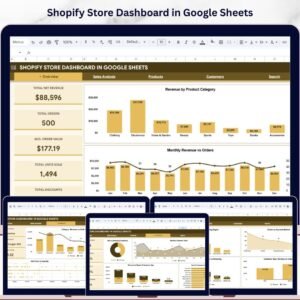
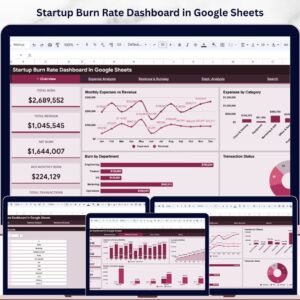
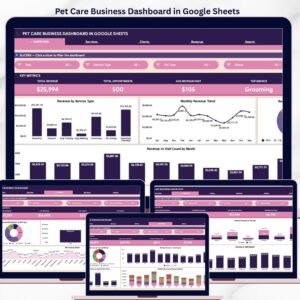
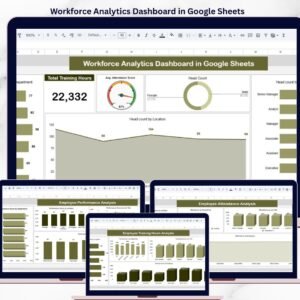
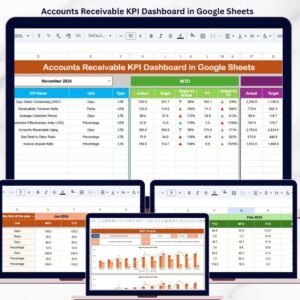
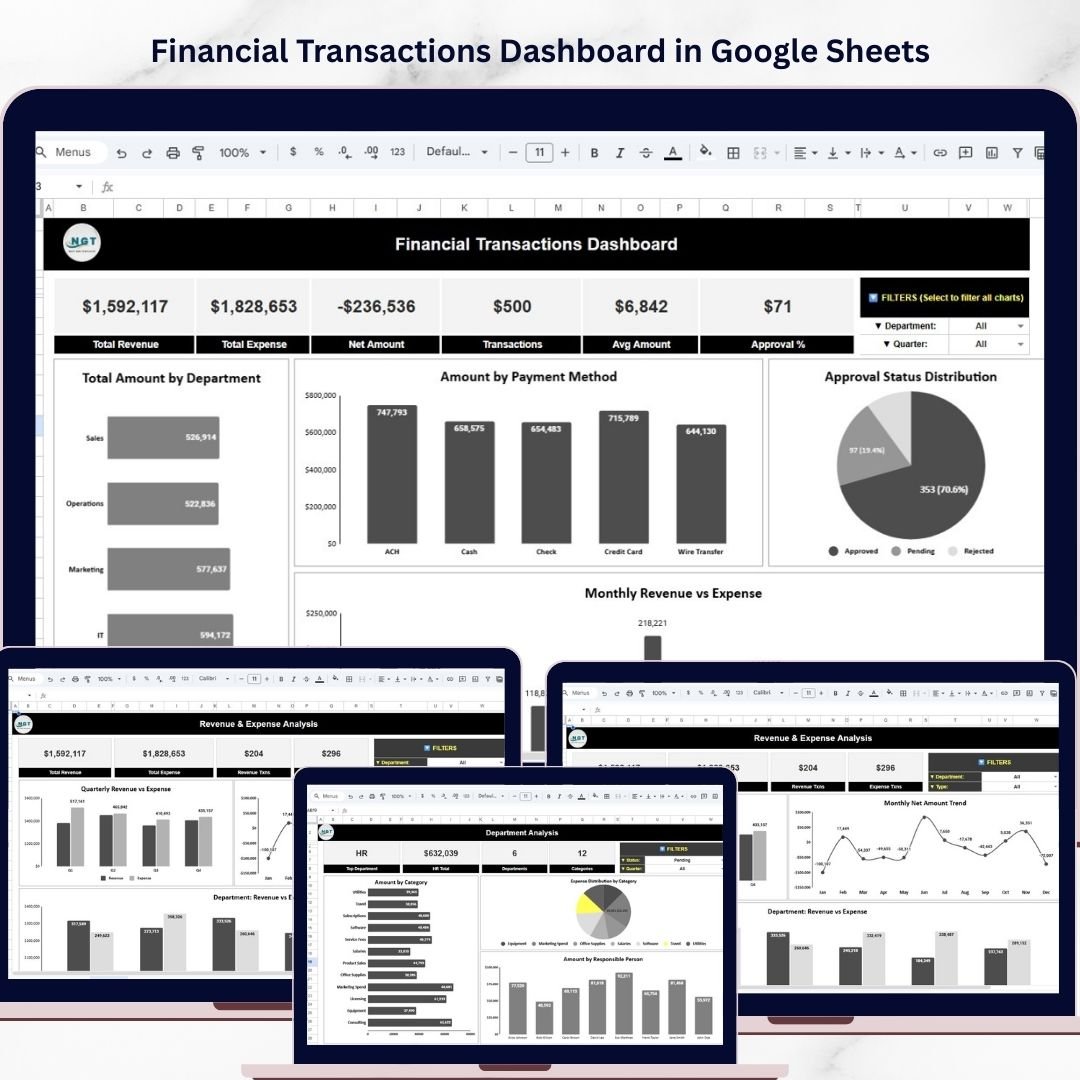
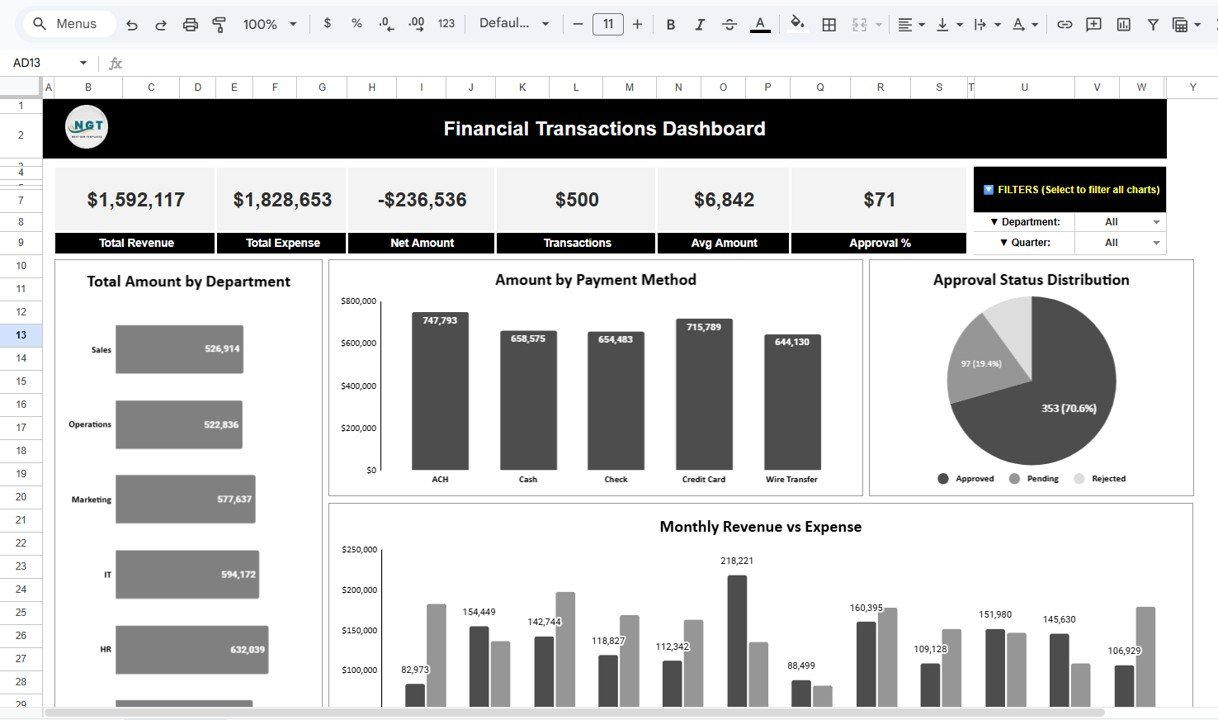
📈 Financial Overview Dashboard
The main dashboard provides a comprehensive overview of financial performance.
At the top of the dashboard, several KPI cards summarize key financial metrics, including:
• Total Revenue
• Total Expense
• Net Amount
• Total Transactions
• Average Transaction Amount
• Approval Percentage
These KPIs help finance managers quickly understand the organization’s financial position.
🏢 Department Financial Analysis
The dashboard includes charts that analyze financial transactions by department.
Departments may include:
• Sales
• Operations
• Marketing
• IT
• HR
• Finance
This analysis helps organizations identify which departments generate the most revenue or incur the highest expenses.
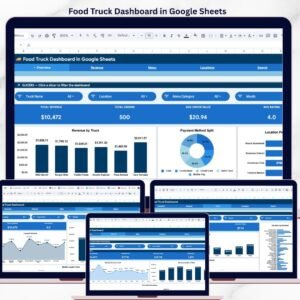
💳 Payment Method Analysis
The dashboard also analyzes transactions based on payment methods such as:
• ACH
• Cash
• Check
• Credit Card
• Wire Transfer
This insight helps finance teams understand how transactions occur across different payment channels.
✔️ Approval Status Monitoring
Financial approval workflows are critical for financial governance.
The dashboard displays the distribution of transaction approval statuses, including:
• Approved
• Pending
• Rejected
This visualization allows managers to identify approval delays and monitor financial control processes.
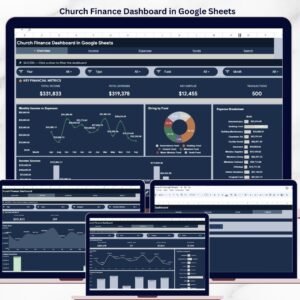
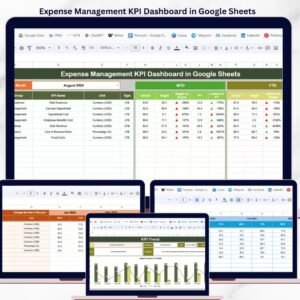
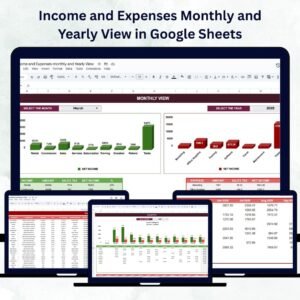
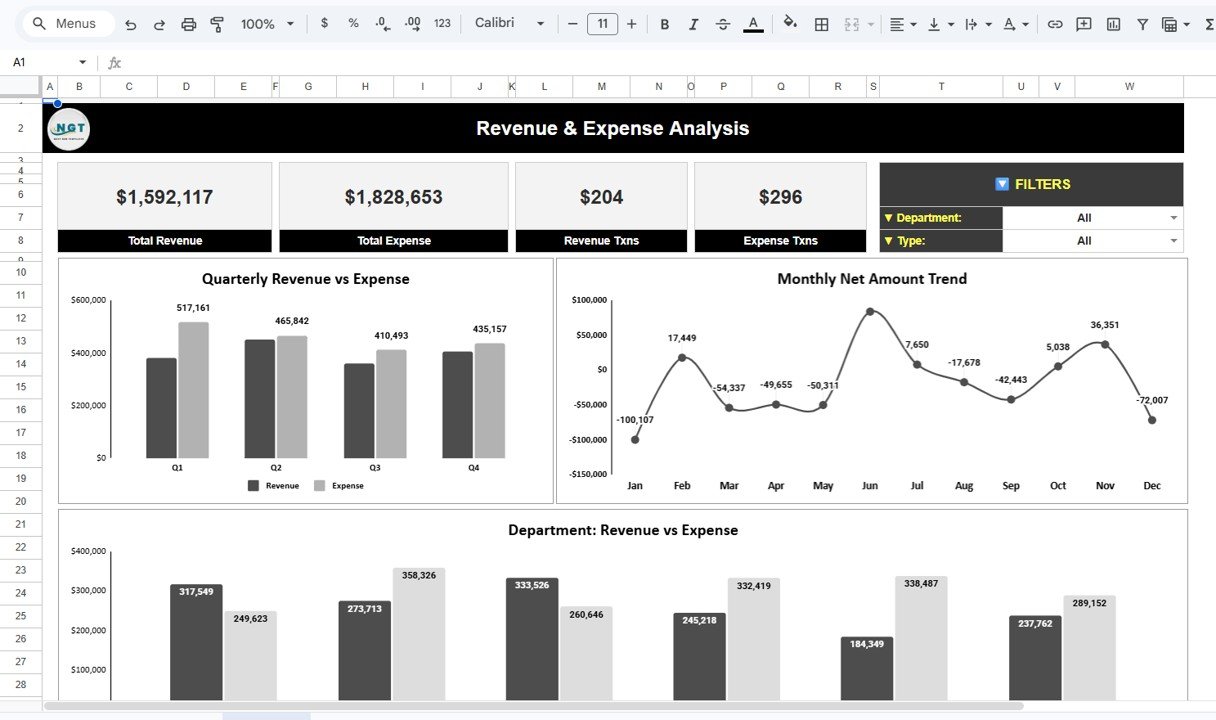
💰 Revenue & Expense Analysis
The Revenue & Expense Analysis dashboard focuses on financial performance metrics.
Key features include:
• Total revenue and expense KPIs
• Revenue transaction counts
• Expense transaction counts
Finance teams can also analyze quarterly revenue vs expense trends, helping them understand seasonal financial performance.
Additionally, a monthly net amount trend chart displays the difference between revenue and expenses for each month.
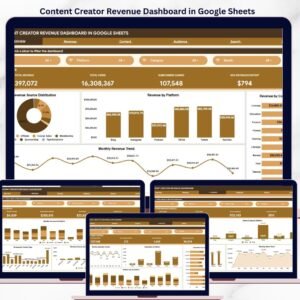
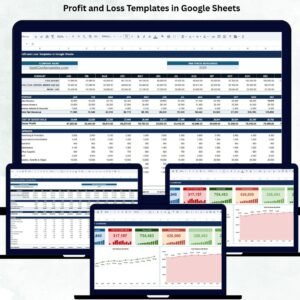
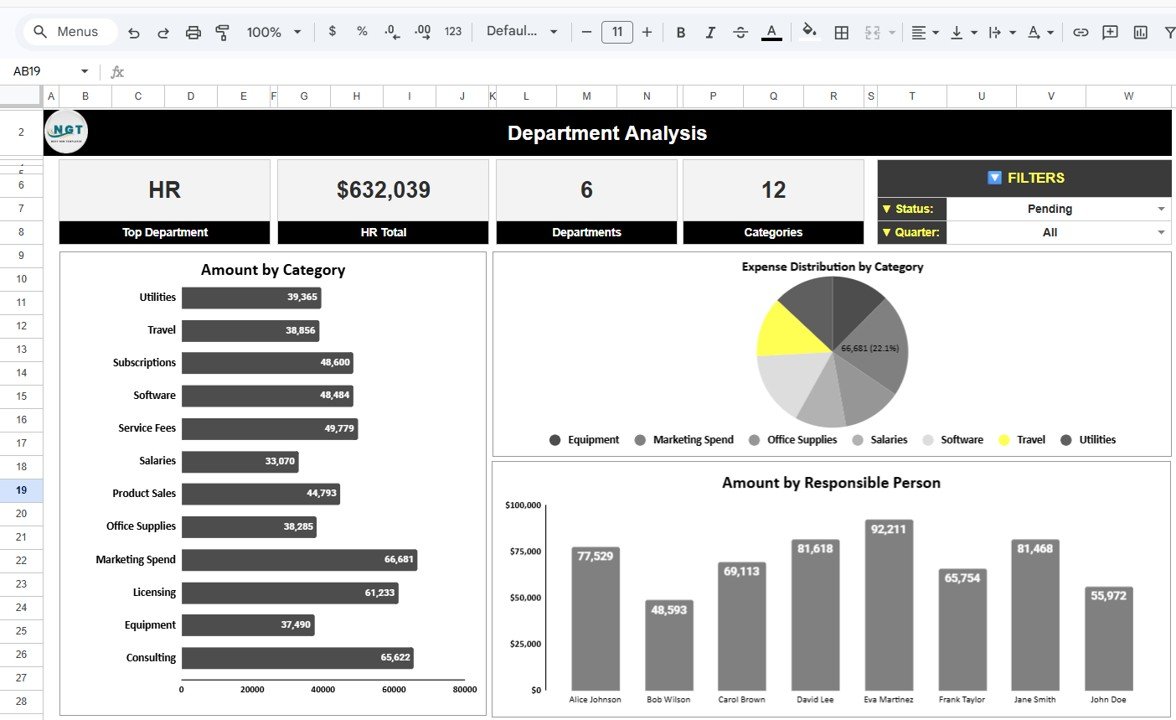
📊 Department Performance Dashboard
The Department Analysis dashboard provides deeper insights into departmental financial activity.
This dashboard includes:
• Top department KPI based on transaction value
• Department transaction summaries
• Spending by category
• Expense distribution charts
• Amount handled by responsible employees
These insights help finance leaders monitor accountability and departmental financial performance.
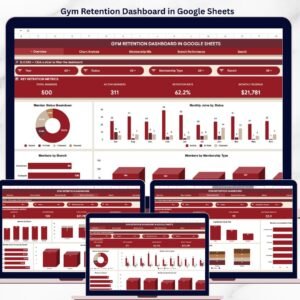
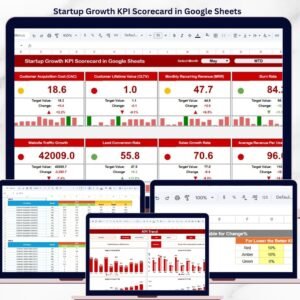
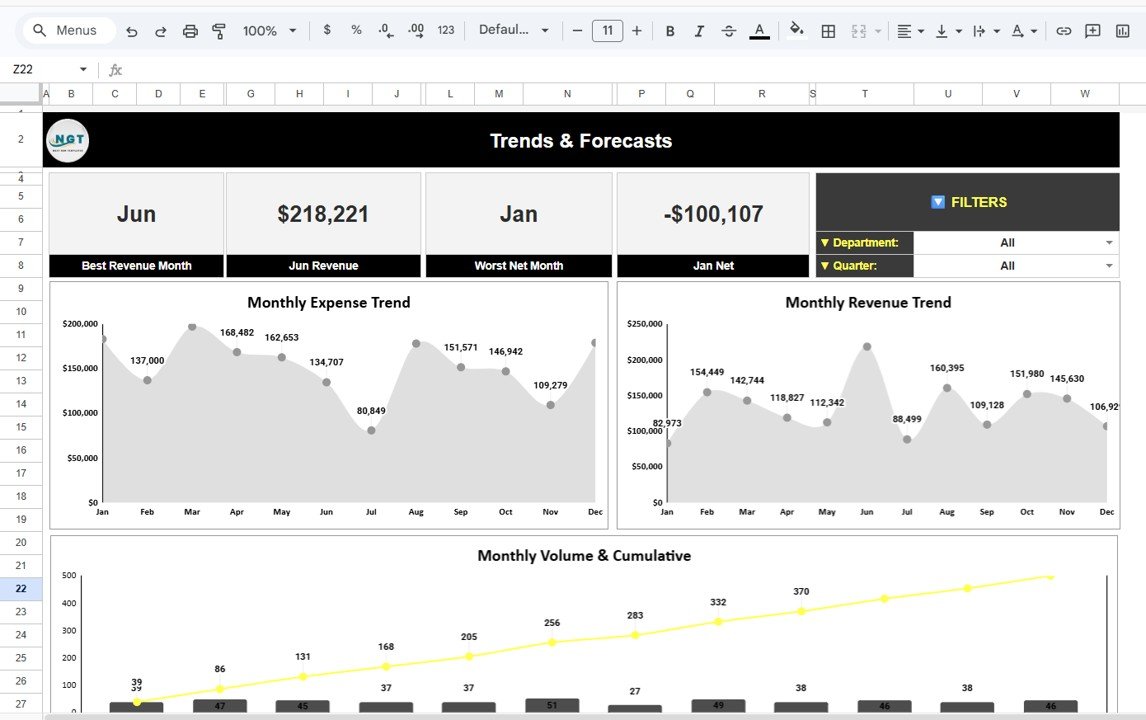
📉 Trends & Forecast Analysis
The Trends & Forecasts dashboard focuses on long-term financial patterns.
It includes KPIs such as:
• Best revenue month
• Worst net financial month
The dashboard also includes charts showing:
• Monthly revenue trends
• Monthly expense trends
• Transaction volume growth
• Cumulative financial activity
These insights help organizations understand financial performance over time.
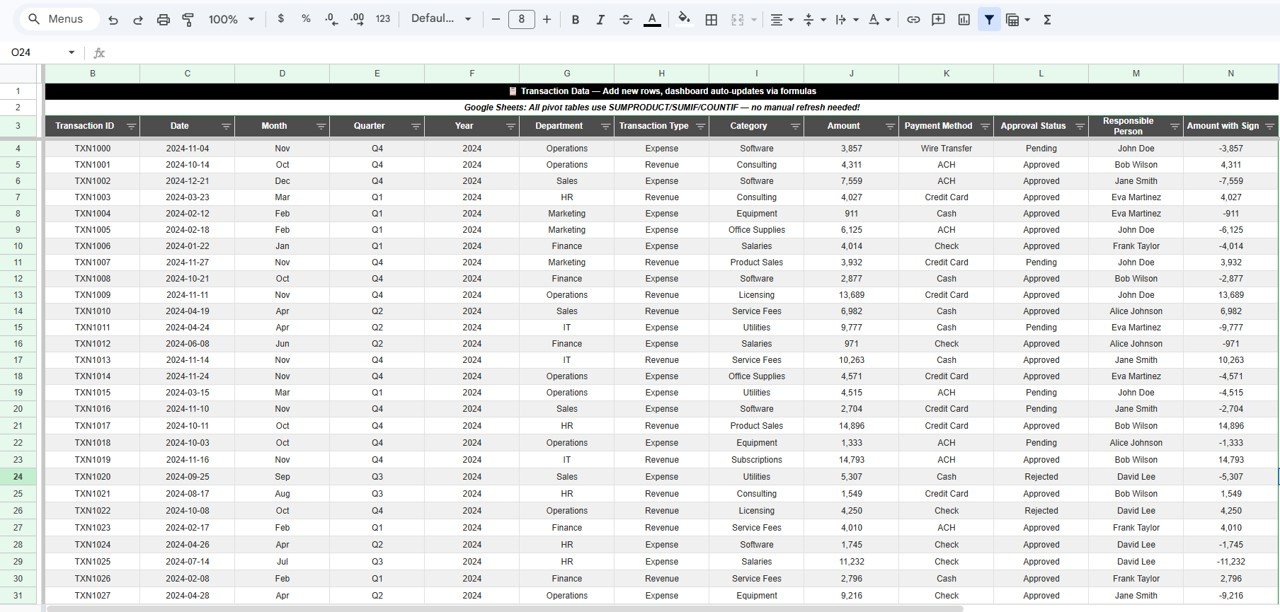
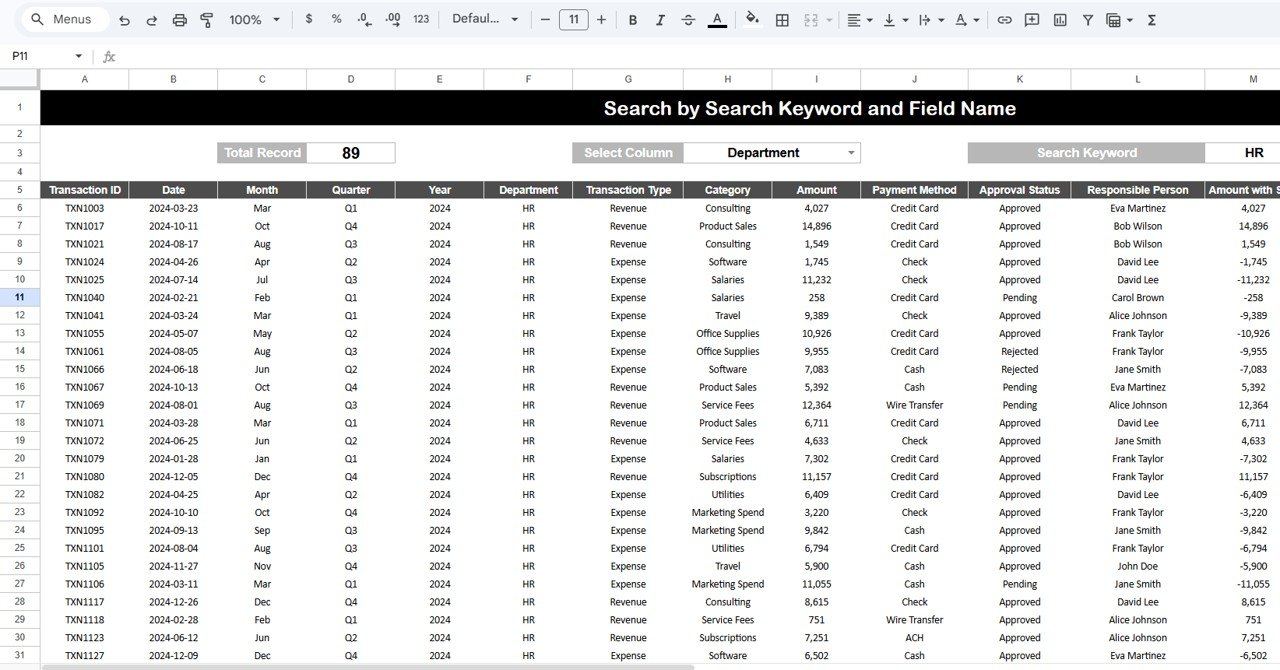
🔍 Transaction Search Functionality
The template includes a powerful transaction search feature.
Users can:
• Select a column such as Department or Category
• Enter a keyword
• Instantly filter and locate transactions
This functionality helps finance teams quickly find specific transactions without manually scanning large datasets.
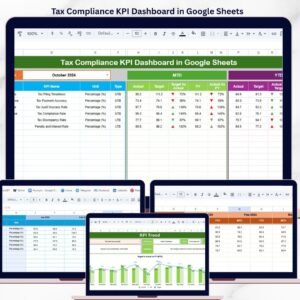
📁 What’s Inside the Financial Transactions Dashboard
When you download this template, you receive a Google Sheets dashboard with multiple analytical pages, including:
✔ Financial Overview Dashboard – High-level financial KPIs and performance metrics
✔ Revenue & Expense Analysis Dashboard – Revenue and expense comparisons
✔ Department Analysis Dashboard – Department financial performance insights
✔ Trends & Forecasts Dashboard – Financial trend analysis
✔ Transaction Data Sheet – Raw transaction data source
✔ Transaction Search Dashboard – Transaction filtering and search tool
Each dashboard page is connected and automatically updates when financial data changes.
👥 Who Can Benefit from This Dashboard
This dashboard is ideal for:
✔ Finance Managers
✔ Financial Analysts
✔ Accountants
✔ Business Owners
✔ Operations Managers
✔ CFOs and Financial Controllers
✔ Finance Teams in Small and Large Businesses
Any organization managing financial transactions can use this dashboard to improve financial monitoring and decision-making.
🚀 Transform Financial Data into Actionable Insights
The Financial Transactions Dashboard in Google Sheets helps organizations centralize financial transaction data and transform it into meaningful insights.
With interactive charts, KPI indicators, and financial trend analysis, finance teams can monitor revenue, control expenses, track approvals, and analyze departmental financial activity efficiently.
Because the template is cloud-based and customizable, it becomes an essential tool for modern financial analytics.
Click here to Read detailed blog post
Watch the step-by-step video tutorial:
Visit our YouTube channel to learn step-by-step video tutorials