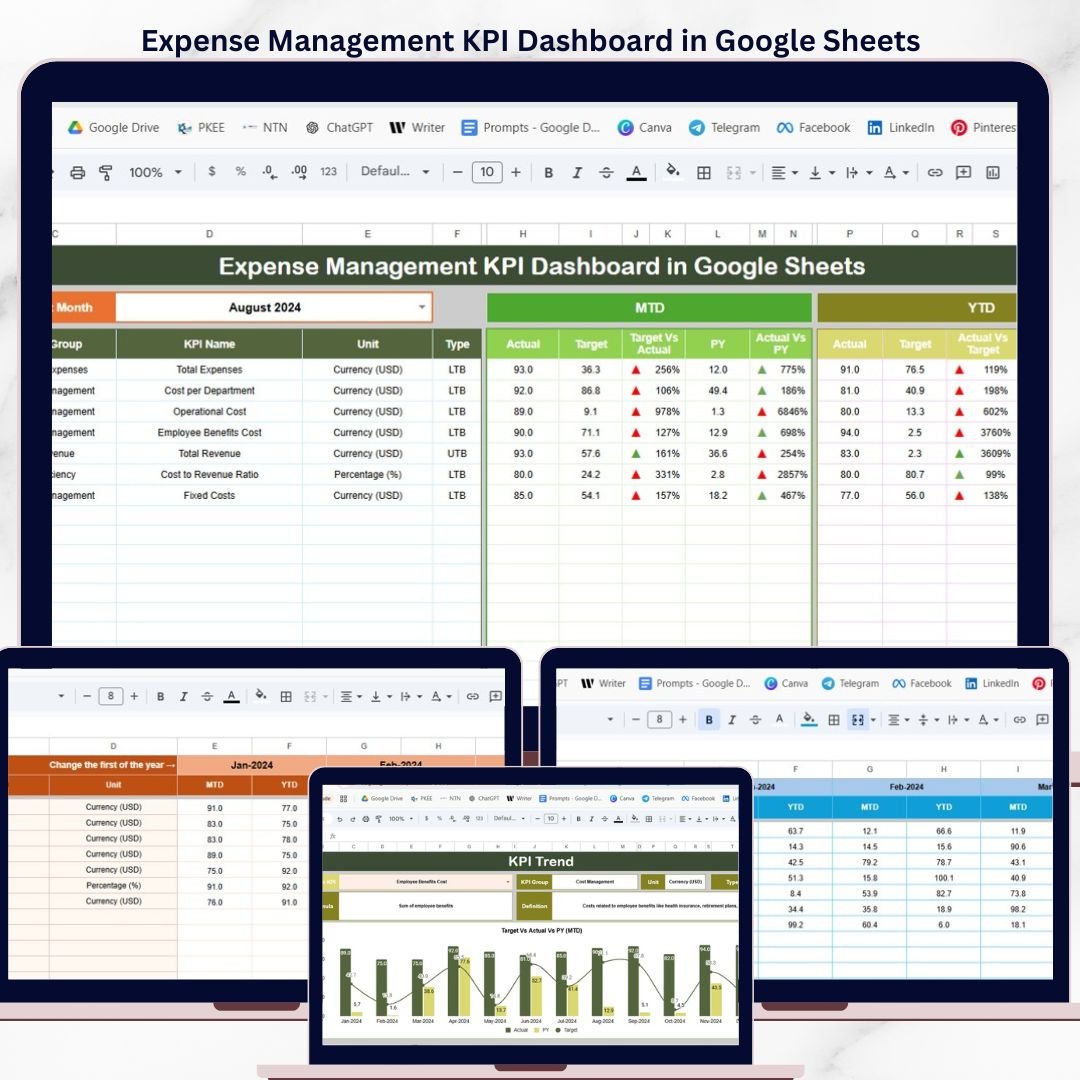
The Expense Management KPI Dashboard in Google Sheets monitors expense KPIs across 6 worksheet tabs with MTD Actual, Target, Previous Year comparisons and conditional formatting up/down arrows — covering both MTD and YTD views. The template tracks all defined KPIs from a single Dashboard sheet, with a dedicated KPI Trend page for drill-down analysis. Setup takes under 10 minutes — make a copy of the Google Sheet, replace the sample data, and every metric updates automatically.
🌍 Join 8,400+ teams in 40+ countries using NextGenTemplates to replace paid SaaS tools with one-time-purchase Excel, Google Sheets, Power BI, and HTML templates.
✅ Instant download · One-time payment · No subscription · No per-user fees · Lifetime access
Expense Management KPI Dashboard in Google Sheets
🔑 Key Features of the Expense Management KPI Dashboard in Google Sheets
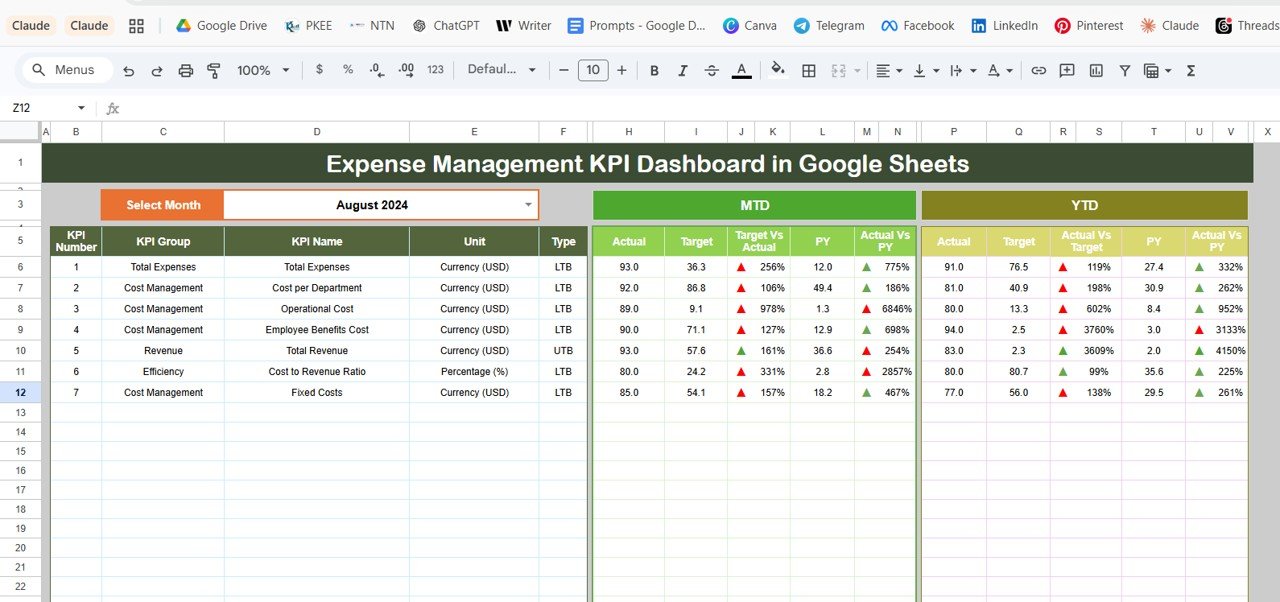
📊 Dashboard sheet with MTD and YTD tracking — The main Dashboard tab displays MTD Actual, Target, and Previous Year data alongside YTD Actual, Target, and Previous Year for every KPI. Conditional formatting arrows instantly highlight whether each metric is trending above or below target and prior year. Select any month from the drop-down on cell D3 and the entire dashboard recalculates for that period.
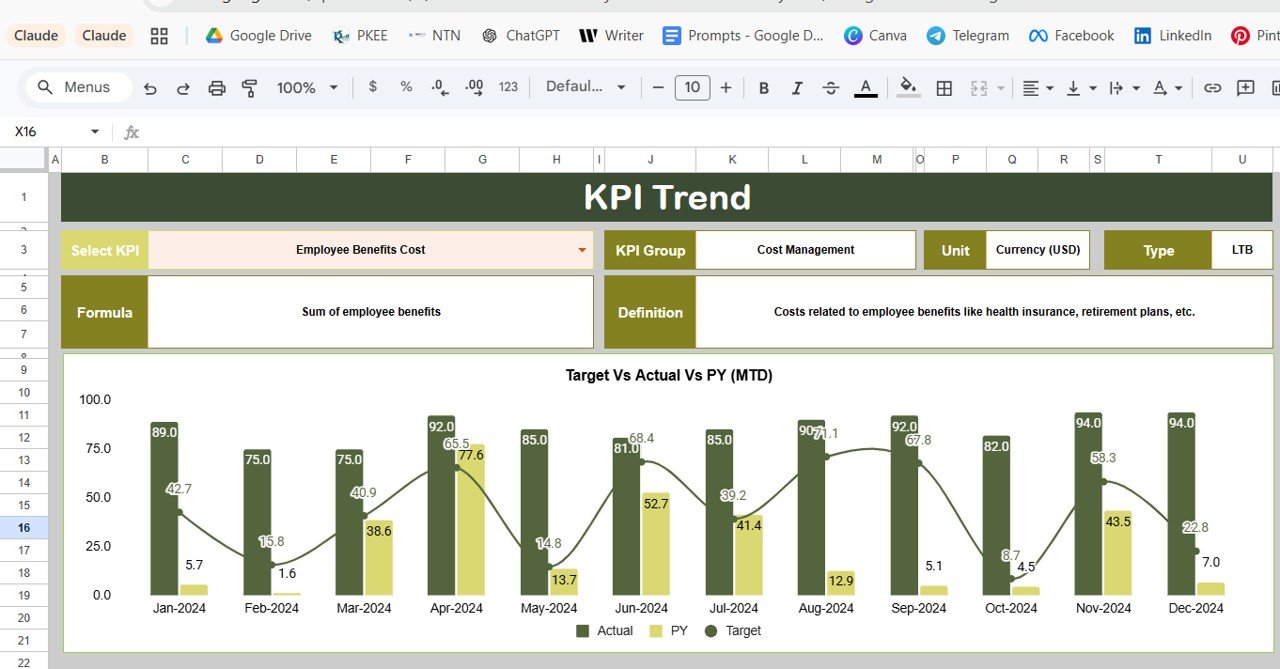
📈 KPI Trend sheet with drill-down charts — Select any KPI from the drop-down on cell C3 to view its KPI Group, Unit, Type (LTB or UTB), Formula, and Definition. Two trend charts — MTD and YTD — plot Actual, Target, and Previous Year lines side by side so you can spot seasonality, budget gaps, and year-over-year shifts at a glance.
📝 3 structured input sheets for Actual, Target, and Previous Year — Enter MTD and YTD numbers for the current period in the Actual Numbers Input sheet, budget targets in the Target Number Input sheet, and prior-year comparisons in the Previous Year Number sheet. Change the starting month on cell E1 of the Actual sheet to align with your fiscal calendar.
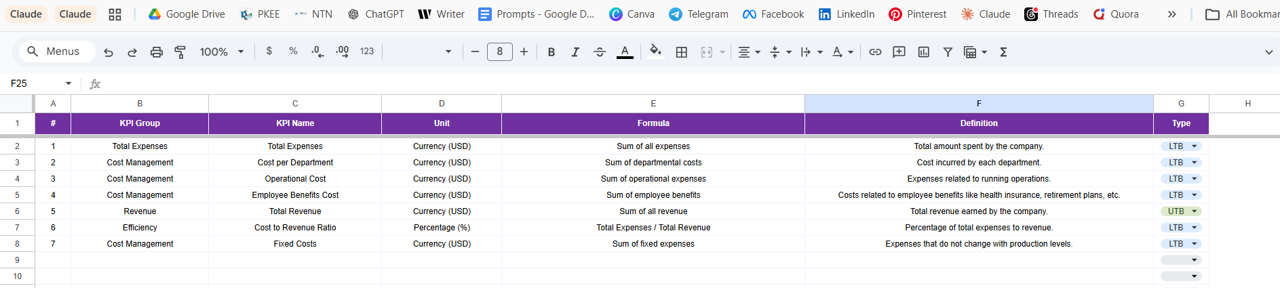
📋 KPI Definition sheet for centralized metric management — Define each KPI’s Name, Group, Unit, Formula, and Definition in one place. Tag each KPI as LTB (Lower the Better) or UTB (Upper the Better) to drive the conditional formatting logic on the Dashboard.
☁️ Cloud-based, real-time collaboration — Lives in Google Drive so your entire finance team can access it from any device, share with one click, and collaborate simultaneously. No desktop software required. Browse more Google Sheets Dashboard Templates.
📦 What’s Inside the Expense Management KPI Dashboard in Google Sheets
The template includes 6 worksheets:
📄 1 — Dashboard Sheet: The main sheet showing all KPI information. Select a month from the drop-down on range D3 and the entire dashboard updates. Displays MTD Actual, Target, Previous Year alongside Target vs Actual and PY vs Actual variances with conditional formatting up/down arrows. Also shows YTD Actual, Target, Previous Year with the same variance indicators.
Expense Management KPI Dashboard in Google Sheets
📄 2 — KPI Trend Sheet: Select any KPI name from the drop-down on range C3. Displays the KPI Group, Unit, Type (LTB or UTB), Formula, and Definition. Shows MTD and YTD trend charts plotting Actual, Target, and PY numbers across all 12 months.
KPI Trend Sheet
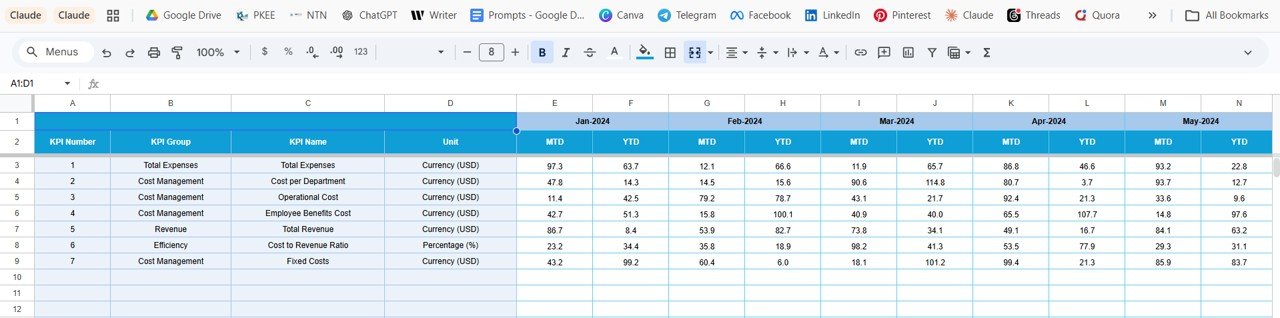
📄 3 — Actual Numbers Input Sheet: Enter actual MTD and YTD numbers for each KPI for a particular month. Change the starting month from range E1 to align with your fiscal year.
Actual Numbers Input Sheet
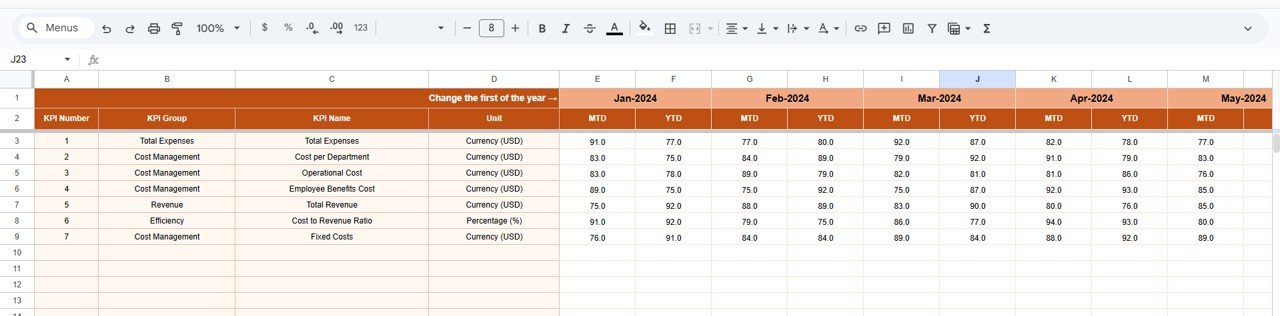
📄 4 — Target Number Input Sheet: Enter target numbers for each KPI for each month as MTD and YTD values.
Target Number Input Sheet
📄 5 — Previous Year Number Sheet: Enter the previous year numbers in the same format as the current year for year-over-year comparisons.
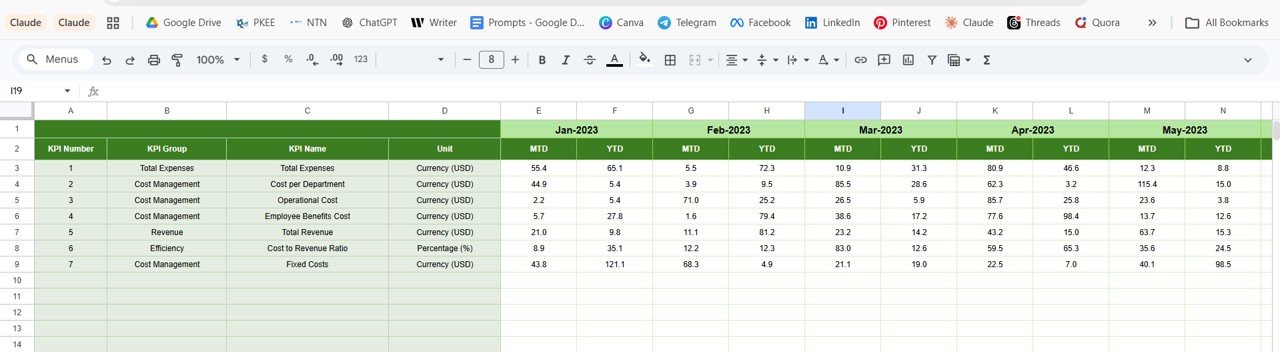
Previous Year Number Input Sheet
📄 6 — KPI Definition Sheet: Define KPI Name, KPI Group, Unit, Formula, and KPI Definition. In the last column, tag each KPI as LTB (Lower the Better) or UTB (Upper the Better) to control conditional formatting behavior.
📊 Expense Management KPI Dashboard in Google Sheets vs. Excel Dashboard vs. SAP Concur — Where This Fits
| Feature | Expense Management KPI Dashboard in Google Sheets | Microsoft Excel Dashboard | SAP Concur / Expensify |
|---|---|---|---|
| Cost | $8.99 one-time | $10–20 for template + Excel license | $8–25 / user / month |
| Platform | Google Sheets (free, browser-based) | Microsoft Excel (desktop) | Cloud SaaS |
| Setup time | Under 10 minutes | 15–30 minutes | 2–4 weeks onboarding |
| Real-time team collaboration | ✅ Built-in | ❌ (file sharing only) | ✅ |
| MTD + YTD + PY comparison | ✅ All three built-in | ✅ (manual pivot setup) | ✅ |
| KPI Trend charts | ✅ | ✅ | ✅ |
| No per-user fees | ✅ | ✅ | ❌ |
| Works on mobile | ✅ Google Sheets app | Limited | ✅ |
| Year-1 cost at 5 users | $8.99 | $10–20 | $480–1,500 |
For finance teams that want expense KPI tracking with MTD, YTD, and Previous Year comparisons without paying $480+ a year for Concur, the Expense Management KPI Dashboard in Google Sheets sits in the sweet spot.
👥 Who This Template Is For — and Who It’s Not For
✅ This template is built for:
- Finance managers at 10–500 person companies tracking monthly expense KPIs against budget and prior year
- Controllers and CFOs who need a shareable, cloud-based expense scorecard for monthly reviews
- Startup finance leads who want structured expense tracking without paying for SAP Concur or Expensify
- Accountants and bookkeepers monitoring cost center performance for multiple clients
❌ This template is NOT for:
- Enterprise teams needing automated receipt scanning, OCR, and approval workflows (use Concur or Brex)
- Organizations requiring SOC 2 compliance, SSO, and audit-trail logging at scale
- Teams that need real-time API integration with ERP systems like NetSuite or SAP
⚙️ How to Use the Expense Management KPI Dashboard in Google Sheets
- Open the PDF guide from your download — it contains the Google Sheets copy link.
- Click the link and select “Make a copy” to save your own editable version in Google Drive.
- Go to the KPI Definition sheet and enter your KPI names, groups, units, formulas, definitions, and LTB/UTB tags.
- Enter your actual numbers in the Actual Numbers Input sheet, targets in the Target Number Input sheet, and previous year data in the Previous Year Number sheet.
- Navigate to the Dashboard sheet, select the month from the drop-down on D3, and review all KPI performance.
- Use the KPI Trend sheet to drill into any specific KPI’s monthly trend with Actual vs Target vs PY charts.
💼 Real-World Use Cases
Ravi is a finance controller at a 120-person IT services firm in Bengaluru. He uses the Expense Management KPI Dashboard in Google Sheets to track 15 expense KPIs — travel costs, software subscriptions, office rent, utilities, and contractor payments — against monthly budgets. Every month-end, he selects the current month on D3, screenshots the Dashboard for the leadership deck, and shares the live Google Sheet link with department heads for self-service access.
Sarah manages accounting for a 40-person marketing agency in London. She replaced a $15/user/month Expensify subscription with this template because the agency only needed KPI-level expense monitoring — not receipt scanning. The MTD vs Target arrows on the Dashboard immediately flag which cost categories are trending over budget, saving her 3 hours of manual Excel reporting each month.
Ahmed is a startup CFO tracking burn rate across 8 expense categories. He uses the YTD columns to monitor cumulative spend against the annual budget, and the Previous Year sheet to show investors year-over-year efficiency gains during quarterly board meetings — all from a single Google Sheets link.
❓ Frequently Asked Questions
What KPIs does the Expense Management KPI Dashboard in Google Sheets track?
The Expense Management KPI Dashboard in Google Sheets tracks any expense KPIs you define in the KPI Definition sheet. You enter the KPI Name, Group, Unit, Formula, Definition, and Type (LTB or UTB). The Dashboard sheet then displays MTD and YTD Actual, Target, and Previous Year values with conditional formatting arrows for each KPI.
How long does setup take for the Expense Management KPI Dashboard?
Setup takes under 10 minutes. Make a copy of the Google Sheet from the link in the PDF guide, enter your KPI definitions, fill in your actual, target, and previous year numbers, and the Dashboard and KPI Trend sheets update automatically. No formulas to write, no scripts to run.
How does this compare to SAP Concur or Expensify?
SAP Concur and Expensify cost $8–25 per user per month and include receipt scanning, approval workflows, and ERP integrations. The Expense Management KPI Dashboard in Google Sheets is a one-time $8.99 purchase focused on KPI-level expense monitoring with MTD, YTD, and Previous Year comparisons. It does not scan receipts — it tracks expense performance against targets.
Can I customize the KPIs in this template?
Yes. The KPI Definition sheet is fully editable. Add, rename, or remove KPIs as needed. Tag each as LTB (Lower the Better) or UTB (Upper the Better) and the Dashboard conditional formatting adjusts automatically.
Does this template work on mobile devices?
Yes. The Expense Management KPI Dashboard in Google Sheets works in the Google Sheets mobile app on iOS and Android. You can view the Dashboard, switch months, and check KPI Trends from your phone or tablet.
Is this a one-time payment or subscription?
One-time payment of $8.99. You get instant download, a Google Sheets copy link, lifetime access, and no per-user fees. There is no subscription and no recurring charges.
Can my whole team access this dashboard simultaneously?
Yes. Because it lives in Google Drive, you can share the sheet with view or edit permissions. Multiple team members can access the dashboard at the same time from any browser or the Google Sheets mobile app.
👤 About the Author
Built by PK — Microsoft Certified Professional with 15+ years of Excel, Google Sheets, and Power BI experience. Founder of NextGenTemplates, reaching 300K+ subscribers across YouTube channels (@PK-AnExcelExpert, @NextGenTemplates, @NeoTechNavigators). Every template is hand-built and tested before release.
🔗 Explore Related Templates
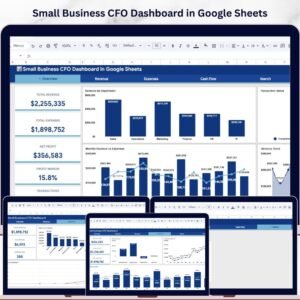
💰 Small Business CFO Dashboard in Google Sheets — Track revenue, expenses, profit, and cash flow for small businesses in a single Google Sheet.
📊 Finance KPI Scorecard in HTML — 10 finance KPIs with traffic light indicators, sparkline trends, and MTD/YTD toggle in a browser-based dashboard.
📋 Personal Monthly Budget Tracker in Google Sheets — Track personal income and expenses with visual charts and monthly summaries.
💎 Save on finance-grade analytics: Get the Finance & Accounting Command Center — 8 Premium Templates covering CFO dashboards, KPI scorecards, and budget trackers across Excel, Power BI, and Google Sheets.
Browse more Google Sheets Dashboard Templates or explore the full NextGenTemplates shop.
📖 Click here to read the Detailed Blog Post
🎥 Visit our YouTube channel for step-by-step video tutorials
👉 YouTube.com/@NextGenTemplates


Reviews
There are no reviews yet.