Corruption investigations require strong monitoring, transparent reporting, and accurate financial tracking. However, many government agencies, regulatory bodies, and investigative teams still rely on fragmented spreadsheets and manual reporting systems. Because of this, leaders often struggle to quickly evaluate investigation progress, track financial recovery, and analyze corruption trends.
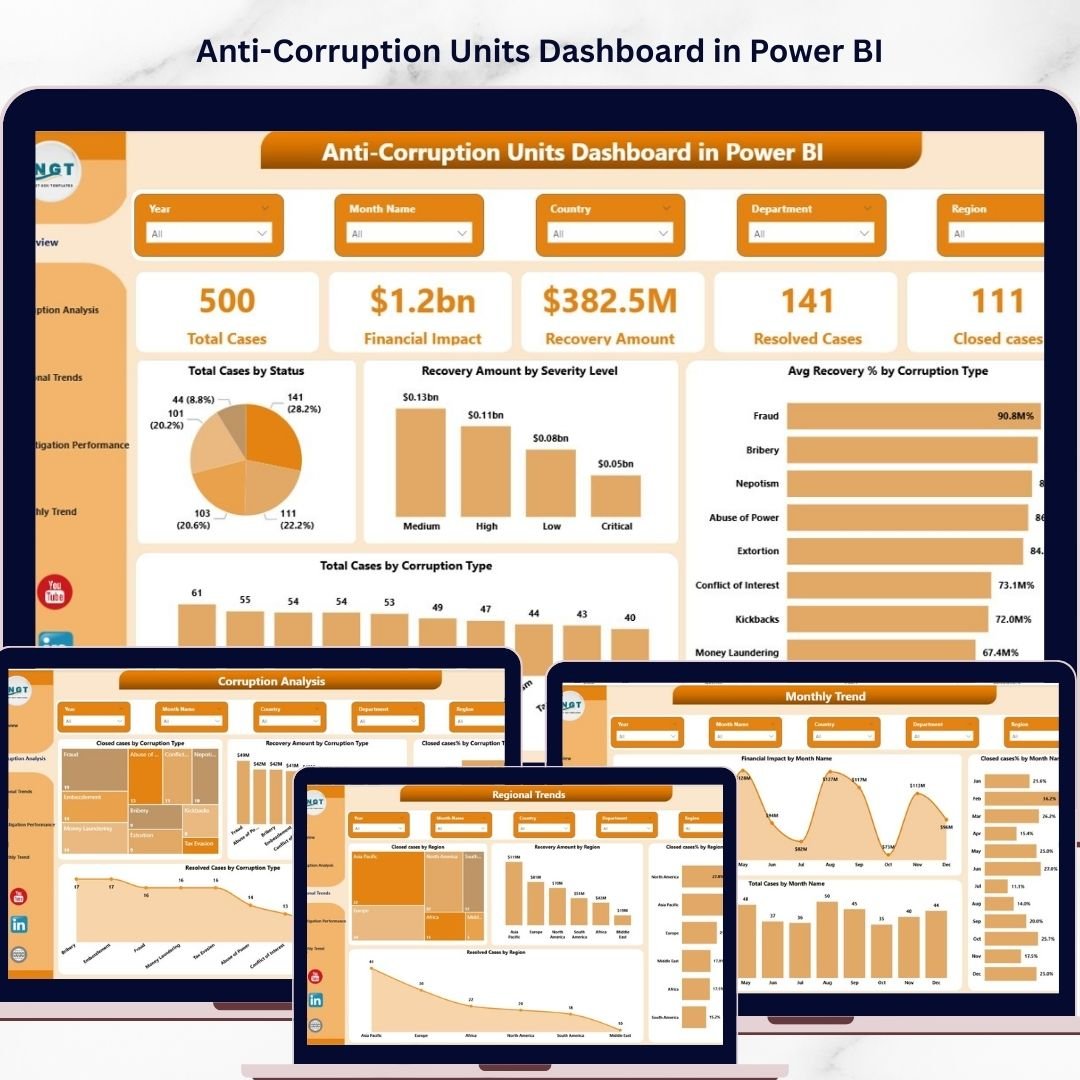
To solve this challenge, we created the Anti-Corruption Units Dashboard in Power BI — a powerful and ready-to-use analytical solution designed to help organizations monitor corruption investigations, track financial impact, evaluate recovery performance, and analyze investigation efficiency through interactive visuals.
This professionally designed Power BI dashboard converts complex corruption investigation data into clear, actionable insights. Instead of reviewing multiple reports manually, decision-makers can instantly analyze corruption patterns, regional trends, investigator performance, and financial recovery results.
With its interactive charts, dynamic filters, and visually appealing layout, this dashboard helps organizations improve transparency, accountability, and operational efficiency. Whether you are managing corruption cases across regions or monitoring investigator productivity, this dashboard provides a centralized view of all critical investigation metrics.
🚨 Key Features of Anti-Corruption Units Dashboard in Power BI
📊 Five Interactive Analytical Pages
The dashboard includes five well-structured report pages that provide comprehensive insights into corruption investigations.
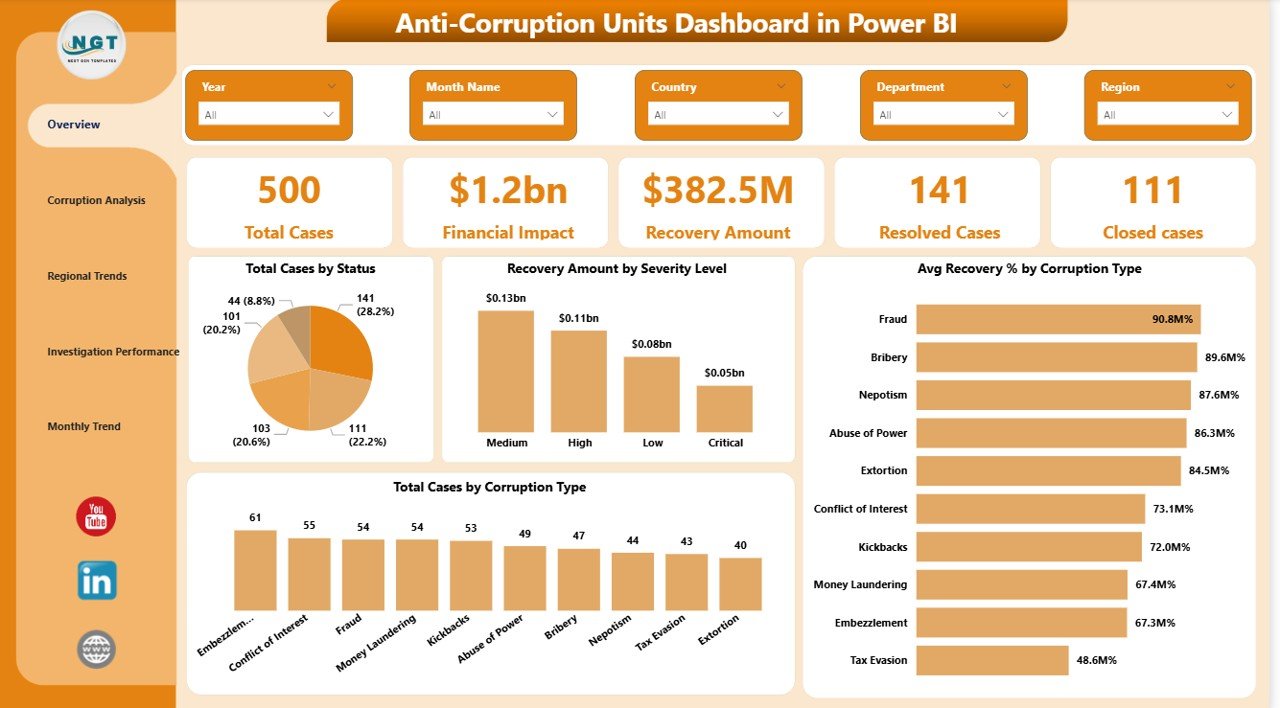
📌 Overview Page for Quick Monitoring
The main dashboard page summarizes corruption cases using five KPI cards, including Total Cases, Financial Impact, Recovery Amount, Resolved Cases, and Closed Cases.
📈 Visual Charts for Investigation Insights
Interactive charts analyze corruption trends such as Total Cases by Status, Recovery Amount by Severity Level, and Average Recovery Percentage by Corruption Type.
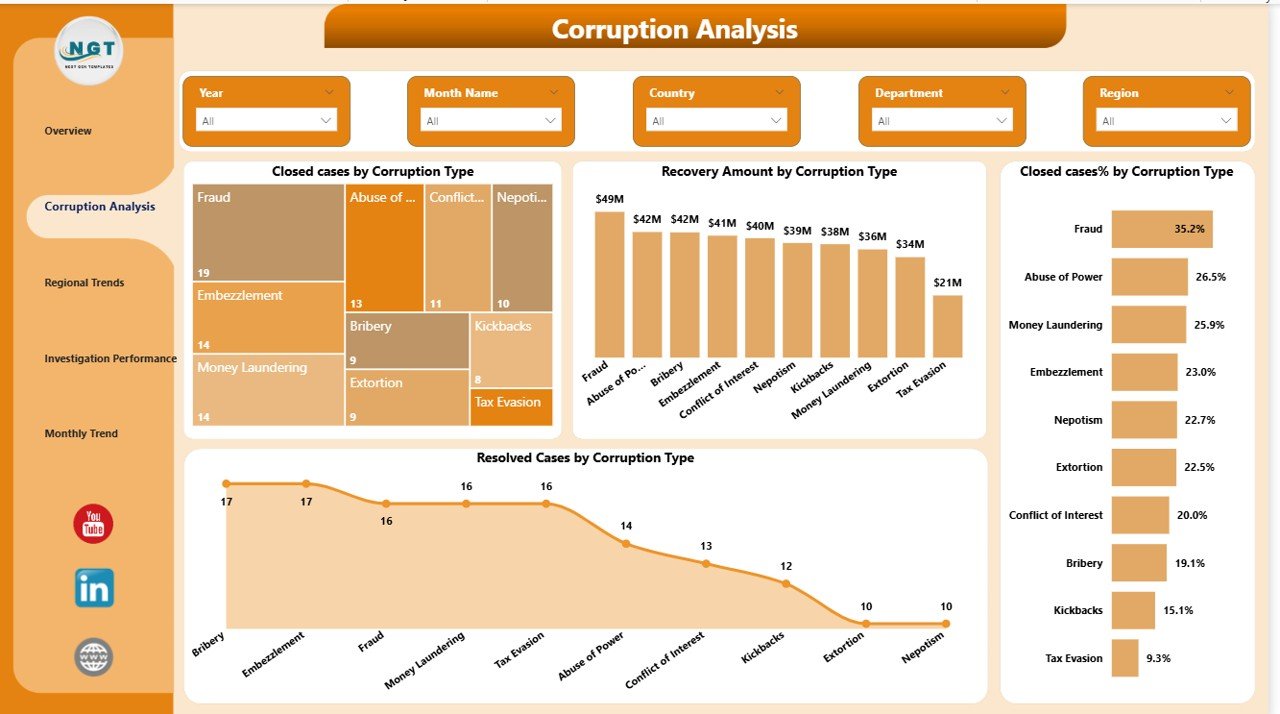
🕵️ Corruption Analysis Page
This page helps investigators understand the most common corruption types and evaluate recovery performance across corruption categories.
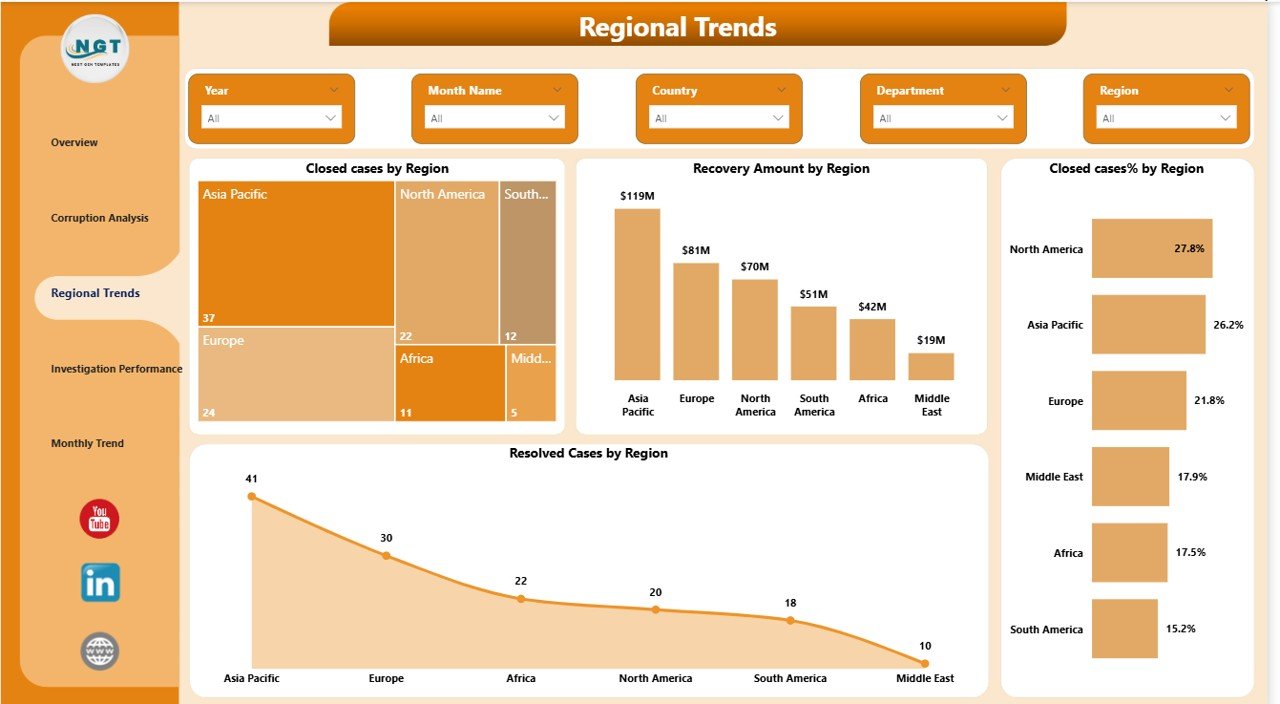
🌍 Regional Corruption Trend Analysis
Authorities can monitor corruption activity across different regions and identify areas with the highest financial impact.
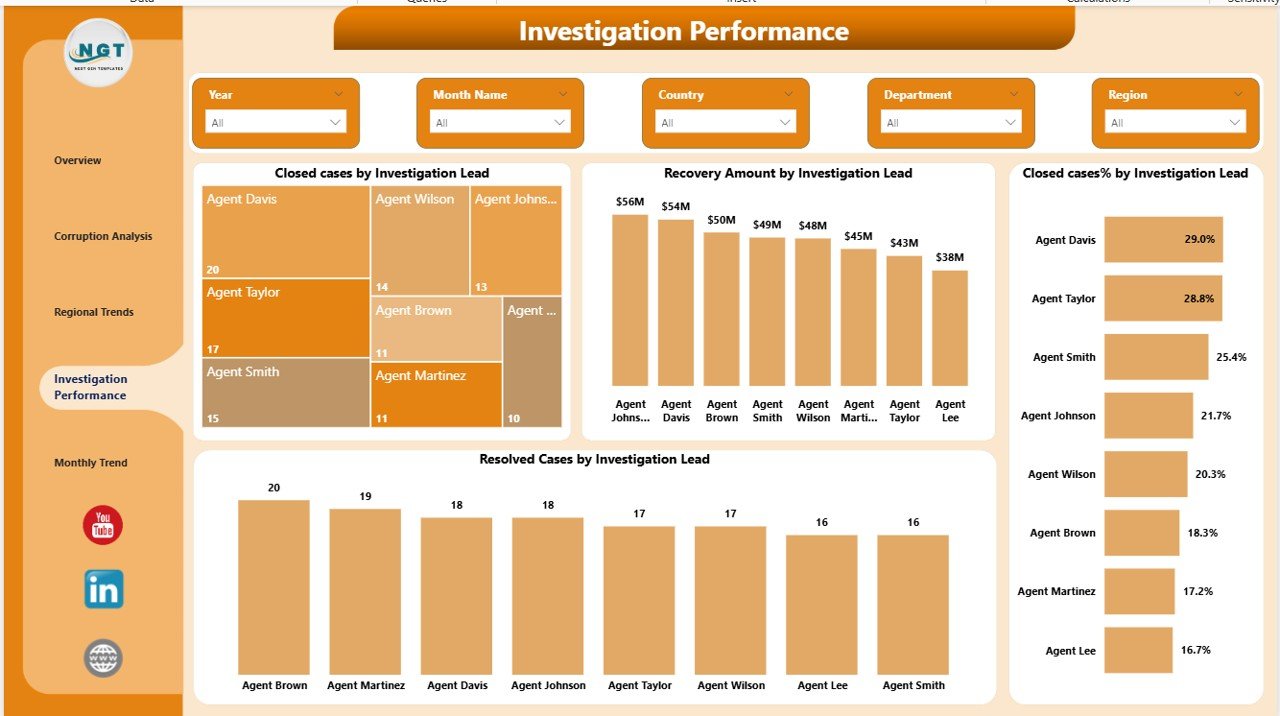
👨💼 Investigation Performance Monitoring
Managers can evaluate investigator productivity by analyzing closed cases, recovery amounts, and case resolution rates by investigation lead.
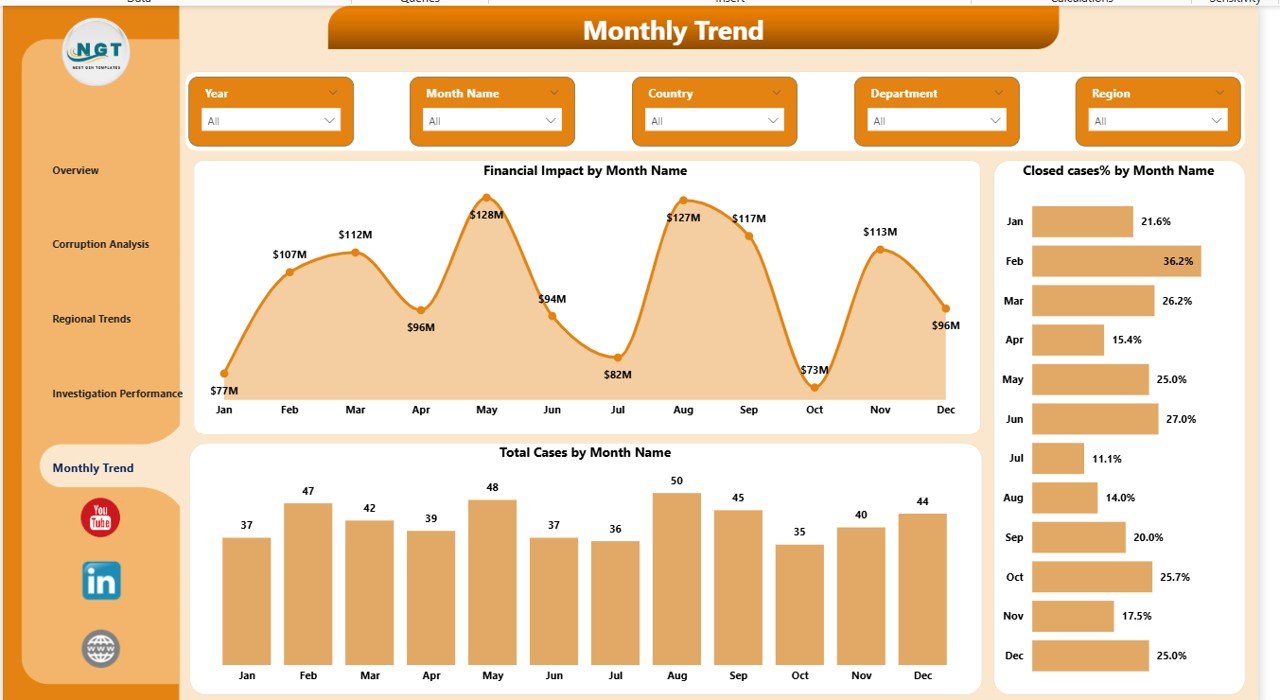
📅 Monthly Investigation Trend Analysis
Time-based charts help organizations monitor corruption activity over time and evaluate monthly investigation performance.
⚡ Interactive Power BI Filters
Users can apply filters and slicers to explore corruption data by region, corruption type, investigator, and time period.
📊 Data-Driven Decision Support
The dashboard transforms investigation data into visual insights that help leaders make faster and more informed decisions.
📦 What’s Inside the Anti-Corruption Units Dashboard in Power BI
This ready-to-use Power BI template includes multiple analytical components designed for corruption monitoring.
The dashboard contains five analytical pages:
1️⃣ Overview Page
The main summary dashboard provides a high-level view of corruption investigations.
KPI Cards:
-
Total Cases
-
Financial Impact
-
Recovery Amount
-
Resolved Cases
-
Closed Cases
Charts:
-
Total Cases by Status
-
Recovery Amount by Severity Level
-
Total Cases by Corruption Type
-
Average Recovery % by Corruption Type
2️⃣ Corruption Analysis Page
Charts included:
-
Closed Cases by Corruption Type
-
Recovery Amount by Corruption Type
-
Closed Cases % by Corruption Type
-
Resolved Cases by Corruption Type
This page helps identify high-risk corruption categories and analyze financial recovery performance.
3️⃣ Regional Trends Page
Charts included:
-
Closed Cases by Region
-
Recovery Amount by Region
-
Closed Cases % by Region
-
Resolved Cases by Region
These visuals help authorities analyze geographical corruption patterns.
4️⃣ Investigation Performance Page
Charts included:
-
Closed Cases by Investigation Lead
-
Recovery Amount by Investigation Lead
-
Closed Cases % by Investigation Lead
-
Resolved Cases by Investigation Lead
This page helps supervisors evaluate investigator productivity and efficiency.
5️⃣ Month Analysis Page
Charts included:
-
Financial Impact by Month
-
Closed Cases % by Month
-
Total Cases by Month
These visuals reveal monthly corruption investigation trends and financial impact patterns.
⚙️ How to Use the Anti-Corruption Units Dashboard in Power BI
Using this dashboard is simple and requires minimal setup.
1️⃣ Import your corruption investigation dataset into Power BI.
2️⃣ Ensure the dataset includes fields such as Case ID, Corruption Type, Investigation Lead, Region, Financial Impact, and Recovery Amount.
3️⃣ Refresh the dashboard to load the updated data.
4️⃣ Use slicers and filters to analyze corruption patterns.
5️⃣ Monitor investigation performance and financial recovery trends.
Within minutes, organizations can transform raw corruption data into interactive analytical insights.
🎯 Who Can Benefit from This Anti-Corruption Units Dashboard
This dashboard is useful for several organizations responsible for monitoring corruption investigations.
🏛 Government Anti-Corruption Agencies – Track corruption cases and financial recovery.
👮 Law Enforcement Departments – Monitor investigation progress and investigator productivity.
📊 Regulatory Authorities – Analyze corruption patterns and compliance risks.
🔎 Internal Audit Teams – Identify financial irregularities and suspicious activities.
📑 Corporate Compliance Departments – Monitor anti-corruption compliance initiatives.
Any organization that handles corruption investigations can use this dashboard to improve transparency and strengthen accountability.


