Content marketing has become one of the most powerful growth strategies for modern businesses. Companies invest heavily in blog content, social media campaigns, video marketing, SEO strategies, and digital storytelling to attract customers and build brand authority. As a result, content marketing agencies manage multiple campaigns, platforms, budgets, and client accounts simultaneously.
However, when marketing data is scattered across spreadsheets and reports, agencies struggle to measure campaign performance, evaluate profitability, and monitor marketing ROI effectively.
This is exactly where the Content Marketing Agencies Dashboard in Power BI becomes an essential analytics solution.
The Content Marketing Agencies Dashboard in Power BI is a powerful and interactive business intelligence dashboard designed to help marketing agencies monitor campaign performance, analyze marketing costs, track revenue growth, and evaluate profitability across platforms, clients, and regions.
Instead of manually analyzing large marketing datasets, this dashboard transforms raw marketing data into interactive charts, KPI cards, and visual insights.
Because Power BI provides dynamic data visualization and real-time analytics, marketing teams can easily identify high-performing campaigns, optimize marketing budgets, and improve decision-making.
Whether you manage multiple marketing clients, digital campaigns, or content production teams, this dashboard helps you track marketing performance in a clear and structured way.
By using this dashboard, agencies can evaluate campaign profitability, client performance, engagement metrics, and marketing trends in one centralized reporting system.
As a result, organizations can make faster decisions, improve marketing strategies, and maximize their return on investment.
🚀 Key Features of Content Marketing Agencies Dashboard in Power BI
📊 Interactive Marketing KPI Monitoring
Track important marketing KPIs such as campaign cost, revenue, profit, engagement rate, and conversion rate through interactive visuals.
📈 Profitability and ROI Analysis
Analyze marketing profitability by comparing campaign costs with revenue and profit margins.
🎯 Dynamic Filters and Slicers
Filter the dashboard using parameters such as agency name, marketing platform, campaign objective, and time period.
📉 Platform Performance Tracking
Identify which content platforms generate the highest engagement, revenue, and conversions.
🌎 Client Region Performance Analysis
Evaluate marketing performance across different geographic regions and identify the most profitable markets.
📊 Monthly Marketing Trend Analysis
Monitor campaign performance trends across months to identify seasonal marketing patterns.
💼 Account Manager Performance Monitoring
Analyze profit contributions from different account managers and evaluate performance.
⚡ Powerful Data Visualization
Use Power BI charts and graphs to convert complex marketing data into easy-to-understand visual insights.
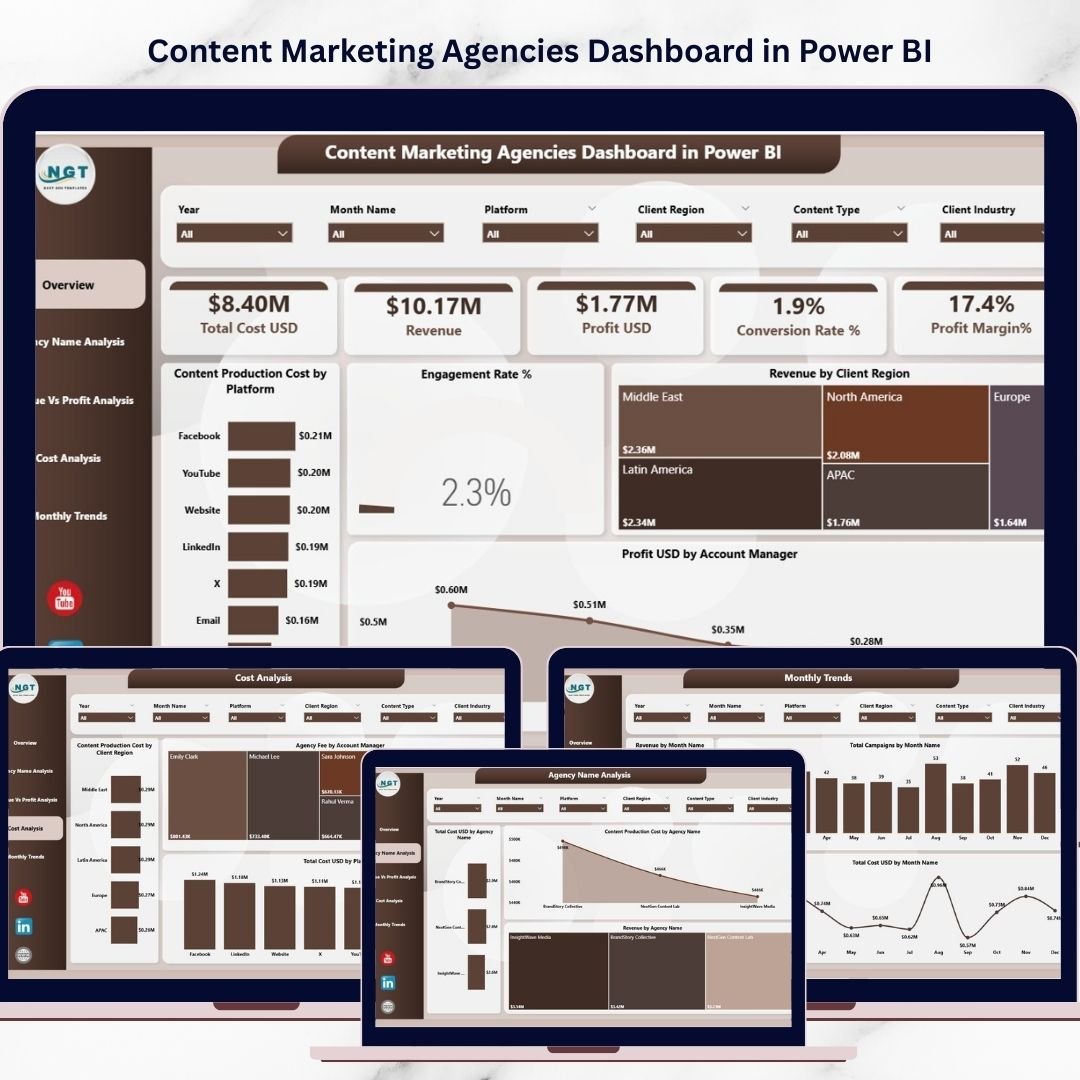
📦 What’s Inside the Content Marketing Agencies Dashboard in Power BI
This Power BI dashboard includes five analytical pages, each designed to provide specific insights into marketing performance.
📊 Overview Page – Marketing Performance Summary

The Overview Page provides a quick snapshot of overall campaign performance.
It includes five KPI cards:
-
Total Cost (USD)
-
Revenue
-
Profit (USD)
-
Conversion Rate (%)
-
Profit Margin (%)
Additionally, the page includes visual charts such as:
-
Content Production Cost by Platform
-
Engagement Rate (%)
-
Revenue by Client Region
-
Profit USD by Account Manager
These visuals allow marketing teams to quickly identify profitable platforms and high-performing campaigns.
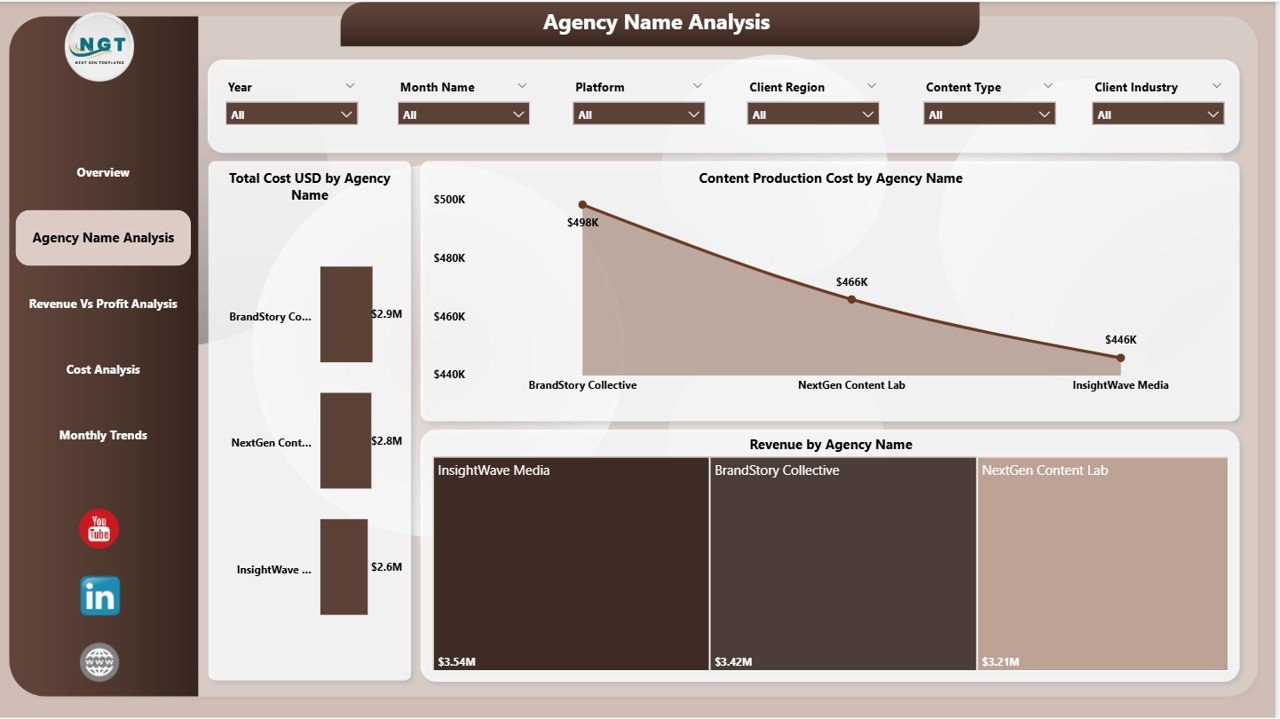
📈 Agency Name Analysis – Agency Performance Comparison
This page helps agencies analyze marketing performance across different agencies.
Key charts include:
-
Total Cost USD by Agency Name
-
Content Production Cost by Agency Name
-
Revenue by Agency Name
This analysis helps businesses evaluate the return on investment for each agency.
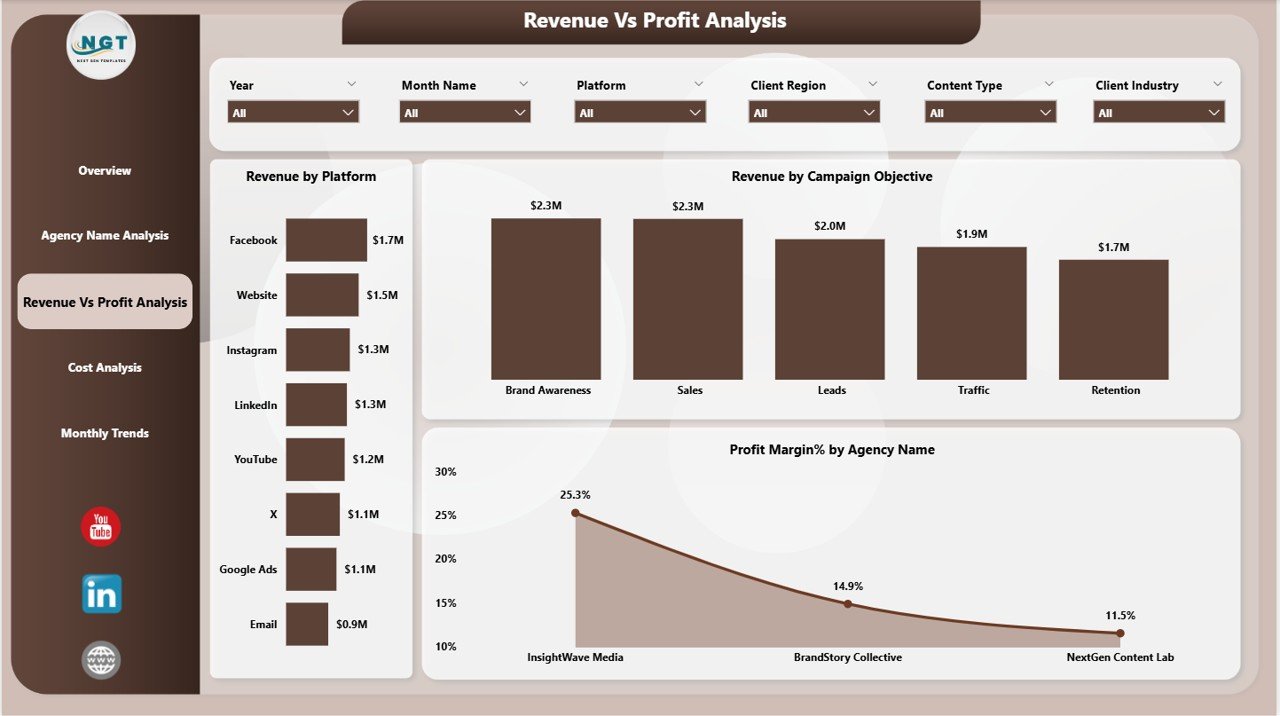
💰 Revenue vs Profit Analysis – Campaign Profitability Insights
This page focuses on campaign profitability.
Charts include:
-
Revenue by Platform
-
Revenue by Campaign Objective
-
Profit Margin (%) by Agency Name
These insights help marketing managers identify the most profitable marketing strategies.
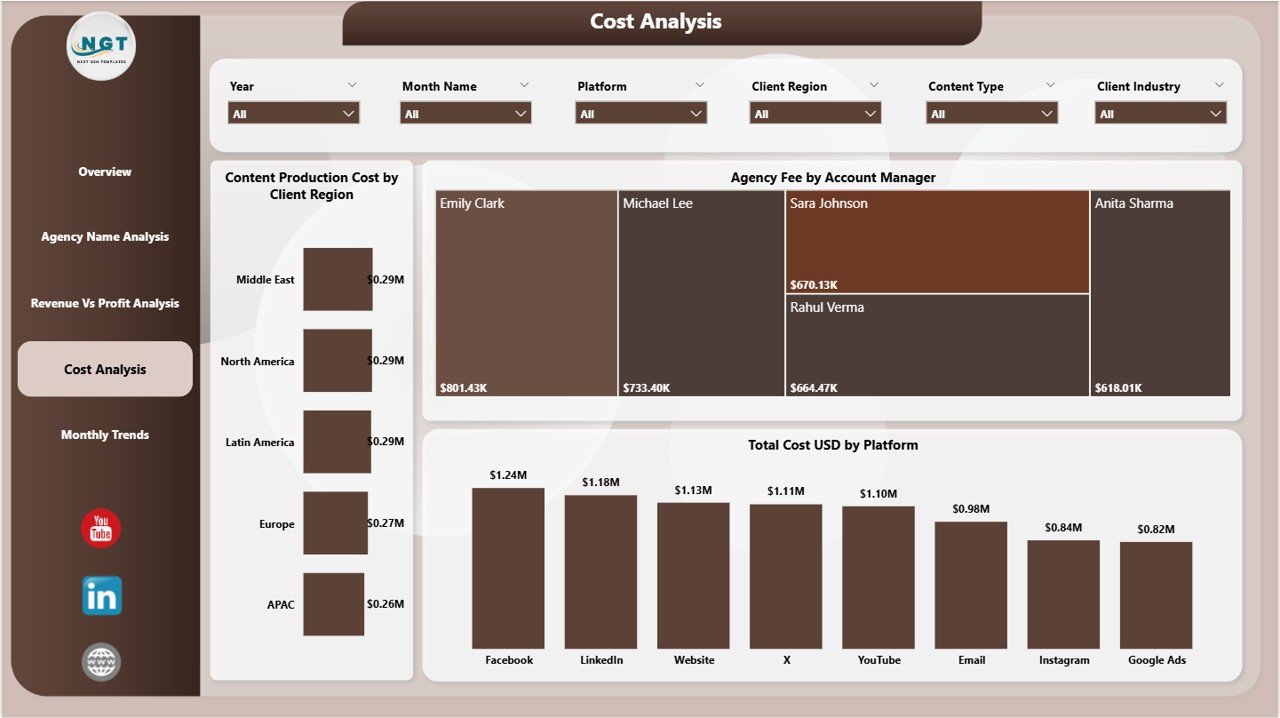
📊 Cost Analysis – Marketing Cost Breakdown
This page analyzes marketing spending patterns.
Charts include:
-
Content Production Cost by Client Region
-
Agency Fee by Account Manager
-
Total Cost USD by Platform
This analysis helps agencies manage marketing budgets efficiently.
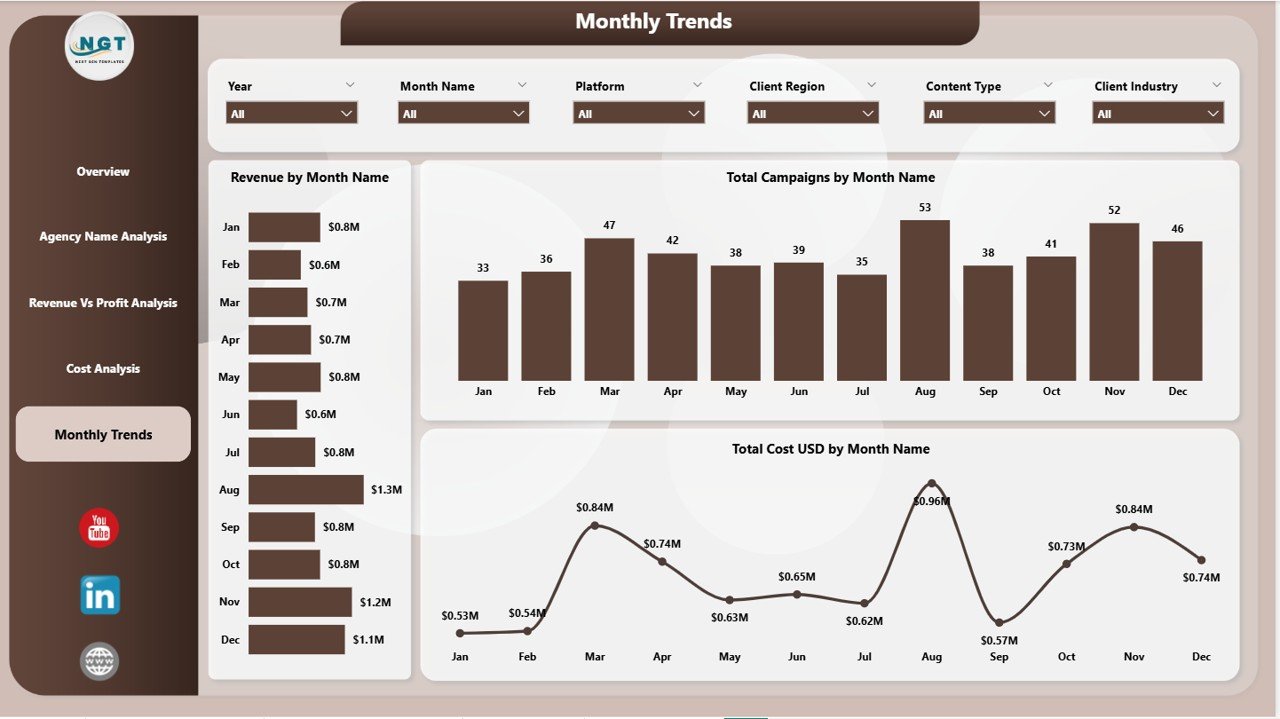
📅 Monthly Trends – Marketing Performance Over Time
The Monthly Trends Page analyzes performance trends throughout the year.
Charts include:
-
Revenue by Month Name
-
Total Campaigns by Month Name
-
Total Cost USD by Month Name
These insights help agencies understand seasonal marketing patterns and campaign growth.
🛠 How to Use the Content Marketing Agencies Dashboard in Power BI
Using this dashboard is simple and highly interactive.
1️⃣ Import marketing campaign data into the Power BI dataset.
2️⃣ Connect campaign metrics such as cost, revenue, and engagement.
3️⃣ Use dashboard slicers and filters to analyze marketing performance.
4️⃣ Review KPI cards and charts to evaluate campaign success.
5️⃣ Identify profitable campaigns and optimize marketing strategies.
Once the dashboard is connected to the data source, Power BI automatically refreshes the analytics visuals.
This allows marketing teams to track campaign performance in real time.
👥 Who Can Benefit from This Content Marketing Agencies Dashboard in Power BI
This dashboard is ideal for professionals involved in digital marketing and campaign analytics.
📊 Marketing Agencies – Monitor client campaigns and track marketing performance.
💼 Digital Marketing Managers – Evaluate campaign effectiveness and optimize marketing strategies.
📈 Marketing Analysts – Analyze engagement rates, conversions, and profitability.
🏢 Marketing Directors – Monitor ROI and marketing performance across multiple campaigns.
🌎 Content Marketing Teams – Track platform performance and improve campaign results.
By using this dashboard, agencies gain complete visibility into marketing performance, allowing them to improve strategies and maximize marketing ROI.
Click hare to read the Detailed blog post
Visit our YouTube channel to learn step-by-step video tutorials
👉 https://youtube.com/@PKAnExcelExpert