Highway projects run on tight budgets and tighter timelines. One delayed milestone… one unchecked cost spike… and margins disappear fast.
If your project reporting still depends on scattered spreadsheets, you’re reacting — not controlling.
Introducing the Road and Highway Construction Dashboard in Excel — a ready-to-use, interactive reporting solution designed for construction companies that demand clarity, control, and cost discipline.
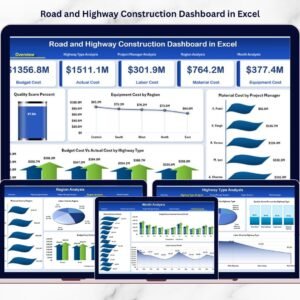
This powerful Excel dashboard centralizes equipment cost, material expense, labor spending, budget tracking, completion progress, and quality performance — all in one structured system.
No more manual consolidation. No more missed cost overruns. Just smart, visual project control.
🚀 Key Feature of Road and Highway Construction Dashboard in Excel
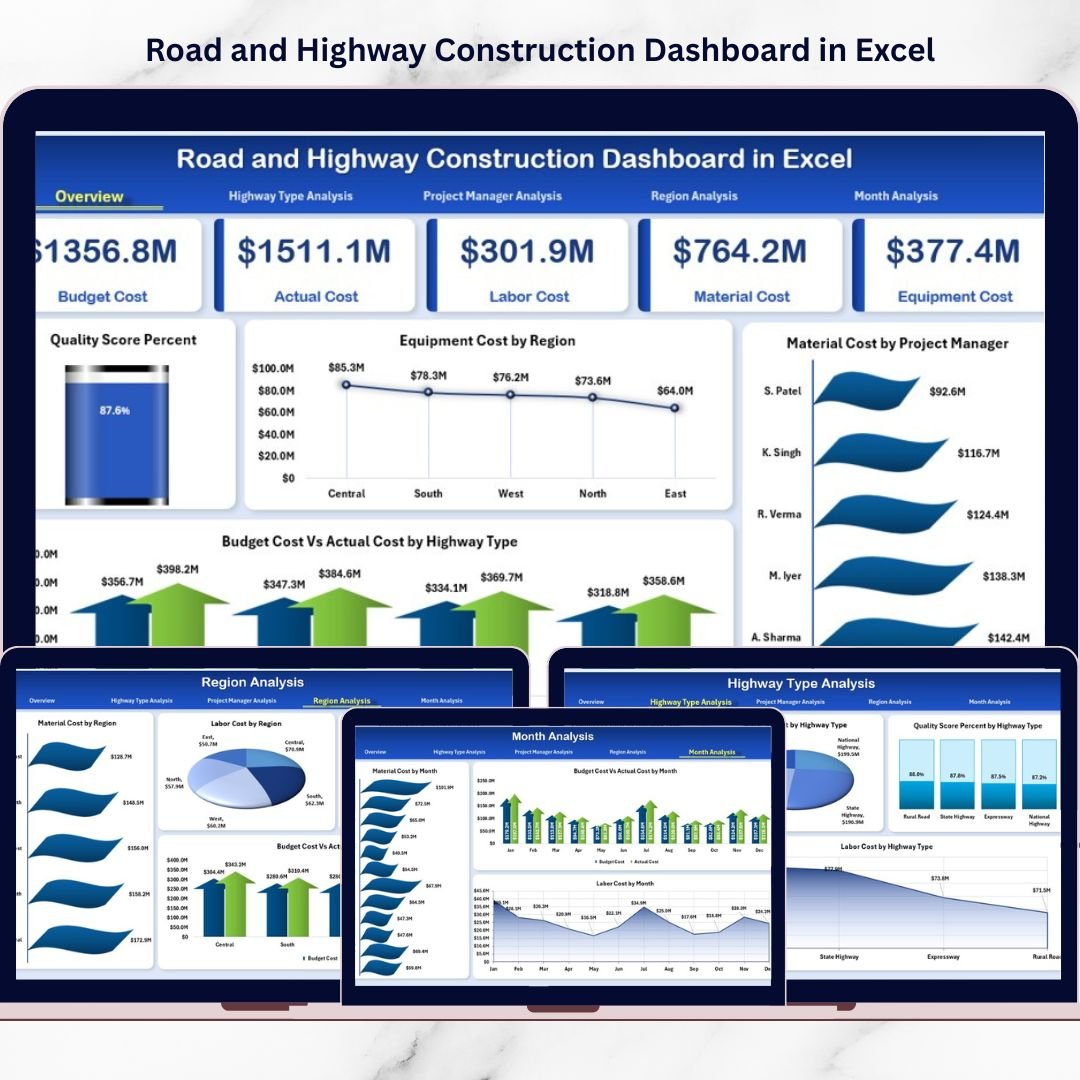
📊 5 Interactive Analytical Pages – Overview, Highway Type, Project Manager, Region & Month Analysis.
💰 Budget vs Actual Comparison – Instantly detect cost variance.
🏗 Equipment, Material & Labor Cost Tracking – Monitor every cost head separately.
📈 Completion & Quality Monitoring – Track progress % and quality score %.
🧭 Page Navigator for Smooth Navigation – Switch between pages instantly.
🔎 Right-Side Slicers – Filter by Region, Highway Type, Manager or Month.
⚡ Pivot-Based Dynamic Reporting – Update data and refresh instantly.
📦 What’s Inside the Road and Highway Construction Dashboard in Excel
This ready-to-use Excel file includes 5 structured dashboard pages plus Data and Support sheets.
1️⃣ Overview Page – The Project Command Center
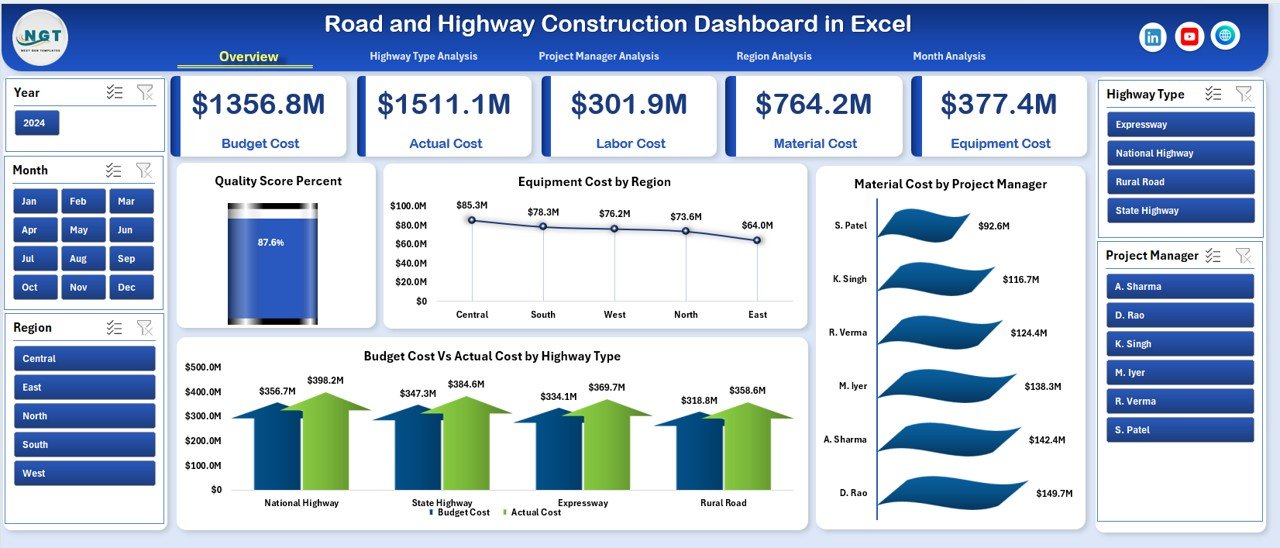
The Overview page gives an instant snapshot of your construction performance.
🔹 KPI Cards
Total Budget Cost
Total Actual Cost
Overall Completion %
Average Quality Score %
These cards immediately show financial and project health.
🔹 Analytical Charts
Quality Score %
Equipment Cost by Region
Material Cost by Project Manager
Budget vs Actual Cost by Highway Type
Spot cost variance, regional inefficiency, and quality risks within seconds.
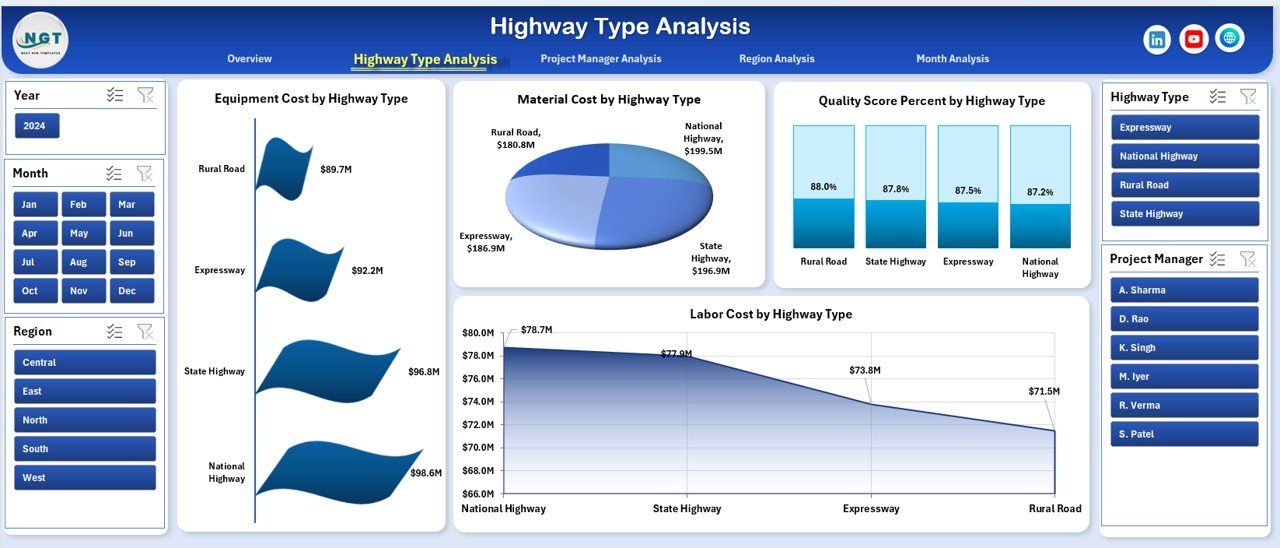
2️⃣ Highway Type Analysis – Cost & Performance by Category
Different highway types carry different cost structures:
National Highways
State Highways
Expressways
Rural Roads
🔹 Charts Included
Equipment Cost by Highway Type
Material Cost by Highway Type
Labor Cost by Highway Type
Quality Score % by Highway Type
Allocate machinery and workforce based on performance clarity.
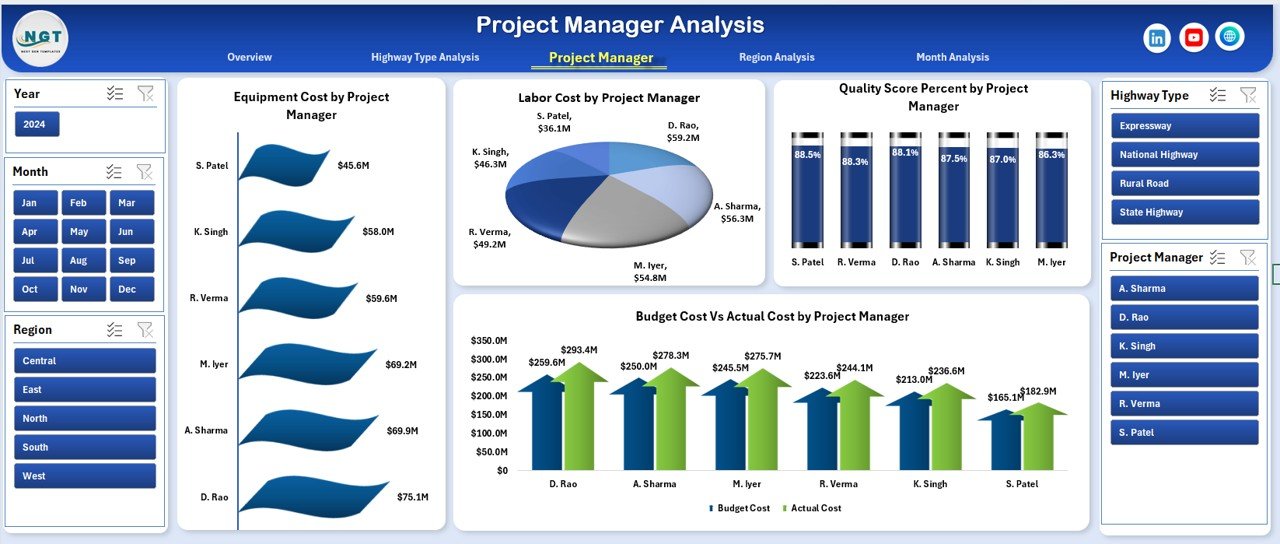
3️⃣ Project Manager Analysis – Performance Accountability
Evaluate cost control and quality maintenance by manager.
🔹 Charts Included
Equipment Cost by Project Manager
Labor Cost by Project Manager
Budget vs Actual by Project Manager
Quality Score % by Project Manager
Identify top-performing managers and benchmark best practices.
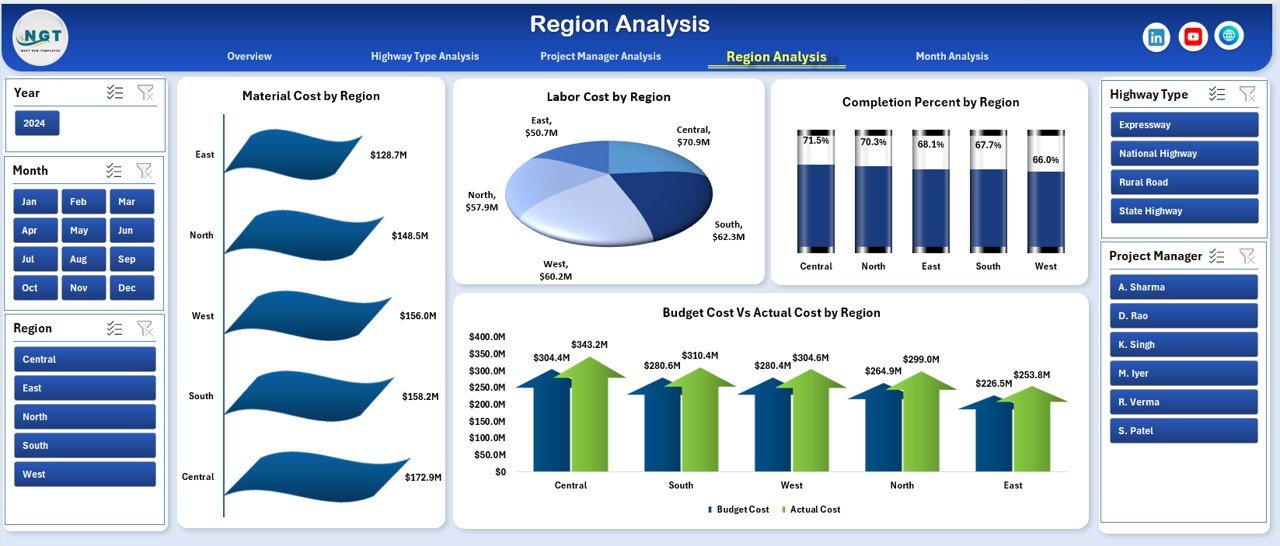
4️⃣ Region Analysis – Compare Regional Efficiency
Large infrastructure firms operate across multiple regions.
🔹 Charts Included
Material Cost by Region
Labor Cost by Region
Completion % by Region
Budget vs Actual by Region
Detect regional cost spikes and resource imbalance early.
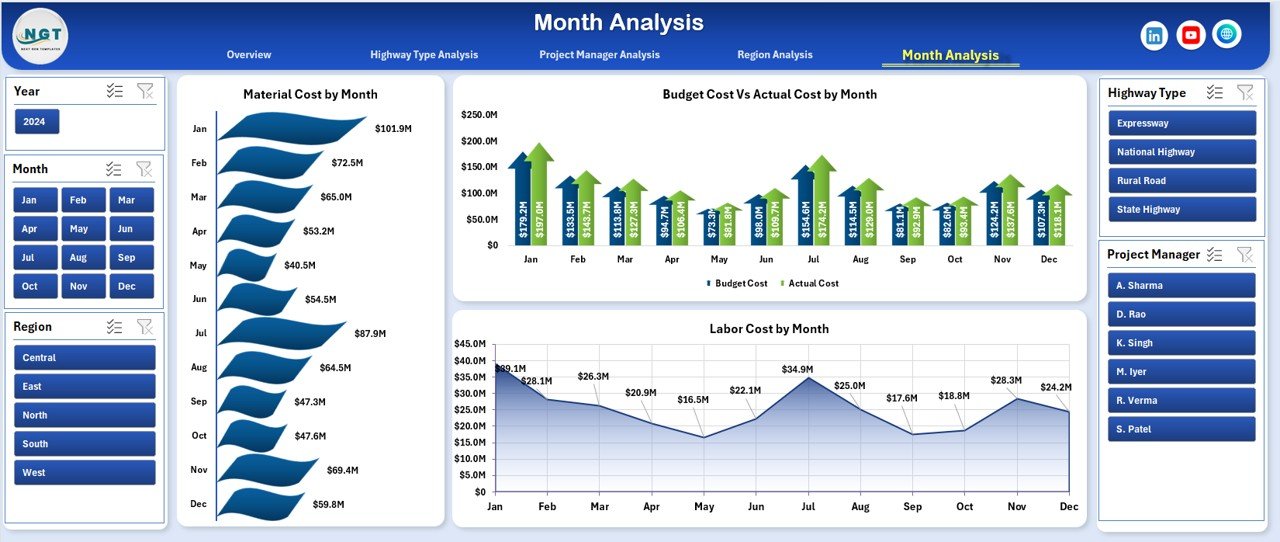
5️⃣ Month Analysis – Trend & Seasonal Monitoring
Construction costs fluctuate monthly due to:
Material price changes
Weather conditions
Labor availability
🔹 Charts Included
Material Cost by Month
Labor Cost by Month
Budget vs Actual by Month
Monitor trends and plan proactively.
🛠 How to Use the Road and Highway Construction Dashboard in Excel
1️⃣ Enter structured project data in the Data Sheet.
2️⃣ Refresh Pivot Tables.
3️⃣ Use slicers to filter performance instantly.
4️⃣ Review KPI cards and variance charts.
5️⃣ Conduct monthly cost review meetings using the dashboard.
No complex setup required.
📊 Data Structure Included
Data Sheet Fields:
Project Name
Region
Highway Type
Project Manager
Equipment Cost
Material Cost
Labor Cost
Budget Cost
Actual Cost
Quality Score %
Completion %
Month
Support Sheet:
Helper calculations
Pivot backend tables
Data validation lists
Clean structure ensures smooth reporting.
👥 Who Should Use This Dashboard?
✔ Construction Company Owners
✔ Project Managers
✔ Site Engineers
✔ Finance Controllers
✔ Regional Heads
✔ Infrastructure Consultants
If you manage highway or road construction projects, this dashboard brings discipline to your reporting process.
💡 How This Dashboard Improves Profitability
Construction margins often range between 5%–12%. Even small improvements matter.
✔ Early detection of cost overruns
✔ Improved equipment utilization
✔ Reduced material waste
✔ Better labor allocation
✔ Higher quality control
For example, reducing cost variance by just 2% on a ₹50 crore project saves ₹1 crore instantly.
That’s the power of structured tracking.
🎯 Why Choose Excel?
✔ No expensive BI software required
✔ Easy customization
✔ Widely accessible
✔ Pivot & slicer-based dynamic reporting
✔ Fast implementation
Perfect for small, medium, and large construction firms.
If you want stronger cost control, improved project monitoring, and better executive visibility, this dashboard delivers exactly that.
Move from scattered reporting to structured control.
Click here to read the Detailed blog post
Visit our YouTube channel to learn step-by-step video tutorials
👉 YouTube Channel – PKAnExcelExpert