Digital transformation is no longer optional. Companies invest in automation, AI, cloud systems, cybersecurity, and digital workflows. However, without measurable tracking, leadership cannot determine whether these investments truly deliver results.
Scattered spreadsheets.
Unclear performance metrics.
Delayed insights.
That’s why you need a Digital Transformation KPI Scorecard in Excel — a structured, ready-to-use performance tracking system designed to measure digital progress clearly and professionally.
This powerful Excel template helps organizations monitor MTD (Month-To-Date) and YTD (Year-To-Date) performance, compare Actual vs Target, analyze trends, and maintain structured KPI documentation — all within one centralized workbook.
🔍 Key Feature of Digital Transformation KPI Scorecard in Excel
This ready-to-use template includes 4 structured worksheets built for clarity and performance tracking.

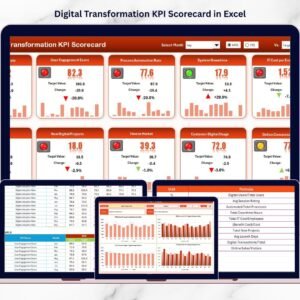
📊 Scorecard Sheet – Main Performance Dashboard
✔ Select Month from dropdown
✔ Switch between MTD and YTD view
✔ Actual vs Target comparison
✔ Conditional formatting indicators (Green / Red / Yellow)
✔ Structured KPI overview
Instantly identify underperforming KPIs and take corrective action.
📈 KPI Trend Sheet – Performance Analysis Over Time
✔ Select KPI from dropdown (Cell C3)
✔ View KPI Group, Unit, Type (LTB / UTB)
✔ See Formula and Definition
✔ MTD Trend Chart (Actual vs Target vs PY)
✔ YTD Trend Chart (Actual vs Target vs PY)
This sheet helps you analyze long-term digital growth patterns.
🗂 Input Data Sheet – Central Data Engine
✔ Enter monthly Actual values
✔ Enter monthly Target values
✔ Excel formulas update scorecard automatically
✔ No manual calculations required
📘 KPI Definition Sheet – Structured Documentation
✔ KPI Name
✔ KPI Group
✔ Unit
✔ Formula
✔ Definition
Maintain transparency and ensure every KPI remains clearly defined.
📦 What’s Inside the Digital Transformation KPI Scorecard in Excel
When you download this template, you get:
✔ 4 fully structured worksheets
✔ Automated MTD & YTD comparison
✔ Conditional formatting indicators
✔ Trend charts for performance tracking
✔ Customizable KPI definitions
✔ Editable targets and formulas
✔ Ready-to-use professional layout
This is not just an Excel file — it’s a structured digital performance management system.
🛠 How to Use the Digital Transformation KPI Scorecard in Excel
Using the template is simple:
1️⃣ Define your digital KPIs in the KPI Definition sheet.
2️⃣ Enter monthly Actual and Target values in the Input Data sheet.
3️⃣ Select Month and View (MTD/YTD) in the Scorecard sheet.
4️⃣ Analyze performance and review trend charts.
The dashboard updates automatically — no manual recalculation required.
👥 Who Can Benefit from This Digital Transformation KPI Scorecard?
This template is ideal for:
🏢 Corporate Enterprises
🏭 Manufacturing Companies
💻 IT & Technology Firms
🏦 Financial Institutions
🏥 Healthcare Organizations
🎓 Educational Institutions
🚀 Startups Scaling Digitally
📊 Digital Transformation Leaders
If your organization invests in digital initiatives, this scorecard ensures measurable accountability.
🎯 Why Choose Digital Transformation KPI Scorecard in Excel?
✔ Centralized KPI monitoring
✔ Clear Actual vs Target comparison
✔ MTD & YTD structured tracking
✔ Trend analysis for long-term insights
✔ Flexible and fully customizable
✔ Cost-effective alternative to complex BI tools
✔ Easy adoption across departments
Instead of guessing digital progress, you measure it.
Click here to read the Detailed blog post
Visit our YouTube channel for step-by-step tutorials:
👉 https://youtube.com/@PKAnExcelExpert
Watch the step-by-step video tutorial:
Compatibility and Requirements
- Works in Microsoft Excel desktop (Excel 2016 or later, or Microsoft 365).
- You pick the month and the KPI from dropdown cells, and the Scorecard sheet uses color indicators (Green, Red, Yellow). Microsoft explains the feature in Use conditional formatting to highlight information in Excel.
Frequently Asked Questions
Which sheets are included?
Four sheets: Scorecard, KPI Trend, Input Data and KPI Definition.
How do I update the scorecard?
Enter the monthly Actual and Target values in the Input Data sheet. Then select a month and the MTD or YTD view on the Scorecard sheet, and it updates through Excel formulas.
Can I see the trend for a single KPI?
Yes. On the KPI Trend sheet, pick a KPI from the dropdown in cell C3. The sheet shows its group, unit, type (LTB or UTB), formula and definition, plus MTD and YTD trend charts comparing Actual, Target and previous year.
Can I change the KPIs, targets and formulas?
Yes. KPI names, groups, units, formulas and definitions are kept in the KPI Definition sheet, and targets are entered in the Input Data sheet, so you can edit both.
Is there a dashboard version of this template?
Yes. See the Digital Transformation KPI Dashboard in Excel, the Digital Transformation KPI Dashboard in Power BI and the Digital Transformation KPI Dashboard in Google Sheets.
Related Digital Transformation and KPI Scorecard Templates
- Digital Transformation KPI Dashboard in Excel: a dashboard view of the same topic
- Digital Transformation KPI Dashboard in Power BI: the Power BI edition
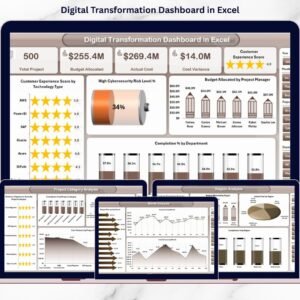
- Digital Transformation Dashboard in Excel: another Excel dashboard for digital programs
- Cybersecurity KPI Scorecard in Excel: a scorecard for security metrics
- Digital Learning KPI Scorecard in Excel: a scorecard for digital learning
Browse all Excel KPI dashboards.