What if you could track energy, water, occupancy, waste, and emissions in one powerful screen — without juggling multiple Excel files?
The Office Sustainability Dashboard in Power BI is your ready-to-use ESG performance command center. Designed for modern offices, this dashboard helps you monitor energy consumption (kWh), renewable share, water usage (m³), waste generation (kg), occupancy rates, and carbon emissions (kg CO₂) — all in one structured system.
Instead of reacting to rising costs and compliance pressure, you start making proactive, data-driven sustainability decisions.
This is not just a dashboard.
It’s your sustainability control room.
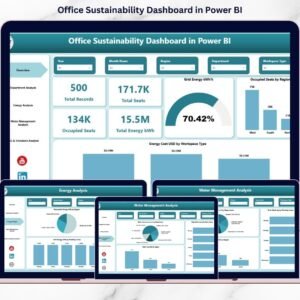
🚀 Key Features of Office Sustainability Dashboard in Power BI
🔹 5 Interactive Dashboard Pages – Overview, Department Analysis, Energy Analysis, Water Management, and ESG & Emissions.
🔹 Dynamic Slicers – Filter by Region, Department, Workspace Type, and Time Period instantly.
🔹 Powerful KPI Cards – Track Total Energy (kWh), Total Seats, Occupied Seats, and Total Records at a glance.
🔹 Renewable vs Grid Energy Tracking – Monitor renewable adoption and reduce grid dependency.
🔹 Department-Level Energy & Cost Comparison – Identify high-consumption areas quickly.
🔹 Water & Waste Monitoring – Track water consumption (m³), waste (kg), and cost trends.
🔹 Business Travel Emissions Analysis – Measure carbon footprint from travel activities.
🔹 Energy Intensity Insights – Analyze kWh per square foot for workspace efficiency.
🔹 ESG-Ready Reporting – Support sustainability audits and investor transparency.
🔹 Interactive Visuals with Drill Capability – Compare regions, sites, and departments in seconds.
📊 What’s Inside the Office Sustainability Dashboard in Power BI
This dashboard includes 5 fully designed Power BI pages:
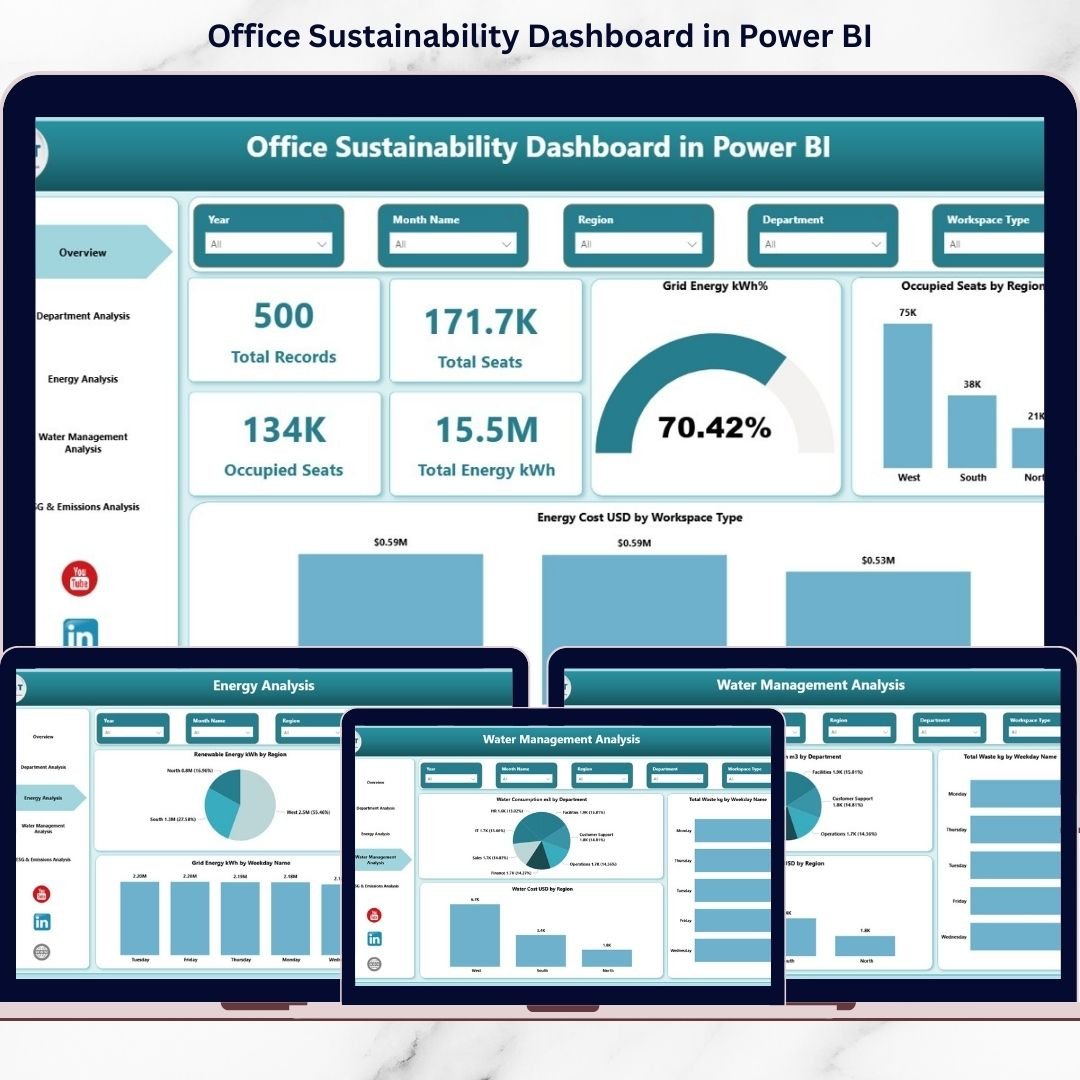
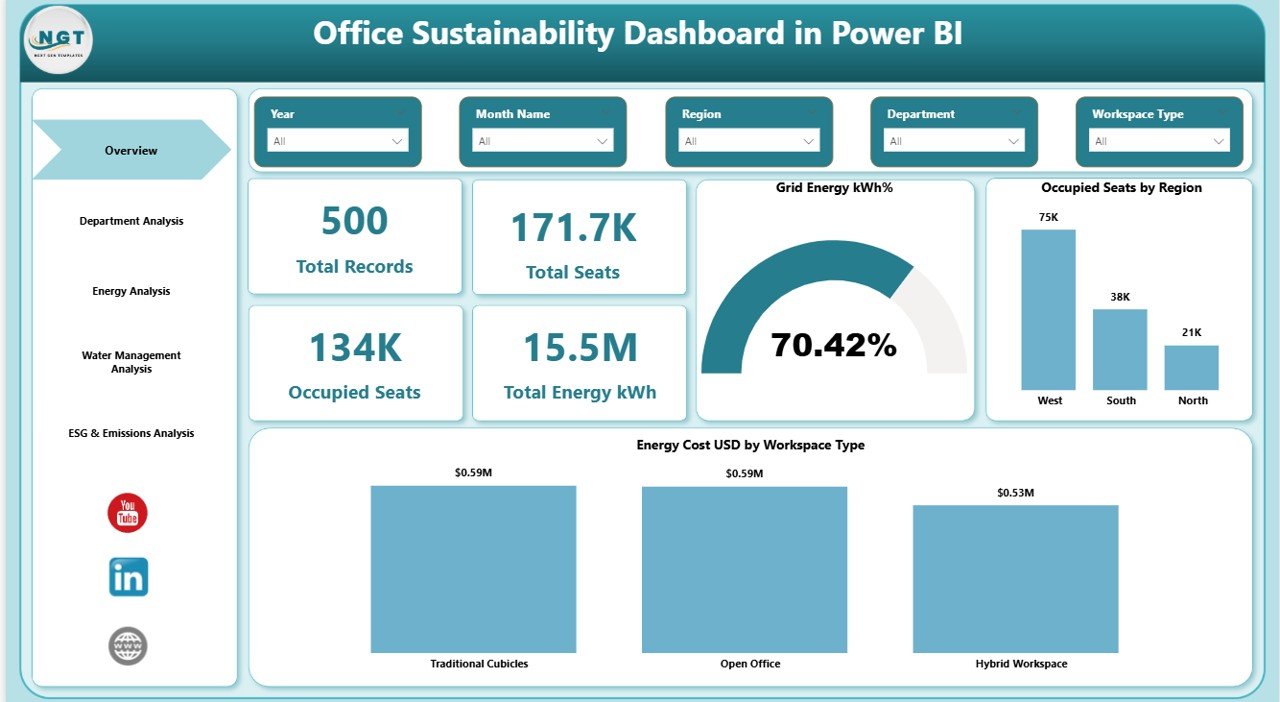
1️⃣ Overview Page
Your sustainability snapshot. KPI cards show Total Records, Total Seats, Occupied Seats, and Total Energy (kWh). Visuals display Grid Energy %, Occupied Seats by Region, and Energy Cost by Workspace Type.
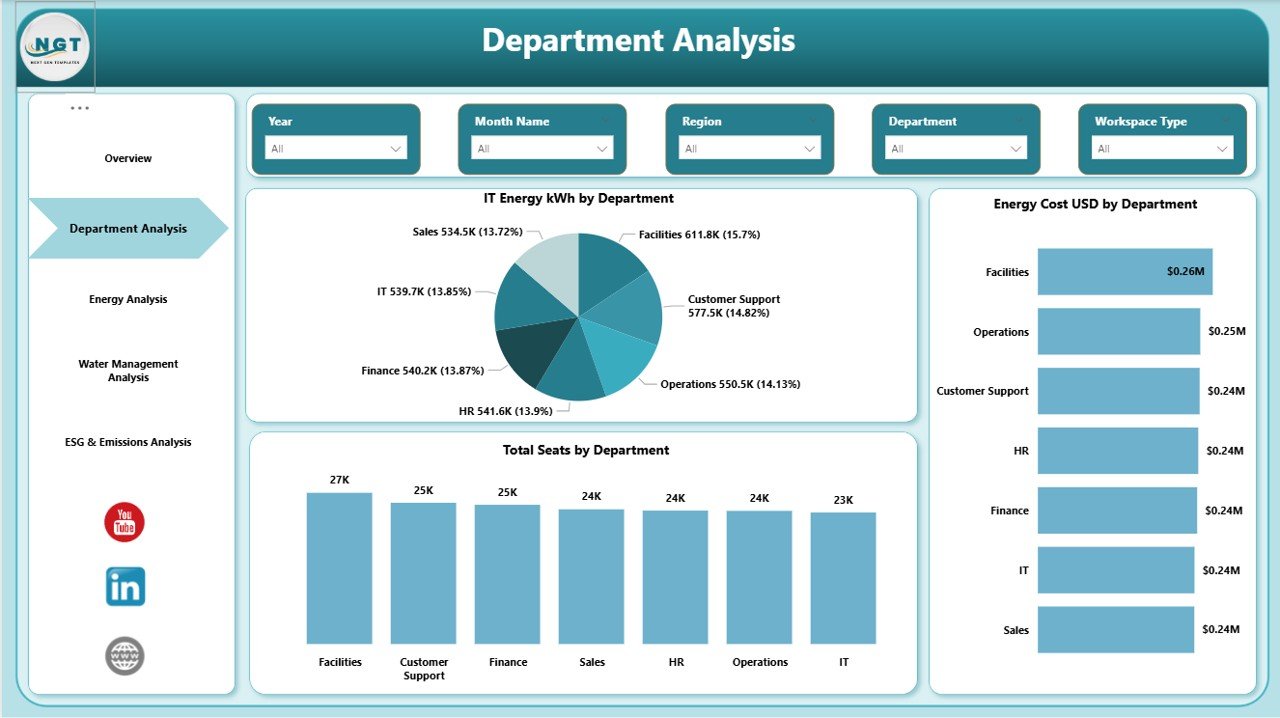
2️⃣ Department Analysis
Compare Energy kWh, Energy Cost (USD), and Total Seats across departments to identify inefficiencies.
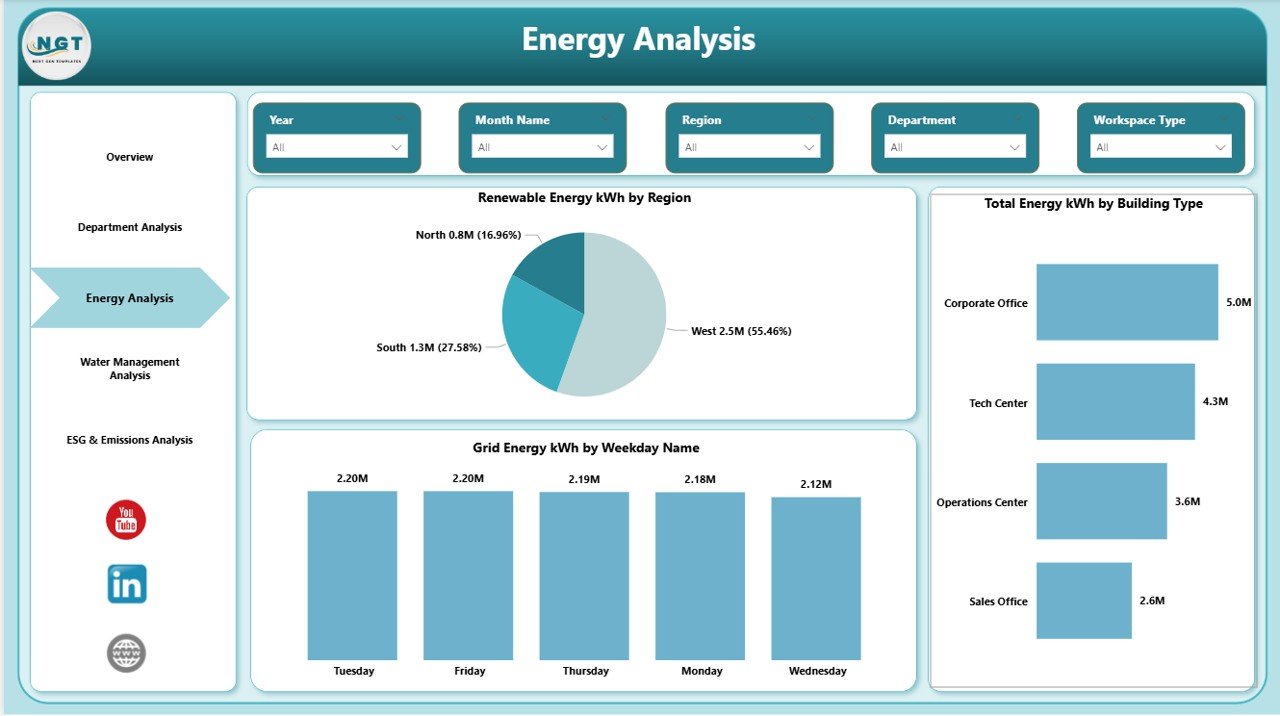
3️⃣ Energy Analysis
Track Renewable Energy (kWh), Total Energy by Region, and Grid Energy by Weekday Name to identify peak consumption patterns.
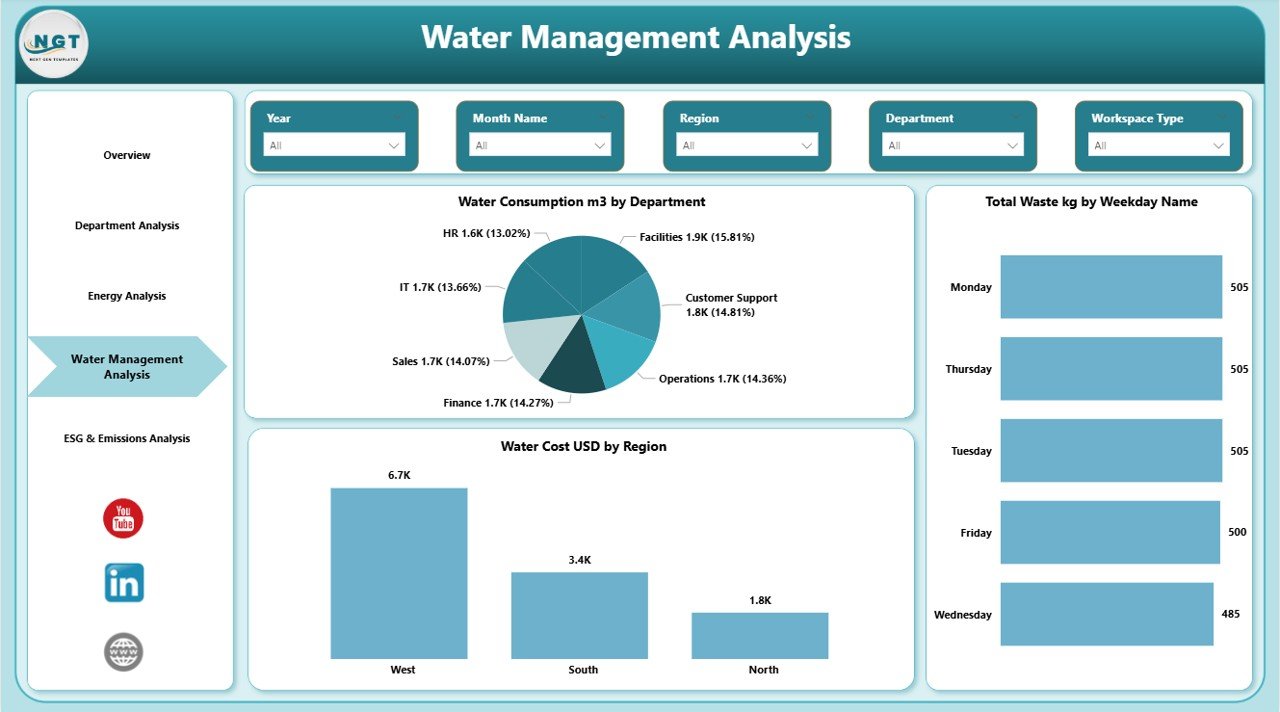
4️⃣ Water Management Analysis
Monitor Water Consumption (m³), Total Waste (kg), and Water Cost (USD) across regions and departments.
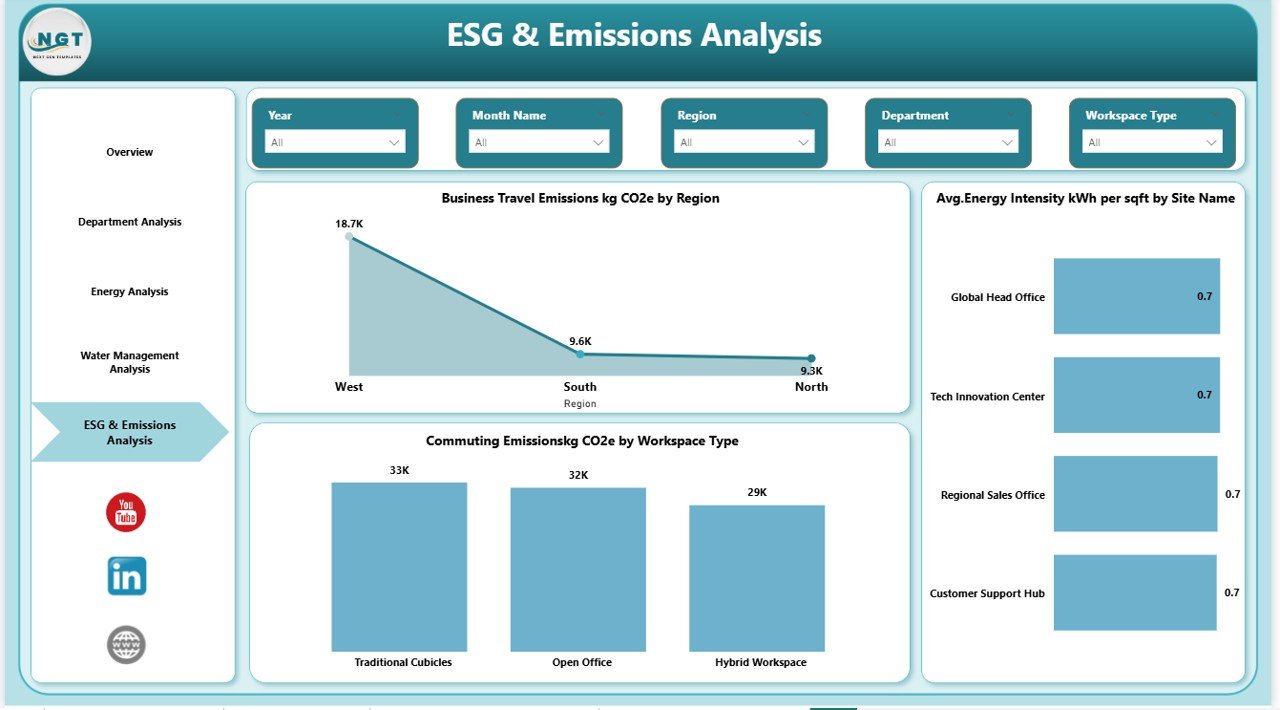
5️⃣ ESG & Emissions Analysis
Analyze Business Travel Emissions (kg CO₂) and Average Energy Intensity (kWh per sqft) by site.
Each page is professionally structured, interactive, and ready for executive presentations.
⚙️ How to Use the Office Sustainability Dashboard in Power BI
Using this dashboard is simple:
1️⃣ Connect your structured energy, water, and occupancy data.
2️⃣ Refresh the dataset monthly.
3️⃣ Use slicers to filter by region or department.
4️⃣ Compare KPI trends instantly.
5️⃣ Share insights with leadership teams.
You can also customize KPIs, modify DAX measures, and expand ESG metrics based on your sustainability goals.
👥 Who Can Benefit from This Office Sustainability Dashboard?
✔️ Sustainability Managers
✔️ ESG & Compliance Teams
✔️ Facility Managers
✔️ Operations Heads
✔️ CFOs & Finance Teams
✔️ Corporate Strategy Leaders
If your organization tracks energy (kWh), water (m³), waste (kg), emissions (kg CO₂), and occupancy %, this dashboard becomes a critical decision-making tool.
With rising ESG regulations and increasing investor scrutiny, sustainability tracking is no longer optional. This dashboard empowers you to:
• Reduce energy costs
• Increase renewable energy adoption
• Monitor occupancy efficiency
• Lower carbon emissions
• Improve ESG transparency
Make sustainability measurable. Make ESG actionable. Make leadership confident.
Click here to read the Detailed blog post
Watch the step-by-step video tutorial: