

Event planning is fast, dynamic, and demanding. Budgets change. Deadlines move. Vendors coordinate. Attendees expect perfection. One small oversight can impact the entire event experience.
Yet many event planners still manage performance using scattered spreadsheets. Event Planning KPI Scorecard in Excel as a result, budget overruns go unnoticed. Attendance trends remain unclear. Marketing effectiveness becomes difficult to measure.
If you want full control over your events, you need a structured performance system.
Introducing the Event Planning KPI Scorecard in Excel — a powerful, ready-to-use dashboard designed specifically for event managers, agencies, and planners who want clarity, control, and profitability.
Event Planning KPI Scorecard in Excel This Excel-based scorecard allows you to track revenue, costs, attendee satisfaction, vendor performance, and marketing ROI — all in one organized and automated system.
Stop guessing. Start measuring. 🎯📊
🚀 Key Feature of Event Planning KPI Scorecard in Excel
This scorecard is built to give you complete visibility into event performance.
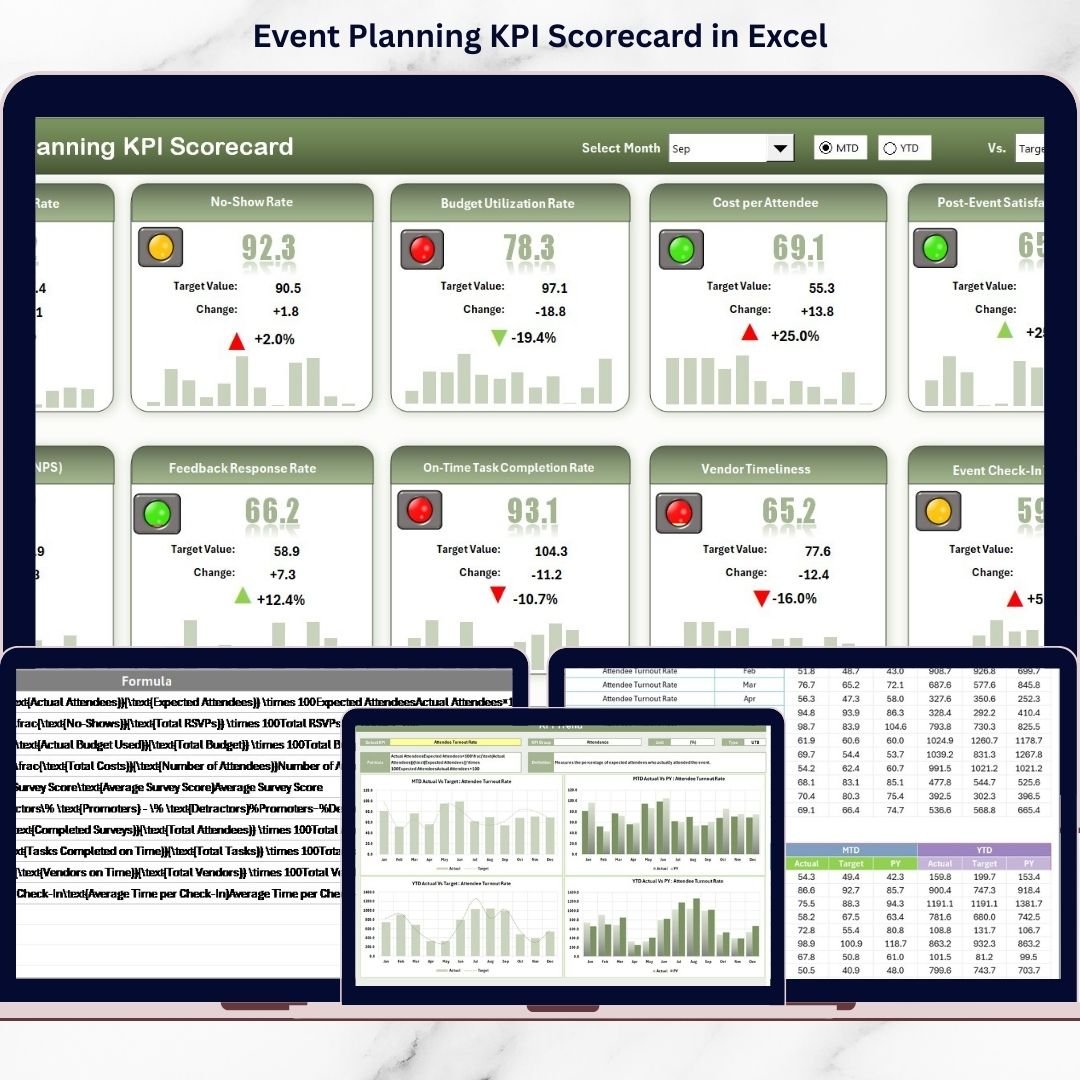
📊 Centralized Event Dashboard
Monitor all financial, operational, and attendee KPIs in one structured interface.
📅 Month Selection Dropdown
Switch between months and instantly update results.
📈 MTD & YTD Tracking
Analyze short-term and long-term performance with ease.
🎯 Actual vs Target vs Previous Year Comparison
Identify gaps and measure event success quickly.
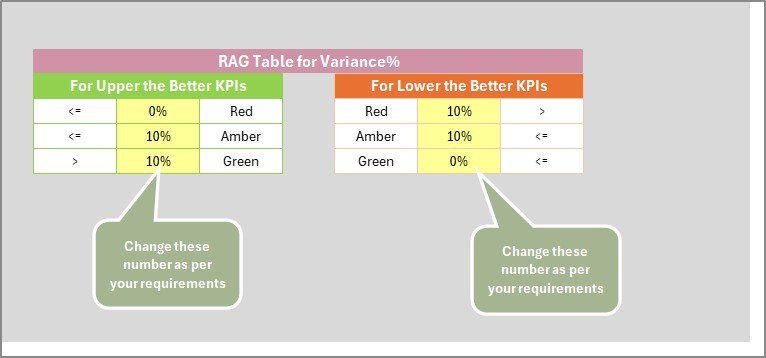
🚦 Visual Performance Indicators
Color-coded signals, arrows, and conditional formatting show KPI direction instantly.
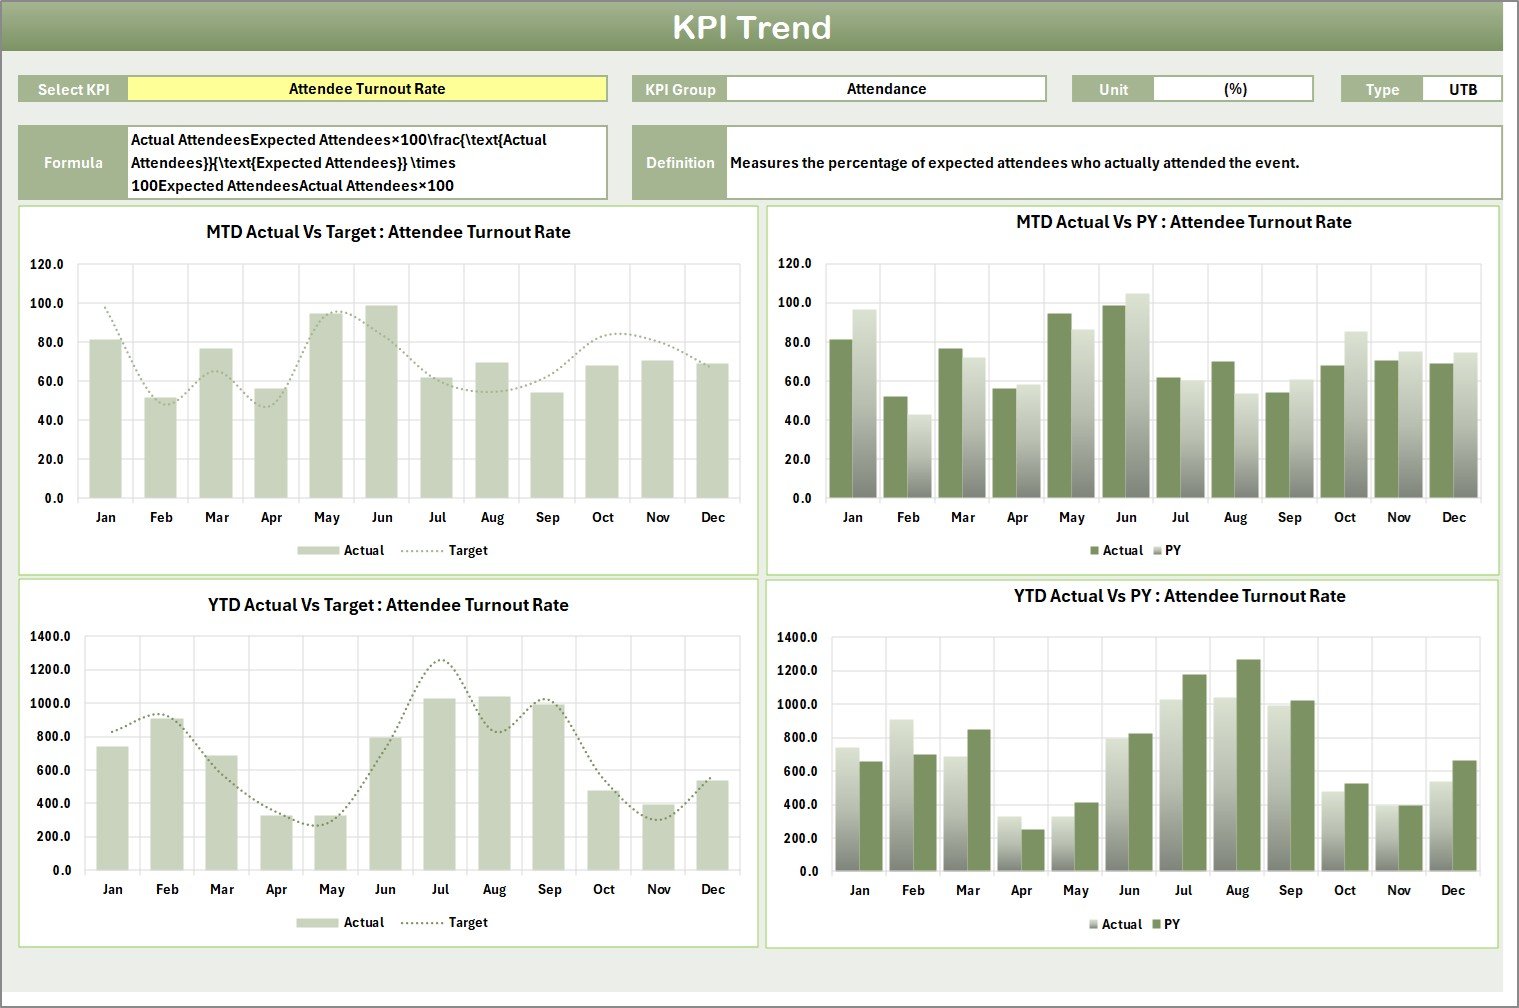
📉 KPI Trend Analysis Sheet
Select any KPI and analyze detailed monthly trend charts.
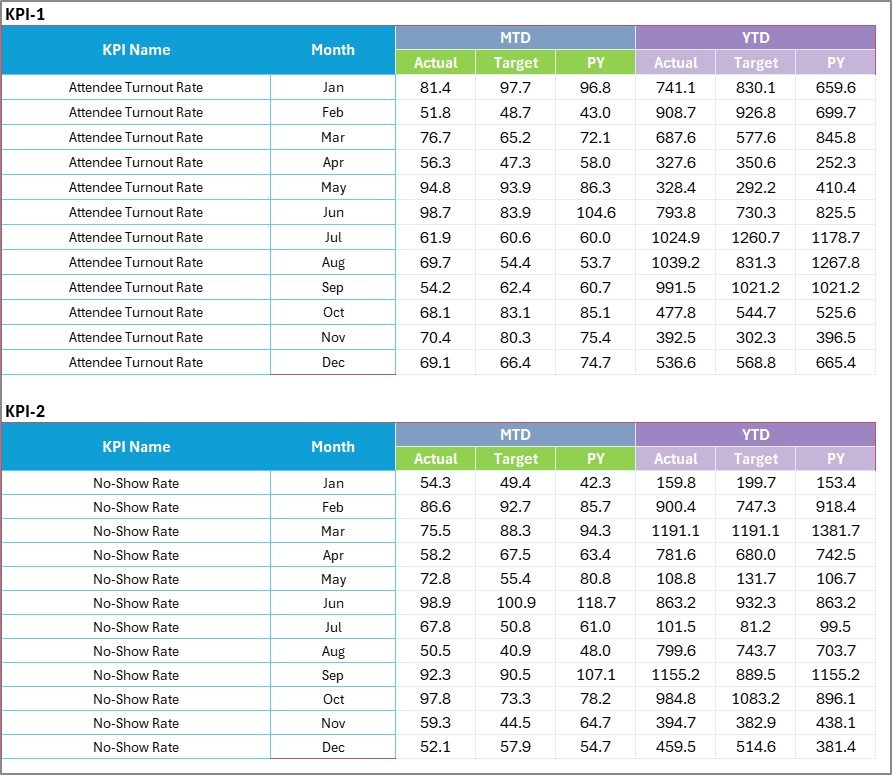
📝 Structured Input Data Sheet
Enter revenue, cost, attendance, and marketing data easily.
📘 KPI Definition Sheet
Standardize formulas and definitions to avoid confusion.
This is not just an Excel file — it is your event performance command center.
📦 What’s Inside the Event Planning KPI Scorecard in Excel
This ready-to-use Excel template includes 4 powerful worksheets:
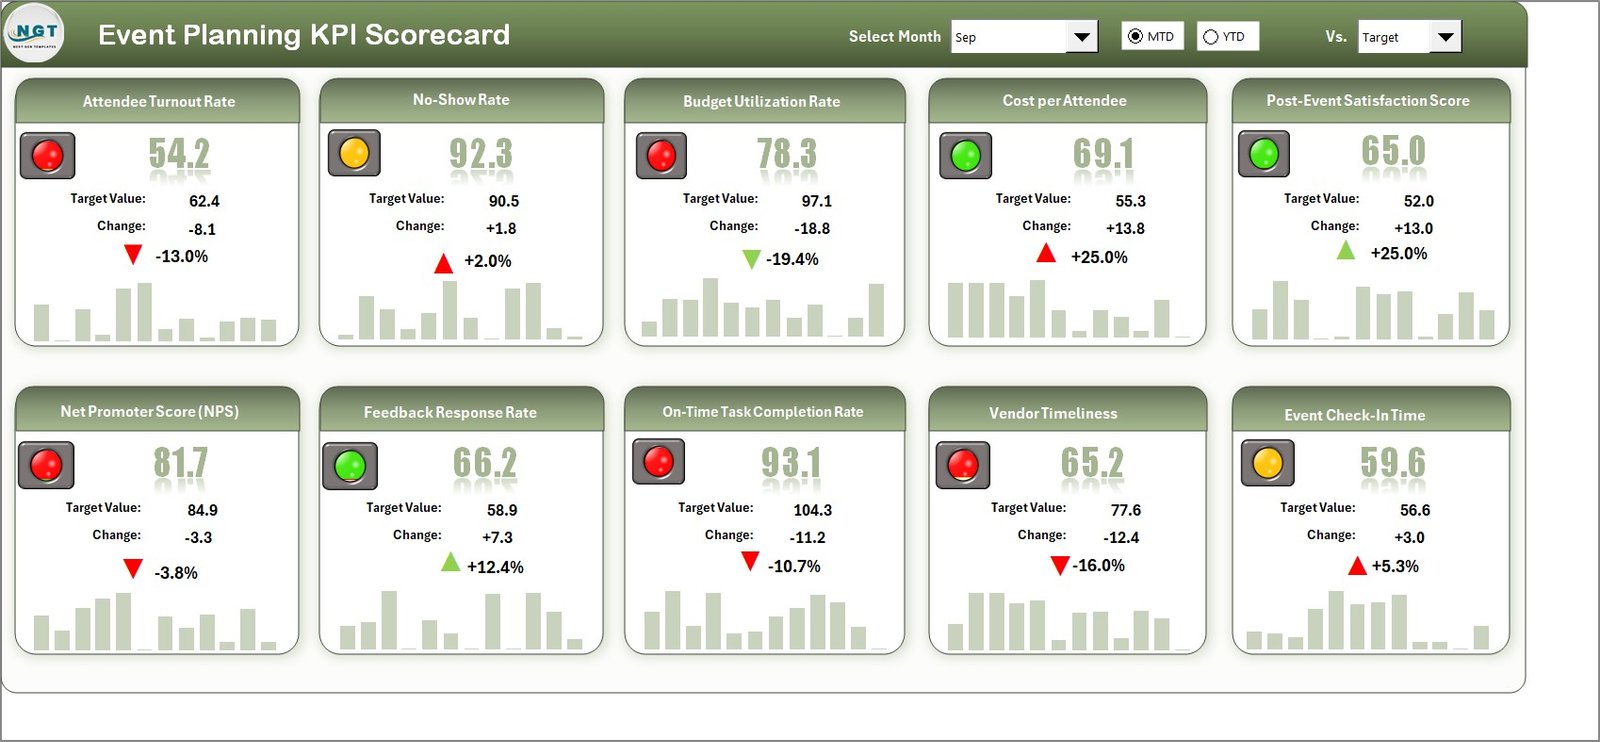
🎯 1. Scorecard Sheet
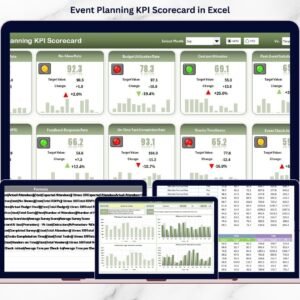
The main dashboard where you can view all KPIs at once. Select Month, MTD, or YTD and watch the dashboard update automatically.
📈 2. KPI Trend Sheet
Choose any KPI from the dropdown (Cell C3) and analyze its trend over time. View KPI group, type, unit, formula, and definition instantly.
📝 3. Input Data Sheet
Enter actual event data such as revenue, costs, registrations, and vendor performance. The dashboard updates automatically.
📘 4. KPI Definition Sheet
Define KPI name, group, unit, formula, and explanation to maintain consistency across projects.
Everything is organized. Everything is automated. Everything is simple.
⚙️ How to Use the Event Planning KPI Scorecard in Excel
Using this template is easy:
1️⃣ Enter monthly data in the Input Data Sheet.
2️⃣ Select the desired month from the Scorecard dropdown.
3️⃣ Review MTD and YTD comparisons.
4️⃣ Analyze performance trends in the KPI Trend Sheet.
5️⃣ Take corrective action if needed.
No advanced Excel knowledge required. Basic skills are enough.
You can track:
Total Event Revenue
Total Event Cost
Net Profit
Event ROI
Lead Conversion Rate
Attendance Rate
Vendor Performance Score
Customer Satisfaction Score
Make smarter decisions before your next event begins.
🎉 Who Can Benefit from This Event Planning KPI Scorecard in Excel
This template is ideal for:
🎤 Corporate Event Planners
💍 Wedding Planners
🏢 Event Management Agencies
🎪 Exhibition Organizers
🎓 Conference Coordinators
🎶 Festival Organizers
📊 Marketing Teams
🚀 Freelance Event Consultants
Whether you manage small private events or large corporate conferences, this scorecard adapts to your needs.
Event success is not luck — it is measurable.
When you monitor KPIs regularly, you:
✔ Control budgets effectively
✔ Improve attendee satisfaction
✔ Enhance vendor coordination
✔ Increase marketing efficiency
✔ Deliver measurable results to clients
✔ Improve overall profitability
Instead of relying on manual reports, use one powerful Excel-based system to track, analyze, and optimize your events.
If you want to deliver professional, profitable, and perfectly organized events every time, this Event Planning KPI Scorecard in Excel is your solution.
Click hare to read the Detailed blog post
Visit our YouTube channel to learn step-by-step video tutorials
👉 https://www.youtube.com/@PKAnExcelExpert
Watch the step-by-step video tutorial:
Compatibility and Requirements
- Works in Microsoft Excel desktop (Excel 2016 or later, or Microsoft 365).
- The month and KPI are picked from dropdowns. Microsoft explains these lists in Create a drop-down list.
Frequently Asked Questions
Which sheets are in the workbook?
Scorecard, KPI Trend, Input Data and KPI Definition sheets.
Which KPIs can I track?
Total event revenue, total event cost, net profit, event ROI, lead conversion rate, attendance rate, vendor performance score and customer satisfaction score.
How do I see a single KPI over time?
Choose the KPI from the dropdown in cell C3 of the KPI Trend sheet to see its trend, group, type, unit, formula and definition.
Is there a dashboard version?
Yes. See the Event Planning KPI Dashboard in Excel.
Related Event Planning Templates
- Event Planning KPI Dashboard in Excel: the dashboard view of event KPIs
- Event Planning KPI Dashboard in Google Sheets: event KPIs online
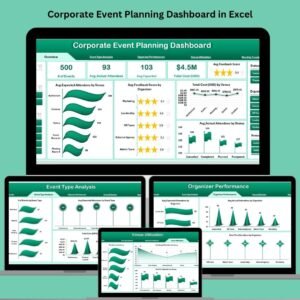
- Corporate Event Planning Dashboard in Excel: for corporate events
- Event Planning Calendar in Excel: plan event dates
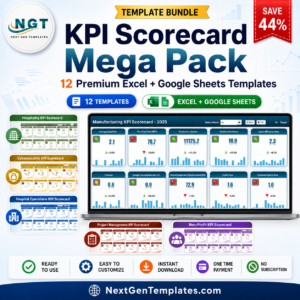
- KPI Scorecard Mega Pack: 12 KPI scorecard templates in one bundle
Browse all Excel KPI dashboards or the Excel calendars.