



Executive search and staffing firms operate under constant pressure—close roles faster, keep clients satisfied, reduce cancellations, and maximize search fee value. Yet, when recruitment data lives in scattered spreadsheets and manual reports, leaders lose visibility and teams react too late.
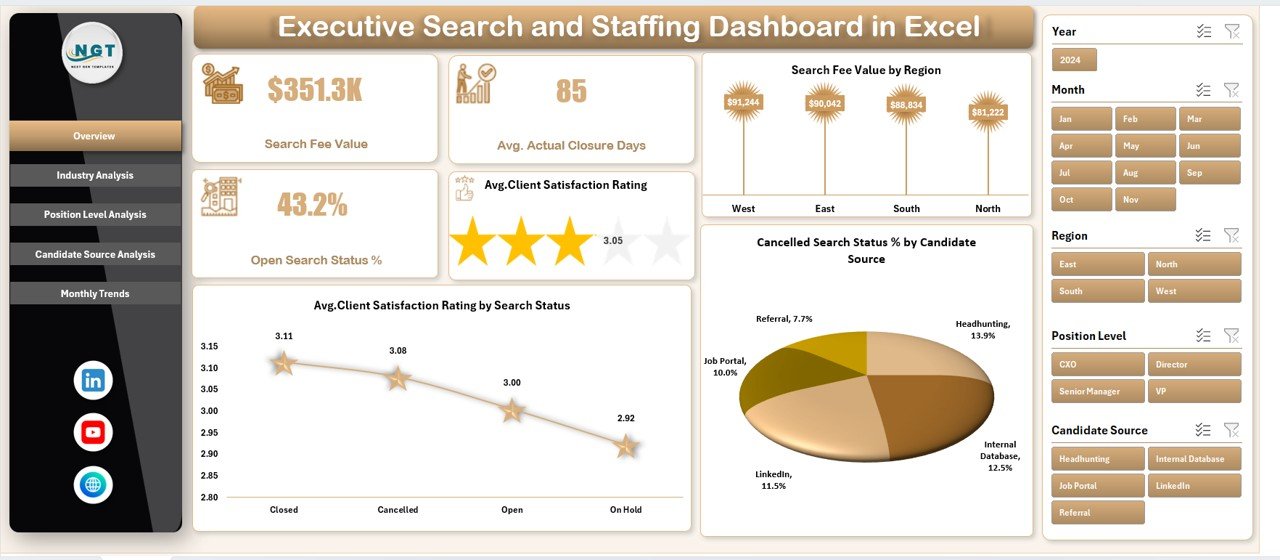
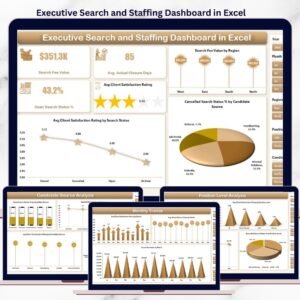
The Executive Search and Staffing Dashboard in Excel is a ready-to-use, professionally designed Excel solution that converts raw recruitment data into clear KPIs, interactive charts, and actionable insights—all in one centralized dashboard.
Instead of guessing where delays or risks exist, this dashboard gives recruitment leaders real-time clarity across industries, regions, position levels, candidate sources, and time periods. Built entirely in Excel, it is easy to use, flexible, and cost-effective—without complex BI tools.
🚀 Key Features of Executive Search and Staffing Dashboard in Excel
🧭 Smart Page Navigator
Quickly move between Overview, Industry, Position Level, Candidate Source, and Month analysis pages with one click.
🎯 Interactive Slicers
Filter insights by region, industry, position level, candidate source, and month instantly.
📊 Leadership-Focused KPI Cards
View key recruitment KPIs at a glance without digging into raw data.
📈 Multi-Dimensional Recruitment Analysis
Analyze performance across industries, roles, sourcing channels, and time periods.
⚙️ 100% Excel-Based Solution
No Power BI, no add-ins, no subscriptions—just Excel.
🎨 Clean & Professional Design
Presentation-ready layout for leadership reviews and client discussions.
📦 What’s Inside the Executive Search and Staffing Dashboard in Excel
📁 Data Sheet
A structured table where you record recruitment data such as industry, region, position level, candidate source, search status, SLA days, closure days, satisfaction rating, and search fee value.
📁 Support Sheets
Handle backend logic, mappings, and helper calculations to keep visuals clean and fast.
📁 Overview Page
High-level recruitment snapshot with KPI cards and summary charts for leadership reviews.
📁 Industry Analysis Page
Track satisfaction, closure speed, open pipeline pressure, and revenue by industry.
📁 Position Level Analysis Page
Evaluate performance across senior, mid-level, and leadership roles.
📁 Candidate Source Analysis Page
Identify which sourcing channels deliver faster closures, higher satisfaction, and better revenue.
📁 Month Analysis Page
Reveal seasonality, demand cycles, and recruitment trends over time.
📁 Page Navigator Panel
Ensures seamless navigation during meetings and reviews.
🛠️ How to Use the Executive Search and Staffing Dashboard in Excel
1️⃣ Enter or update recruitment data in the Data Sheet
2️⃣ Refresh pivot tables with one click
3️⃣ Use slicers to filter by region, industry, role level, or source
4️⃣ Navigate analysis pages using the Page Navigator
5️⃣ Review KPIs, risks, and trends instantly
6️⃣ Customize charts, KPIs, or formats as needed
No advanced Excel skills required—the dashboard is built for everyday recruitment teams.
👥 Who Can Benefit from This Executive Search and Staffing Dashboard
👔 Executive Search Firms – Track closures, satisfaction, and revenue
🏢 Staffing & Recruitment Agencies – Reduce cancellations and delays
📊 Recruitment Leaders & Managers – Improve SLA and delivery performance
🎯 Talent Acquisition Teams – Optimize sourcing strategies
📈 Business Development & Strategy Teams – Identify high-margin industries
If your firm uses Excel to manage recruitment data, this dashboard fits perfectly.
📘 Click here to read the Detailed blog post
🎥 Visit our YouTube channel to learn step-by-step video tutorials
👉 Youtube.com/@PKAnExcelExpert
Watch the step-by-step video tutorial:
Compatibility and Requirements
- Works in Microsoft Excel desktop (Excel 2016 or later, or Microsoft 365).
- The dashboard uses pivot tables and slicers to filter by region, industry, position level, candidate source and month. Microsoft explains slicers in Use slicers to filter data.
Frequently Asked Questions
What data do I enter in the Data Sheet?
You record industry, region, position level, candidate source, search status, SLA days, closure days, satisfaction rating and search fee value for each search.
Which pages does the dashboard have?
Overview, Industry Analysis, Position Level Analysis, Candidate Source Analysis and Month Analysis. A Page Navigator panel moves you between them, and the Data Sheet and Support Sheets sit behind the pages.
Can I filter the results?
Yes. Slicers filter by region, industry, position level, candidate source and month.
Do I need Power BI or add-ins?
No. The dashboard is built entirely in Excel, with no add-ins and no subscriptions. Refresh the pivot tables after you update the data.
Is there a Power BI or Google Sheets version?
Yes. See the Executive Search and Staffing Dashboard in Power BI and the Executive Search & Staffing Dashboard in Google Sheets.
Related Recruitment Dashboards
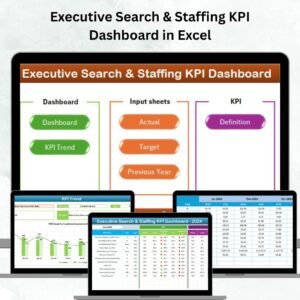
- Executive Search & Staffing KPI Dashboard in Excel: a KPI-focused view for executive search firms
- Executive Search and Staffing Dashboard in Power BI: the same dashboard for Power BI
- Executive Search & Staffing Dashboard in Google Sheets: a Google Sheets edition
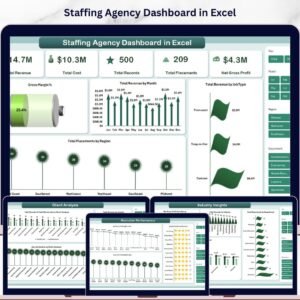
- Staffing Agency Dashboard in Excel: a dashboard for staffing agencies
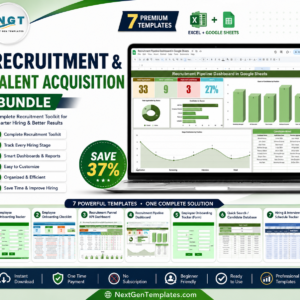
- Recruitment & Talent Acquisition Bundle: 7 recruitment templates in one download
Browse all Excel dashboards.


























Reviews
There are no reviews yet.