



Managing a secondary school goes far beyond classroom teaching. Schools must continuously monitor student strength, attendance, academic performance, scholarships, monthly fees, and participation activities. However, when this data remains scattered across multiple Excel files, registers, or manual reports, tracking performance becomes slow, confusing, and inefficient.
That is exactly why the Secondary Schools Dashboard in Excel becomes a powerful and practical solution.
This ready-to-use Excel dashboard converts raw school data into clear KPIs, interactive charts, and visual insights. Instead of preparing multiple reports, school administrators, principals, and academic coordinators can monitor academic, financial, and operational performance from one centralized dashboard.
Built entirely in Microsoft Excel, this dashboard uses pivot tables, pivot charts, slicers, and structured layouts. As a result, schools gain professional-level analytics without expensive software or technical complexity.
🔑 Key Features of Secondary Schools Dashboard in Excel
📊 5 structured analytical pages
🎯 Interactive slicers for instant filtering
👨🎓 Student strength & distribution analysis
📅 Attendance percentage tracking
📝 Exam performance insights
🎓 Scholarship analysis by multiple dimensions
💰 Monthly fees monitoring
📈 Participation activity impact analysis
🧭 Page navigator for smooth navigation
🔄 Auto-refresh with data updates
This dashboard helps schools move from manual reporting to data-driven academic management.
📂 What’s Inside the Secondary Schools Dashboard in Excel
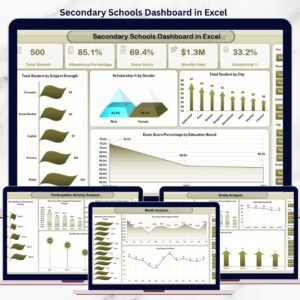
📊 Overview Page – School Performance Snapshot

The Overview Page acts as the main control panel of the dashboard.
Key Insights Displayed:
Total Students by Subject Strength
Scholarship Percentage by Gender
Total Students by City
Exam Score Percentage by Education Board
This page gives leadership an instant overview of student distribution and academic performance.
🏫 Education Board Analysis Page
The Education Board Analysis Page compares performance across different education boards.
Charts Included:
Scholarship by Education Board
Total Students by Education Board
Attendance Percentage by Education Board
Monthly Fees by Education Board
This analysis helps schools compare academic outcomes and financial performance across boards.
📘 Grade Analysis Page
The Grade Analysis Page tracks performance class-wise.
Key Metrics:
Attendance Percentage by Grade
Exam Score Percentage by Grade
Total Students by Grade
Scholarship by Grade
This page helps identify grades that require academic or attendance intervention.
🎯 Participation Activity Analysis Page
The Participation Activity Analysis Page focuses on extracurricular engagement.
Charts Available:
Monthly Fees by Participation Activity
Exam Score Percentage by Participation Activity
Attendance Percentage by Participation Activity
Total Students by Participation Activity
Schools can clearly see how participation activities influence academic performance and attendance.
📆 Month Analysis Page
The Month Analysis Page highlights trends over time.
Monthly Insights Include:
Attendance Percentage by Month
Exam Score Percentage by Month
Total Students by Month
This analysis supports early issue detection and academic year planning.
🛠️ How to Use the Secondary Schools Dashboard
✅ Enter or update data in the Data Sheet
✅ Refresh pivot tables (one click)
✅ Use slicers to filter by board, grade, city, or month
✅ Review KPIs and charts instantly
✅ Make informed academic and administrative decisions
No advanced Excel knowledge is required.
👥 Who Can Benefit from This Dashboard?
🏫 Secondary School Principals
📊 Academic Coordinators
🧾 School Administrators
💰 Finance & Accounts Teams
🎓 Education Trusts & Management
📈 School Data Analysts
Suitable for public and private secondary schools of any size.
### 👉 🔗 Click here to read the Detailed blog post
▶️ Visit our YouTube channel to learn step-by-step video tutorials
https://youtube.com/@PKAnExcelExpert
Watch the step-by-step video tutorial:
Compatibility and Requirements
- Works in Microsoft Excel desktop (Excel 2016 or later, or Microsoft 365).
- The dashboard uses pivot tables, pivot charts and slicers. Microsoft explains how to filter with slicers in Use slicers to filter data.
Frequently Asked Questions
How many pages does the dashboard have?
Five pages: Overview, Education Board Analysis, Grade Analysis, Participation Activity Analysis and Month Analysis.
What can I filter with the slicers?
You can filter the charts by education board, grade, city or month, and the pages update straight away.
How do I update it with new school data?
Enter or update your records in the Data Sheet, then refresh the pivot tables with one click. The KPIs and charts follow the new data.
What does it track?
It tracks total students, attendance percentage, exam score percentage, scholarships and monthly fees. You can view them by education board, grade, participation activity and month.
Is there a Power BI or Google Sheets version?
Yes. See the Secondary Schools Dashboard in Power BI and the Secondary Schools Dashboard in Google Sheets.
Related School Templates
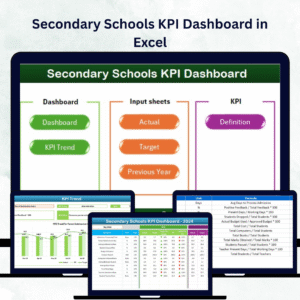
- Secondary Schools KPI Dashboard in Excel: a KPI view for the same type of school
- Secondary Schools Dashboard in Power BI: the Power BI edition
- Secondary Schools Dashboard in Google Sheets: the Google Sheets edition
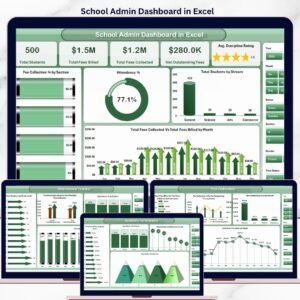
- School Admin Dashboard in Excel: an administration view for schools
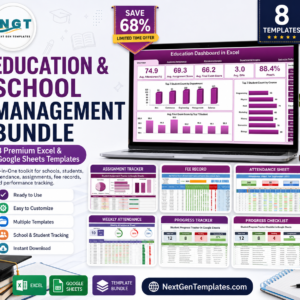
- Education & School Management Bundle: 8 education templates in one download
Browse all Excel dashboards and Excel education templates.














Reviews
There are no reviews yet.