The oil and gas industry operates in one of the most capital-intensive and data-heavy environments in the world. Every day, organizations must monitor operating costs, production capacity, revenue, profitability, utilization, and regional performance—while also responding to volatile energy prices and strict regulations. Oil and Gas Dashboard in Excel However, many energy companies still rely on static reports and disconnected Excel sheets. As a result, inefficiencies, cost overruns, and performance risks often go unnoticed.
Oil and Gas Dashboard in Excel That is exactly why the Oil and Gas Dashboard in Excel becomes a powerful and practical solution 🚀.
Oil and Gas Dashboard in Excel This ready-to-use Excel dashboard transforms raw operational and financial data into clear, visual, and actionable insights. Instead of managing multiple reports for cost, revenue, production, and utilization, leadership teams can monitor everything from a single interactive dashboard. Moreover, this dashboard enables country-wise, region-wise, energy-type, and time-based analysis—helping organizations make faster and smarter decisions.
Built entirely in Microsoft Excel, this dashboard remains flexible, cost-effective, and easy to customize, making it ideal for upstream, midstream, and downstream oil and gas operations.
⭐ Key Features of Oil and Gas Dashboard in Excel
🛢️ Centralized Oil & Gas Performance Monitoring
Track financial, operational, and production KPIs in one dashboard.
💰 Cost, Revenue & Profit Visibility
Monitor operating cost, revenue, total profit, and profit margin clearly.
⚙️ Production & Capacity Utilization Analysis
Compare actual production with capacity to identify inefficiencies.
🌍 Country & Region-Wise Insights
Analyze performance across countries and regions for strategic decisions.
📈 Monthly Trend Analysis
Track cost, revenue, and profit trends over time.
🎛️ Interactive Excel Slicers & Navigation
Filter insights instantly and navigate dashboards with one click.
📦 What’s Inside the Oil and Gas Dashboard in Excel
This professionally designed Excel file includes 5 interactive dashboard pages, supported by structured data and calculation sheets.
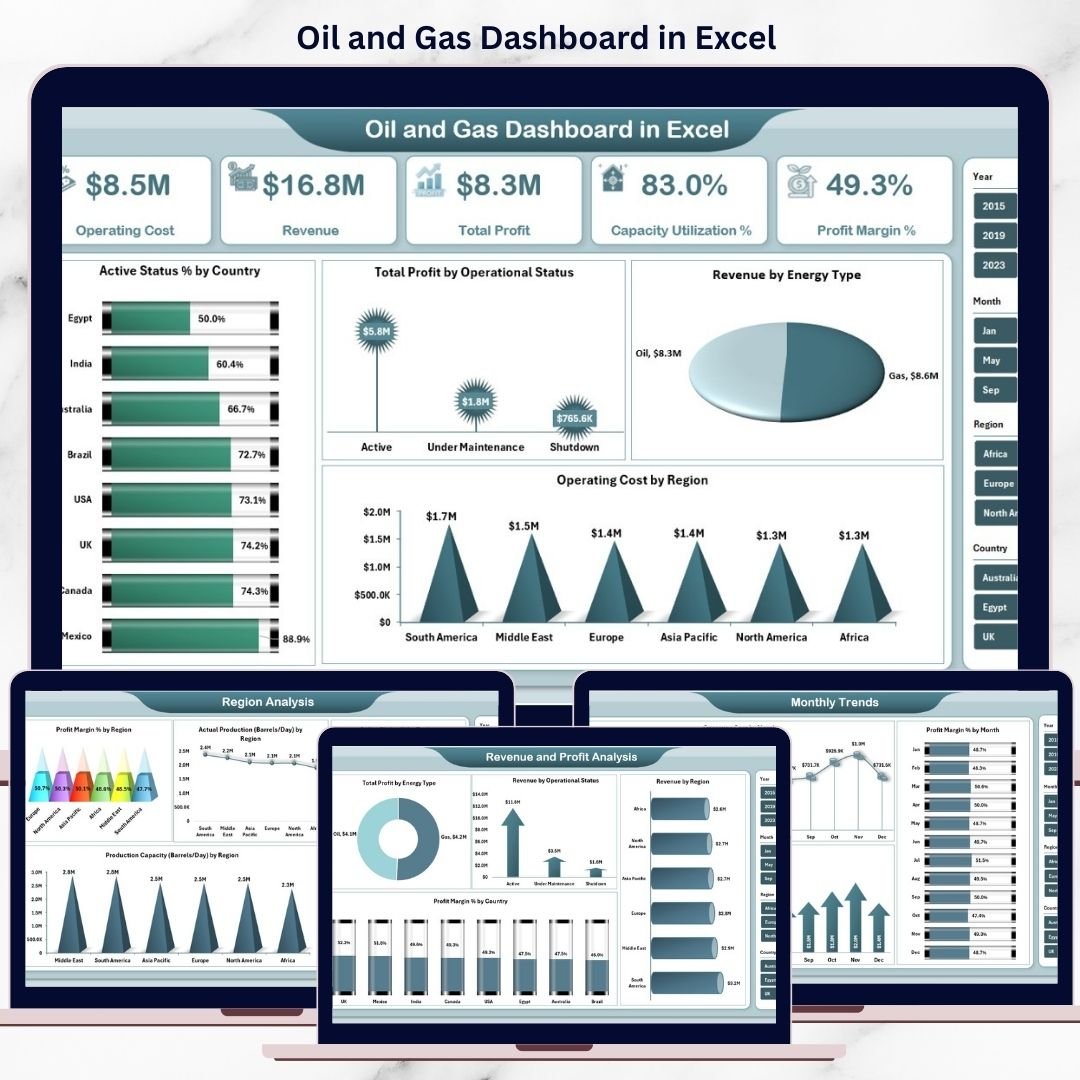
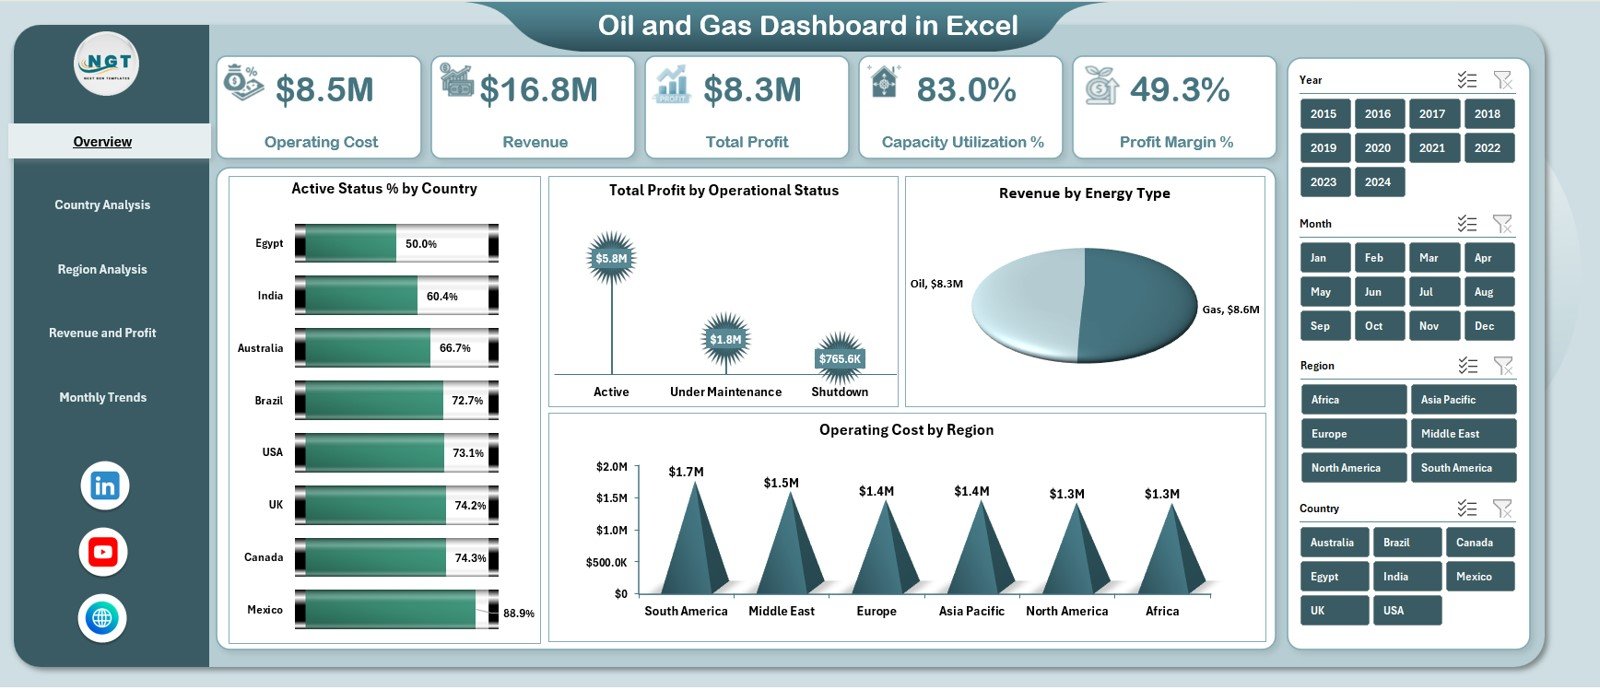
📊 Overview Page
Provides a high-level performance snapshot with KPI cards:
-
Operating Cost
-
Revenue
-
Total Profit
-
Capacity Utilization %
-
Profit Margin %
Includes charts:
-
Active Status % by Country
-
Total Profit by Operational Status
-
Revenue by Energy Type
-
Operating Cost by Region
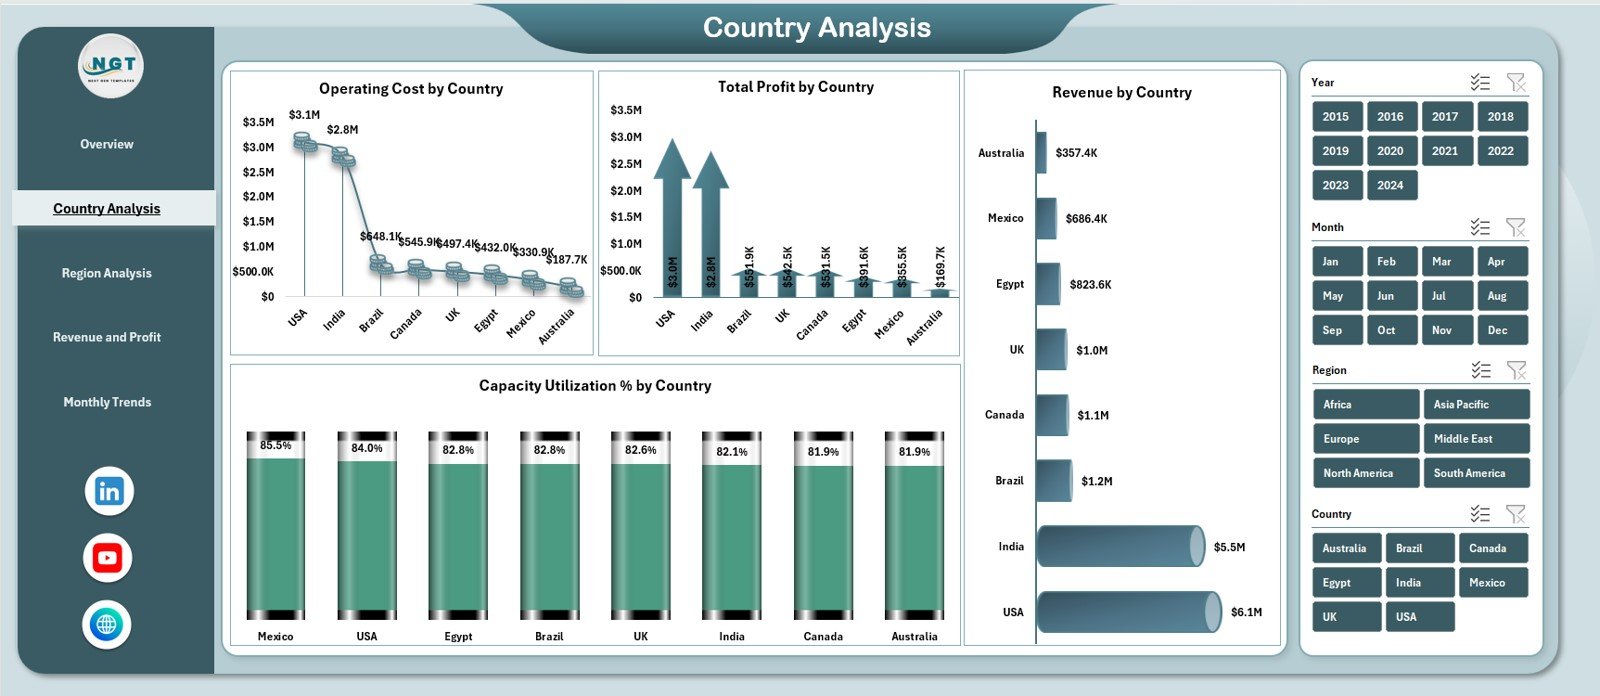
🌍 Country Analysis Page
Delivers country-wise insights through:
-
Operating Cost by Country
-
Total Profit by Country
-
Capacity Utilization % by Country
-
Revenue by Country
Helps identify high-cost and high-profit markets.
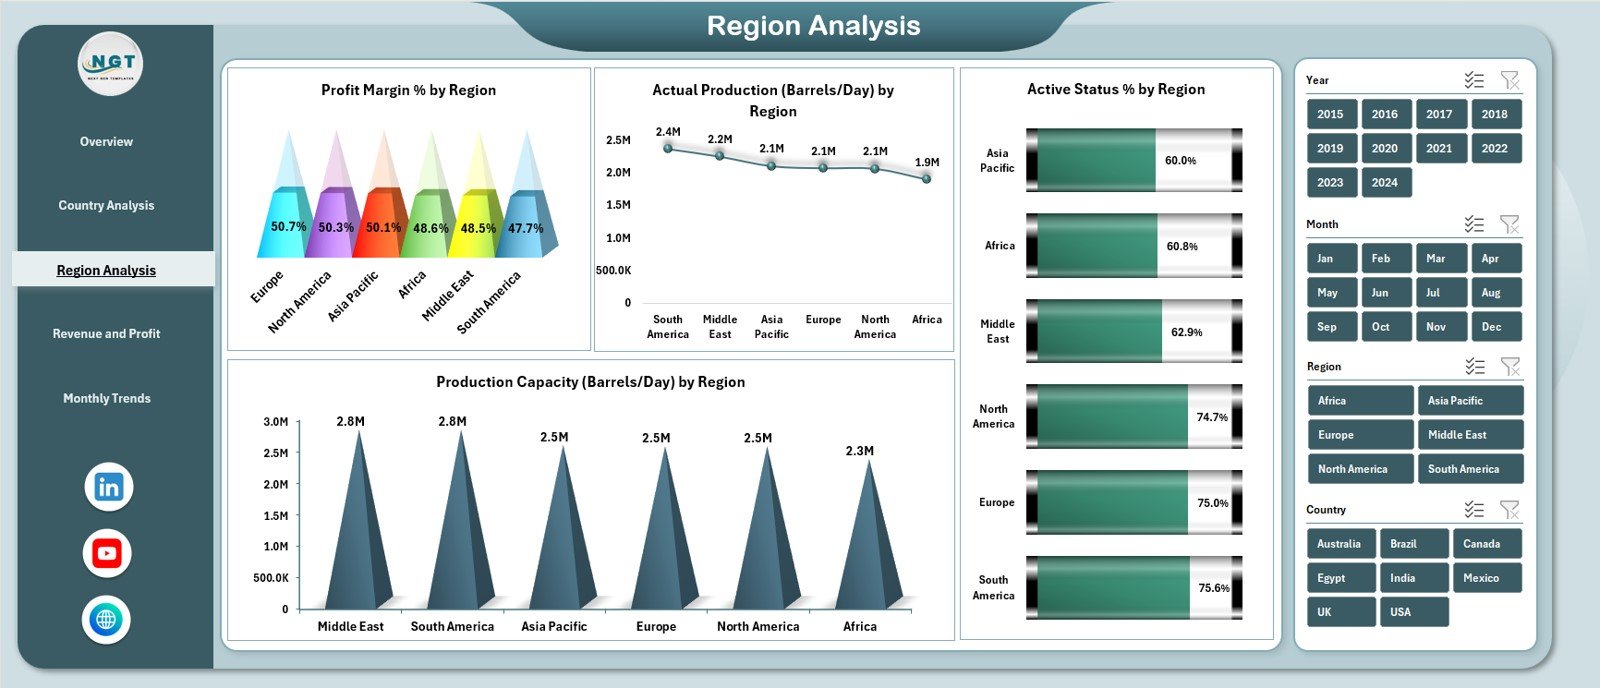
🗺️ Region Analysis Page
Focuses on regional performance with:
-
Profit Margin % by region
-
Actual Production (Barrels/Day) by region
-
Production Capacity (Barrels/Day) by region
-
Active Status % by region
Supports operational planning and capacity optimization.
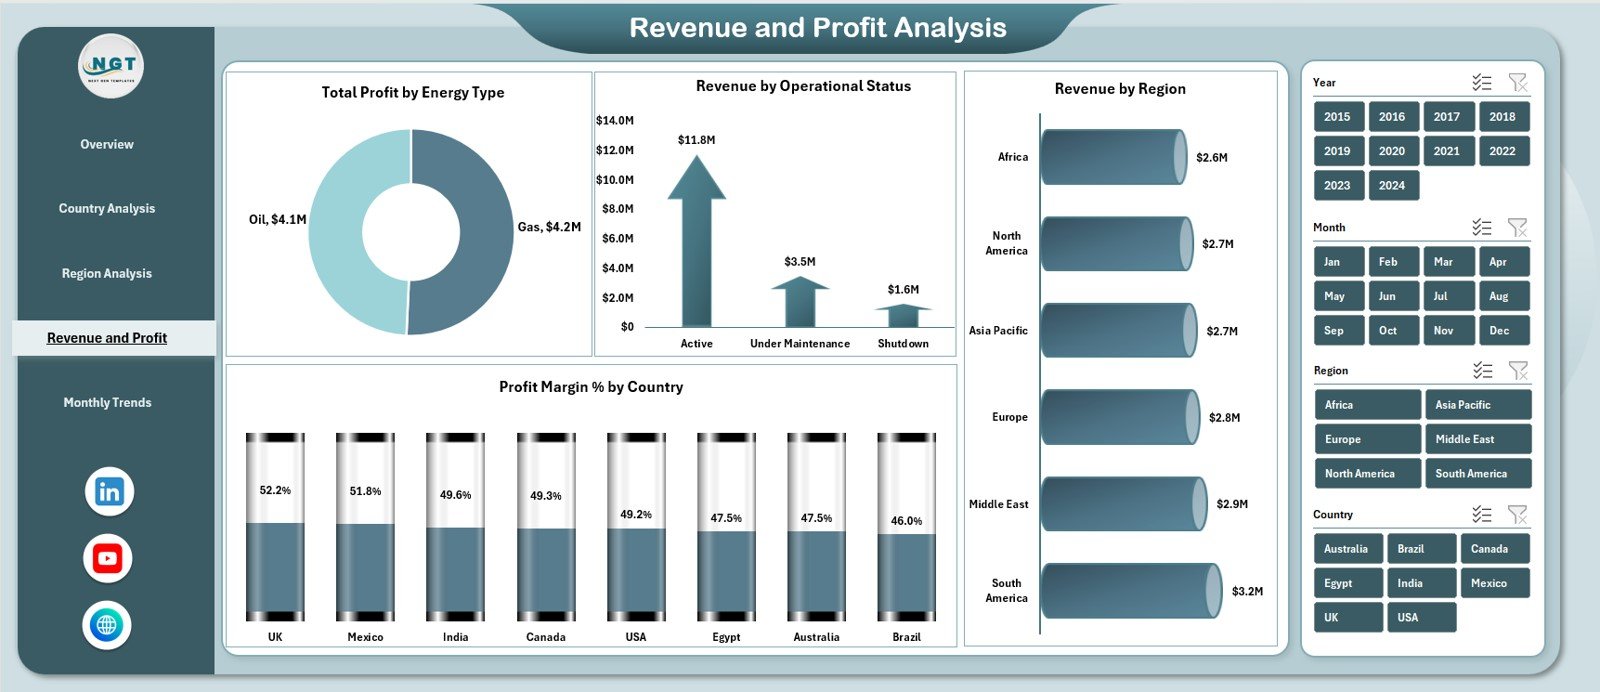
💰 Revenue & Profit Analysis Page
Analyzes financial drivers using:
-
Total Profit by Energy Type
-
Revenue by Operational Status
-
Profit Margin % by Country
-
Revenue by Region
Highlights the most profitable energy sources and regions.
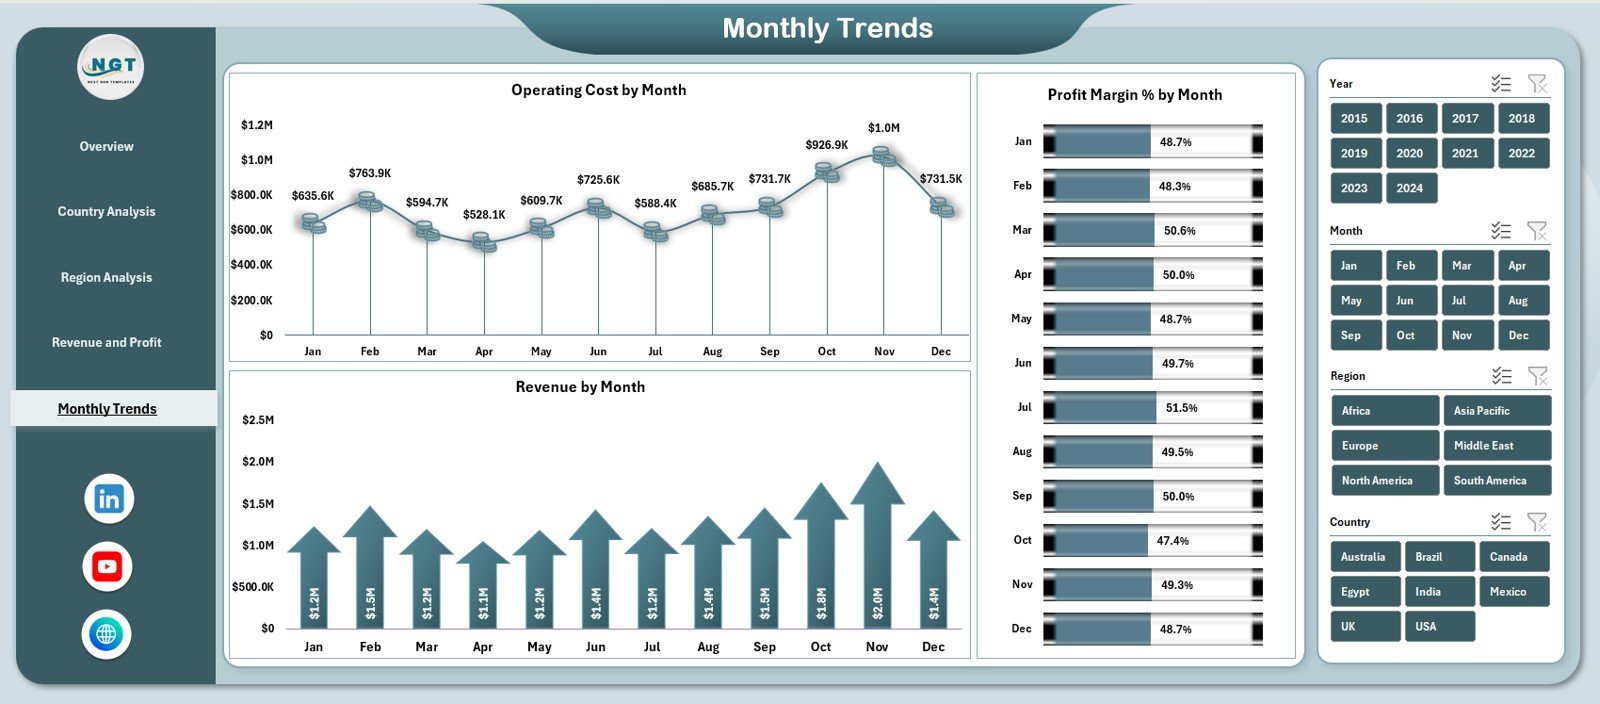
📆 Monthly Trends Page
Tracks performance over time with:
-
Operating Cost by Month
-
Revenue by Month
-
Profit Margin % by Month
Supports forecasting, budgeting, and long-term planning.
🧭 Page Navigator
A left-side Page Navigator enables one-click navigation across all dashboard pages, improving usability and presentation.
🛠️ How to Use the Oil and Gas Dashboard in Excel
Using this dashboard is simple:
1️⃣ Enter raw operational and financial data in the Data Sheet
2️⃣ Let the Support Sheet handle calculations automatically
3️⃣ Use slicers to filter by country, region, energy type, or month
4️⃣ Review KPI cards and charts
5️⃣ Analyze trends to support operational and strategic decisions
Because calculations and visuals are automated, reporting becomes faster and error-free.
👥 Who Can Benefit from This Oil and Gas Dashboard
This dashboard is ideal for:
🛢️ Oil & Gas Operations Managers
⚙️ Production Managers
💰 Finance & Cost Controllers
🌍 Regional & Country Heads
📊 Strategy & Planning Teams
👔 Senior Leadership
Any energy organization focused on efficiency and profitability will benefit from this dashboard.


Reviews
There are no reviews yet.