

Vertical farming is redefining modern agriculture by enabling high-yield food production in limited spaces. As urban populations grow and sustainability becomes critical, vertical farming operations must carefully track costs, yield, energy usage, revenue, and profitability. Vertical Farming Dashboard in Excel However, when this data remains scattered across spreadsheets, decision-making becomes slow and unreliable.
Vertical Farming Dashboard in Excel That is exactly why the Vertical Farming Dashboard in Excel becomes an essential management and analytics solution 🚀.
This ready-to-use Excel dashboard converts complex vertical farming data into clear, visual, and actionable insights. Instead of manually analyzing raw data, farm managers, aggrotech startups, and sustainability teams gain instant visibility across crops, countries, growth systems, and monthly trends—all from one structured Excel file.
Whether you operate a commercial vertical farm, urban agriculture startup, or research facility, this dashboard helps you optimize performance, control costs, and improve profitability with confidence.
🌟 Key Features of Vertical Farming Dashboard in Excel
📊 Centralized Farm Performance Tracking
All cost, revenue, yield, and profit metrics in one dashboard.
🌾 Crop-Wise Analysis
Compare yield, cost, and profitability across crop types.
🌍 Country-Level Insights
Understand geographic and climate impact on performance.
⚙️ Growth System Evaluation
Analyze hydroponics, aeroponics, and other systems.
📅 Monthly Trend Monitoring
Track cost, revenue, and profit changes over time.
🎛 Interactive Slicers
Filter data dynamically without manual calculations.
🧠 Easy Excel-Based Design
No advanced software or technical skills required.
📦 What’s Inside the Vertical Farming Dashboard in Excel
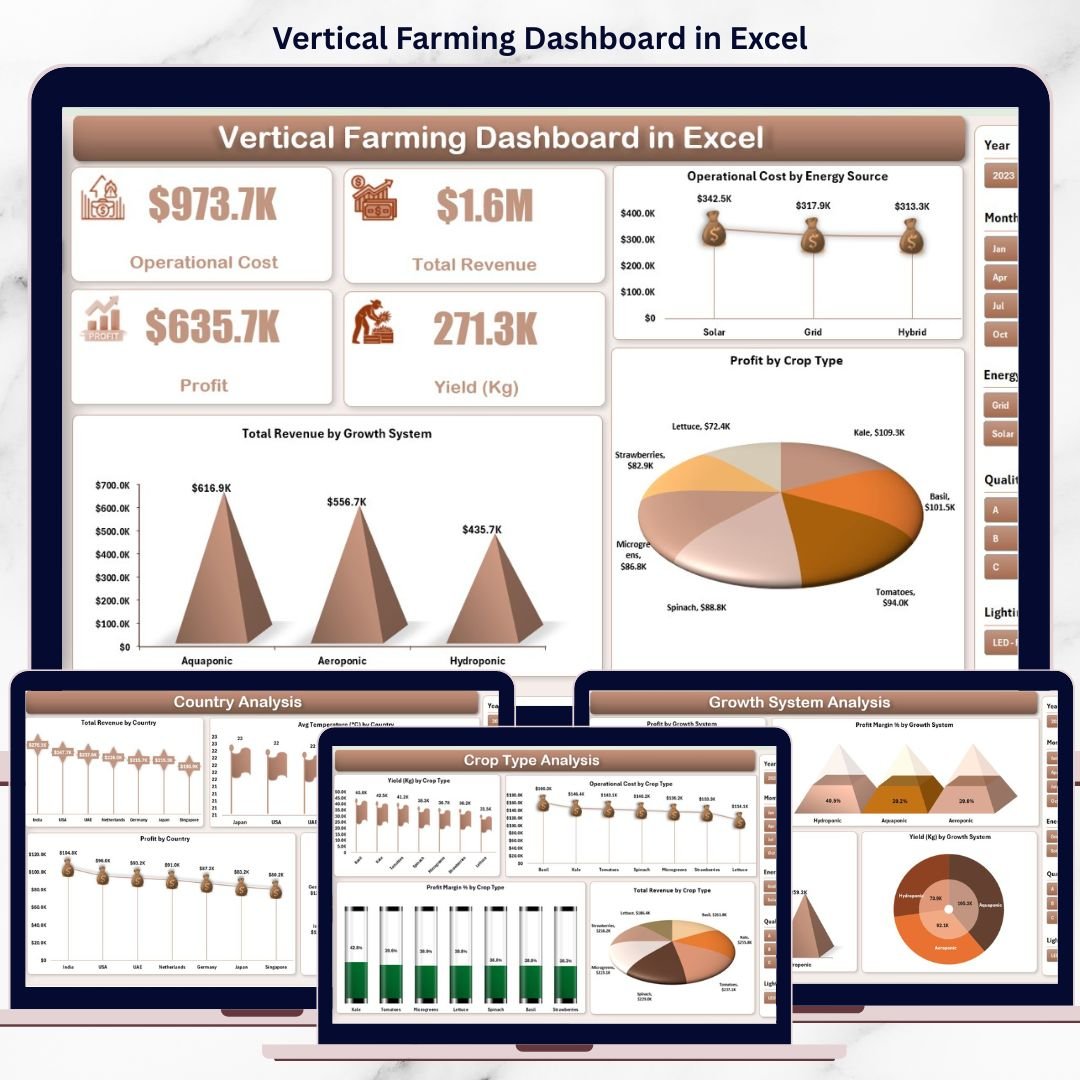
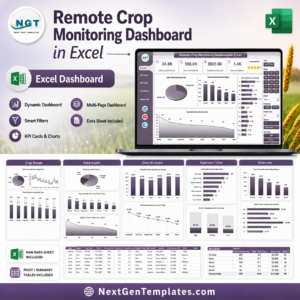
📊 Overview Page – Executive Snapshot
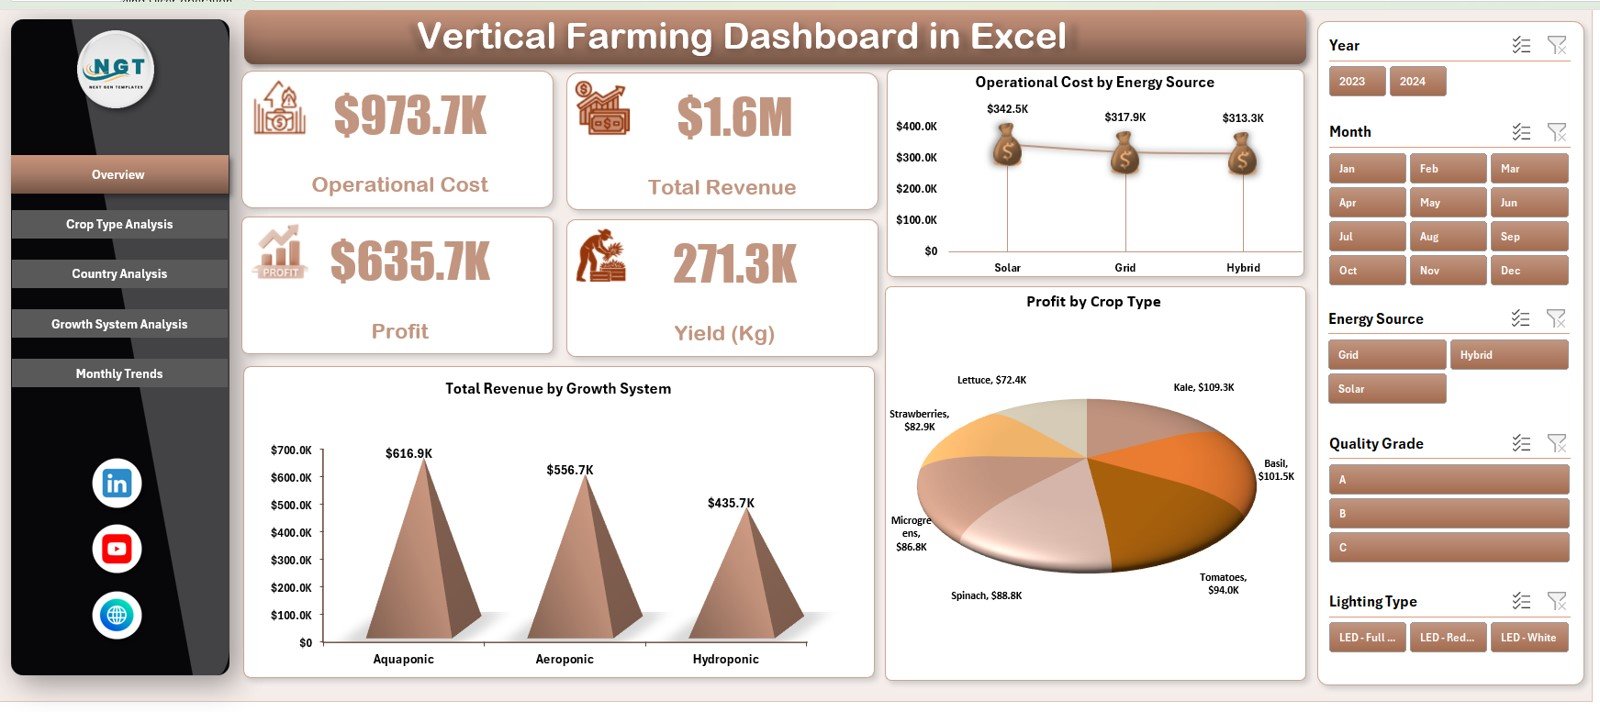
The Overview Page acts as the central summary of the entire dashboard.
🔢 KPI Cards Displayed
Operational Cost
Total Revenue
Profit
Yield (Kg)
These KPI cards provide an instant snapshot of overall farm performance.
📈 Charts on the Overview Page
Total Revenue by Growth System
Operational Cost by Energy Source
Profit by Crop Type
These visuals help identify key cost drivers and revenue contributors immediately.
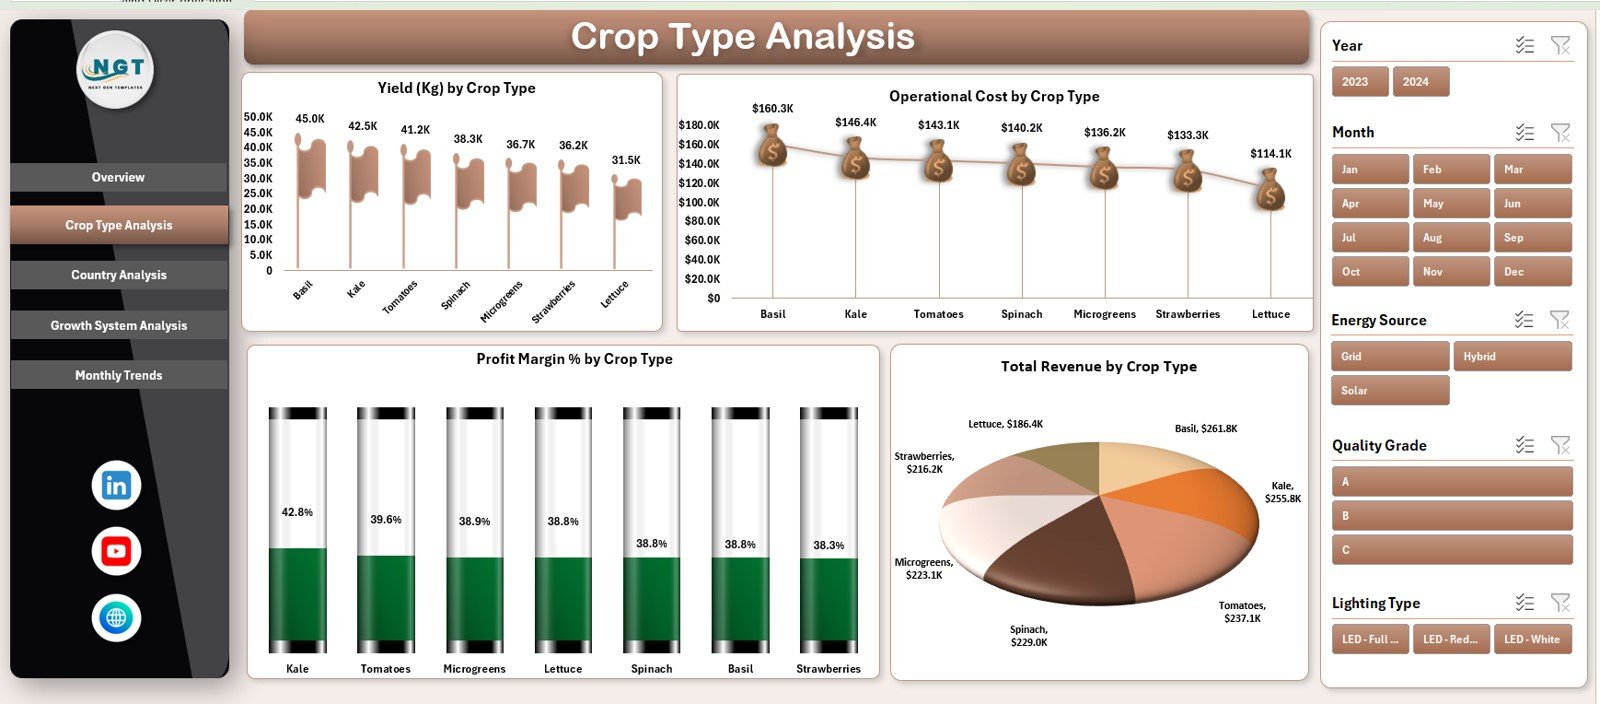
🌾 Crop Type Analysis Page – Crop-Wise Performance
The Crop Type Analysis Page focuses on comparing different crops.
📊 Charts Included
Yield (Kg) by Crop Type
Operational Cost by Crop Type
Profit Margin (%) by Crop Type
Total Revenue by Crop Type
This page helps teams identify high-yield crops, low-margin crops, and optimization opportunities.
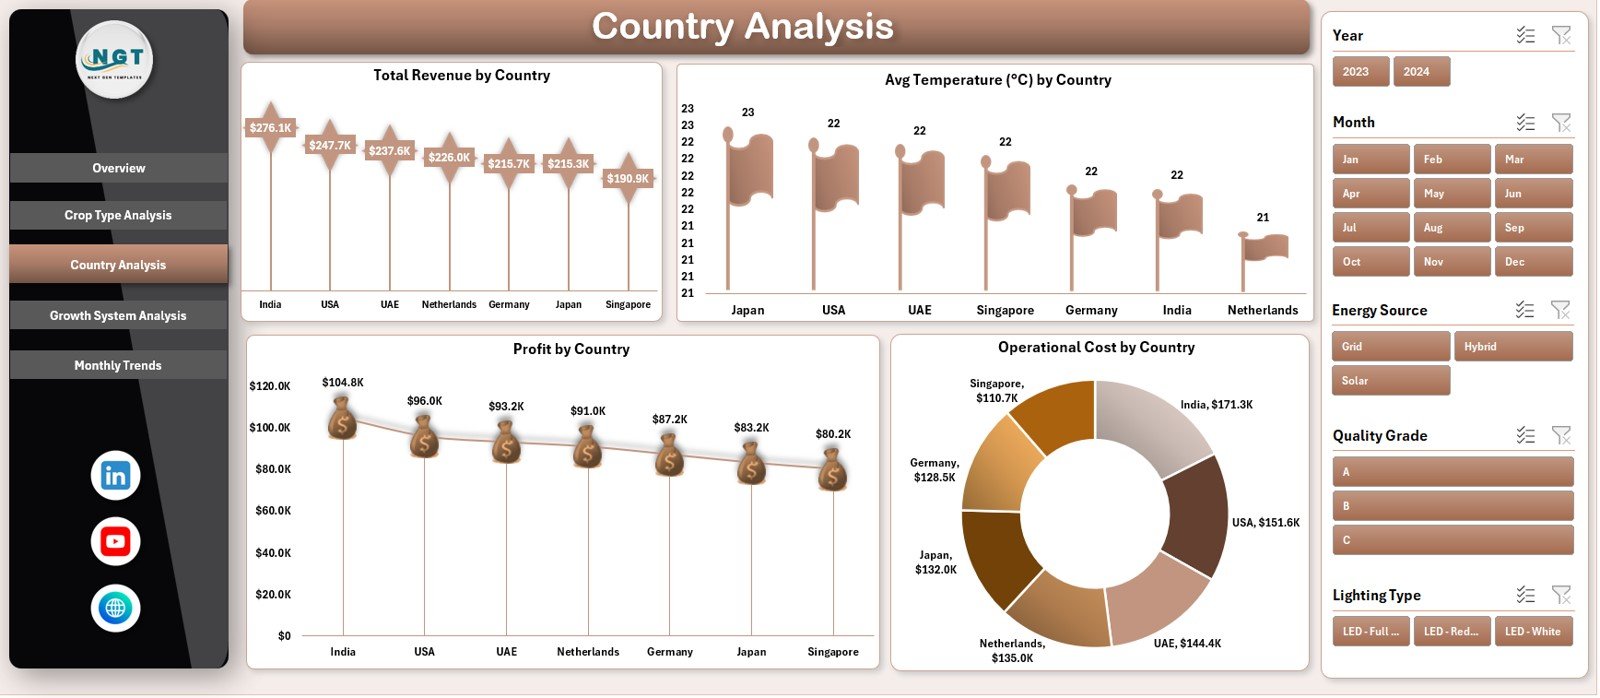
🌍 Country Analysis Page – Geographic Performance
The Country Analysis Page evaluates vertical farming performance across locations.
📊 Charts Included
Total Revenue by Country
Average Temperature (°C) by Country
Profit by Country
Operational Cost by Country
This analysis helps organizations compare regional profitability, climate impact, and expansion potential.
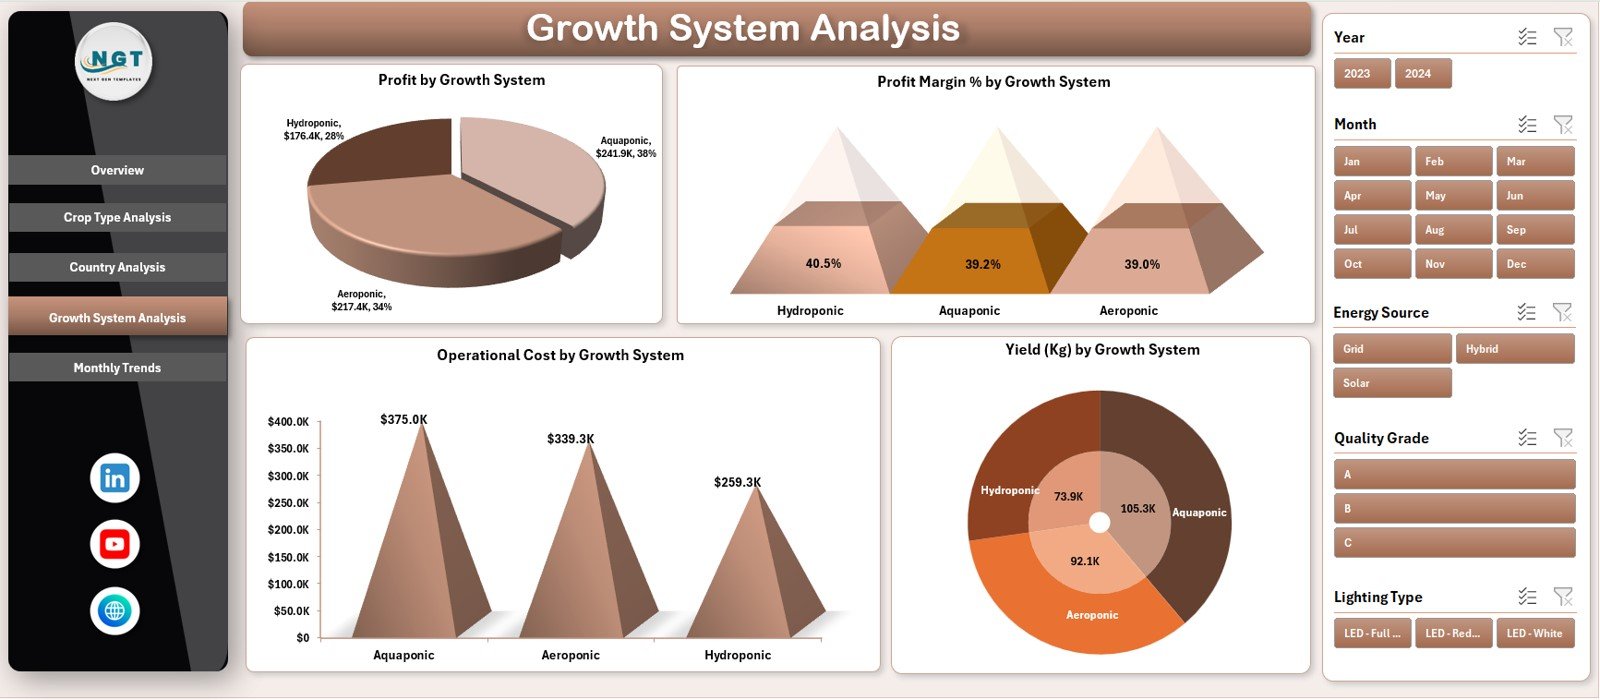
⚙️ Growth System Analysis Page – System Efficiency
The Growth System Analysis Page compares performance across farming systems.
📊 Charts Included
Profit by Growth System
Profit Margin (%) by Growth System
Operational Cost by Growth System
Yield (Kg) by Growth System
This page supports energy efficiency, system selection, and operational optimization.
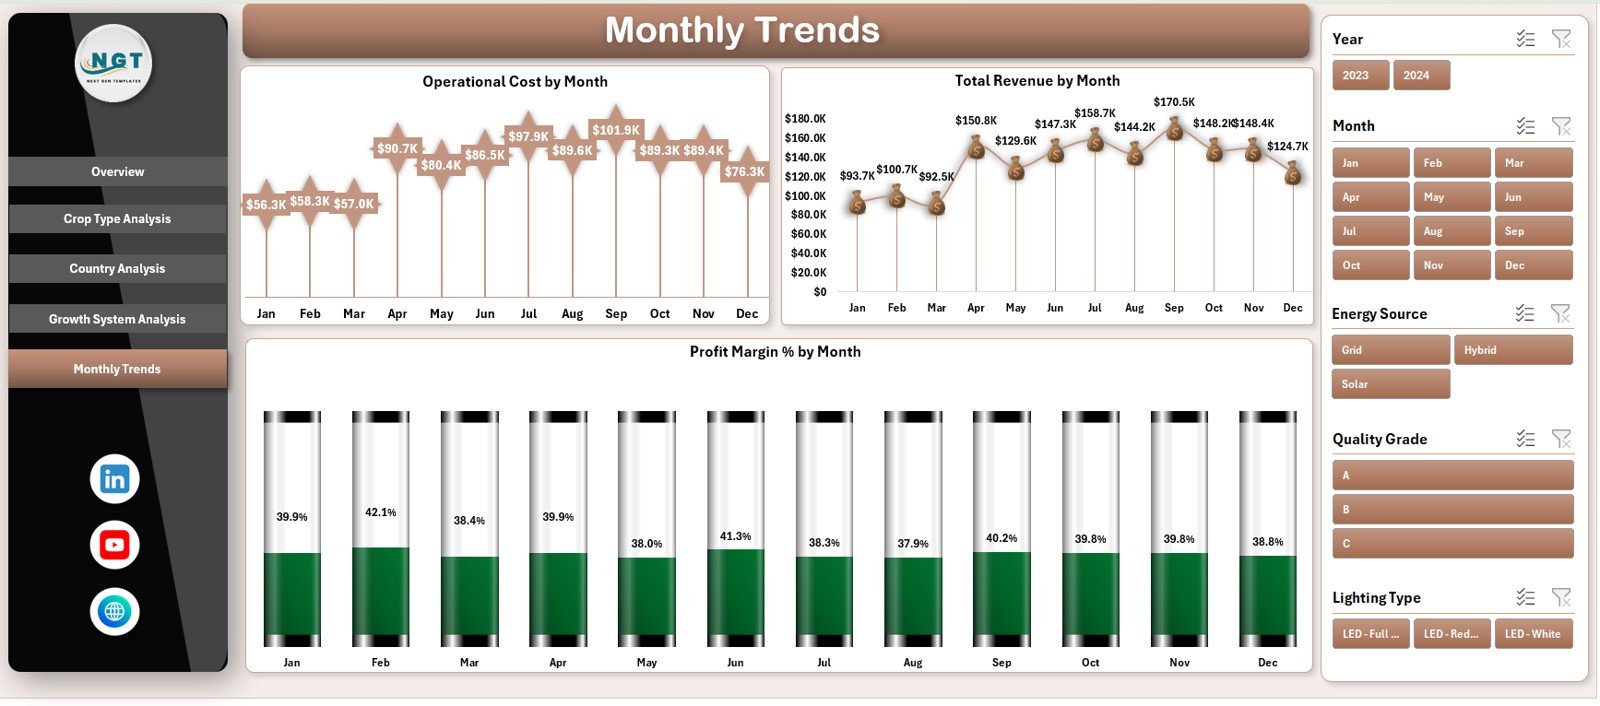
📅 Monthly Trends Page – Time-Based Insights
The Monthly Trends Page tracks performance over time.
📈 Trend Charts Included
Operational Cost by Month
Total Revenue by Month
Profit Margin (%) by Month
These trends help teams forecast performance, manage seasonality, and improve planning accuracy.
👥 Who Can Benefit from This Dashboard
🌱 Vertical farming operators
🏙 Urban agriculture businesses
🚀 Agri tech startups
📊 Data analysts & planners
🌍 Sustainability teams
🏢 Investors & decision-makers
🔍 Click here to read the Detailed blog post
📺 Visit our YouTube channel to learn step-by-step video tutorials
👉 Youtube.com/@PKAnExcelExpert




























Reviews
There are no reviews yet.