

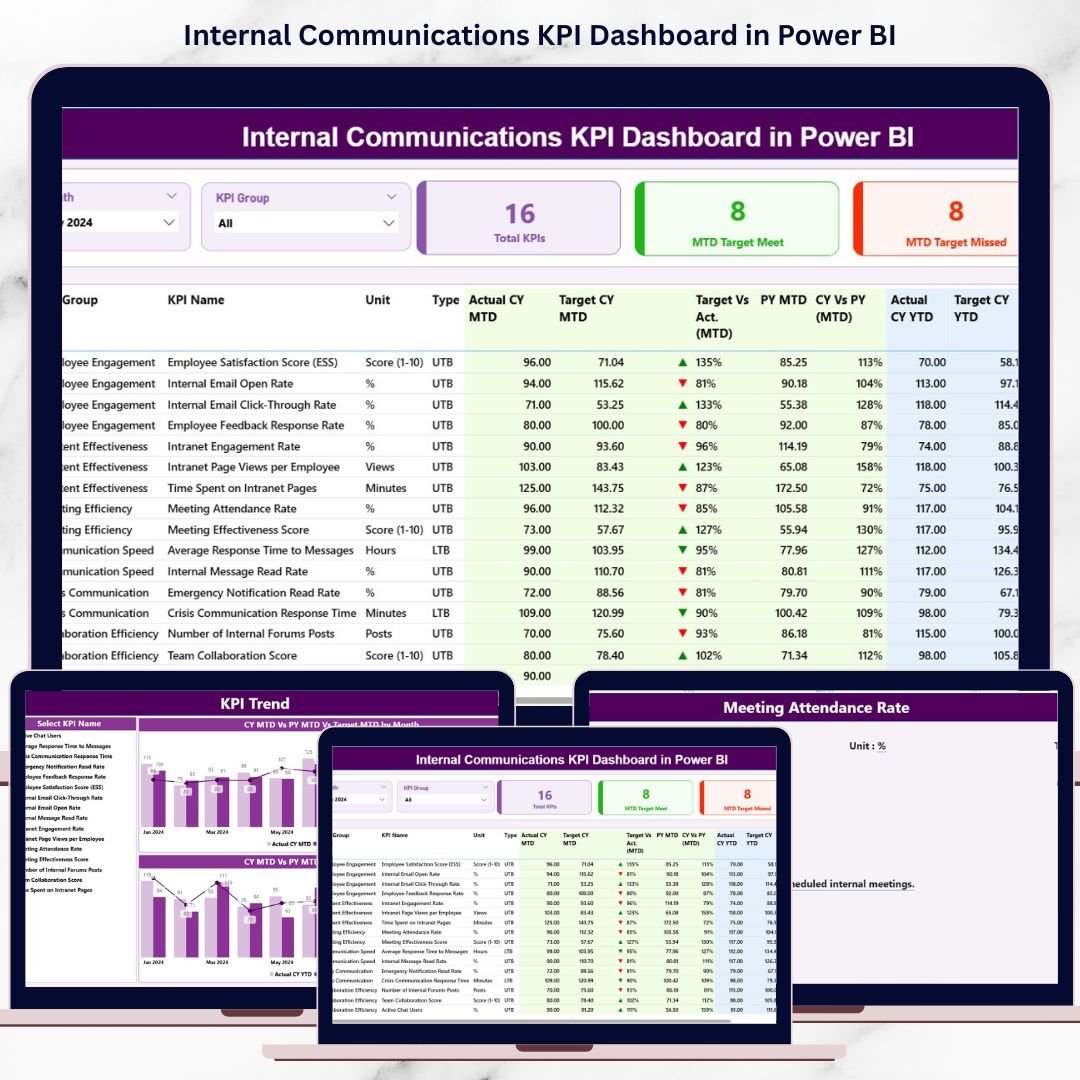

Internal Communications KPI Dashboard plays a vital role in how employees stay informed, engaged, and aligned with organizational goals. Clear communication improves collaboration, supports change initiatives, and strengthens company culture. However, many organizations still rely on assumptions, scattered Excel files, and manual reports to measure communication effectiveness. As a result, leaders struggle to understand what works, what fails, and where improvements are needed.
That is exactly why the Internal Communications KPI Dashboard in Power BI becomes an essential solution for modern organizations 🚀.
This ready-to-use Power BI dashboard transforms raw internal communication data into clear, interactive, and actionable insights. Instead of reviewing multiple spreadsheets for message reach, engagement, or compliance, teams get a centralized dashboard that tracks performance across defined KPIs. Because Power BI updates visuals dynamically, decision-makers can instantly identify gaps, trends, and improvements.
Whether your organization focuses on employee engagement, leadership alignment, or change management, this dashboard helps communication teams move from intuition-based decisions to data-driven strategies.
🔑 Key Features of Internal Communications KPI Dashboard in Power BI
📊 Centralized KPI Monitoring – Track all internal communication KPIs in one Power BI dashboard
🎯 MTD & YTD Performance Tracking – Measure short-term execution and long-term communication impact
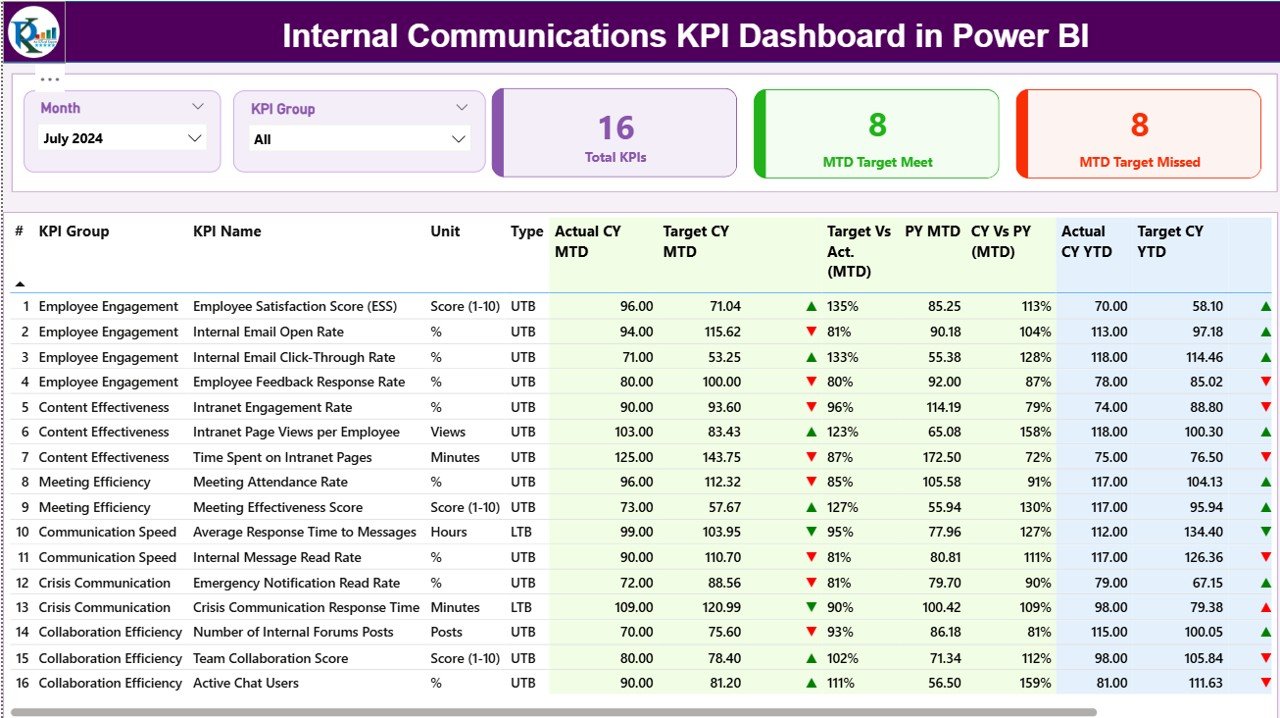
📅 Dynamic Month & KPI Group Slicers – Instantly filter results by period and communication category
🚦 Target Status Indicators – Visual green and red arrows highlight KPIs met or missed
📈 Detailed KPI Performance Table – Compare actuals, targets, and previous-year values
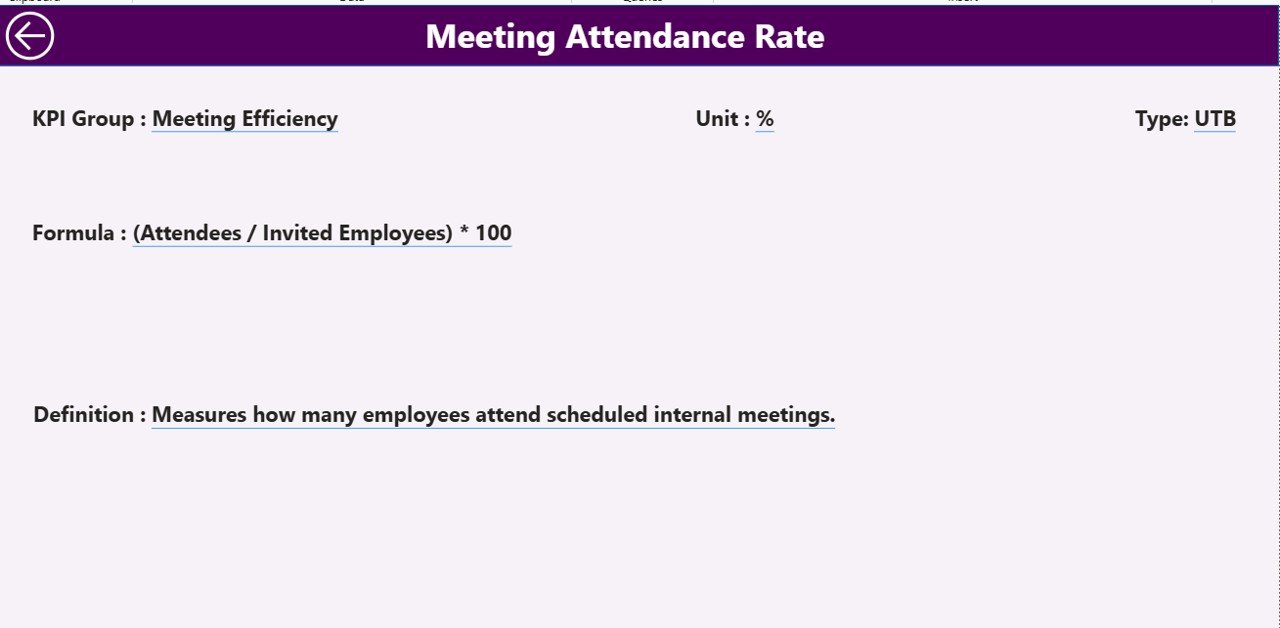
🔍 Drill-Through KPI Definitions – Understand KPI logic, formulas, and units instantly
⚡ Excel-Based Data Input – Easy data entry with powerful Power BI analytics
📂 What’s Inside the Internal Communications KPI Dashboard in Power BI
This digital product includes three structured analytical pages, each designed for a specific purpose:
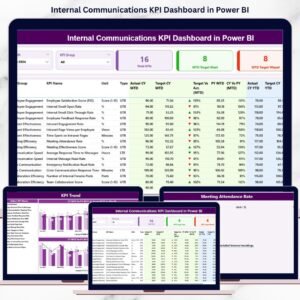
📌 Summary Page – Executive-level overview with KPI cards, slicers, and a detailed KPI performance table
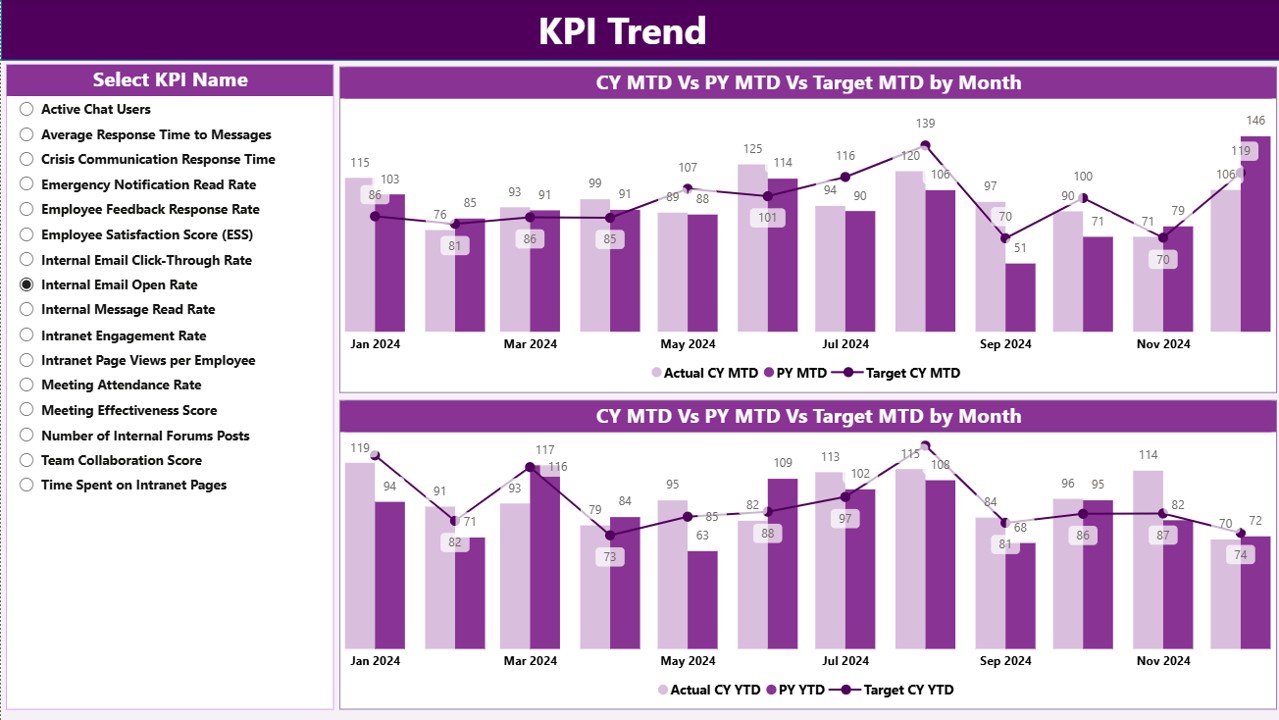
📌 KPI Trend Page – Combo charts showing MTD and YTD trends for selected KPIs
📌 KPI Definition Page – Drill-through reference page explaining KPI formulas, definitions, units, and UTB/LTB logic
Behind the dashboard, the solution connects to structured Excel input sheets that store:
Actual communication performance data
Target values
Standardized KPI definitions
This structure ensures accuracy, governance, and consistency across reporting.
🛠️ How to Use the Internal Communications KPI Dashboard in Power BI
Using this dashboard is simple and user-friendly:
1️⃣ Update actual communication data in the Input_Actual Excel sheet
2️⃣ Enter target values in the Input_Target sheet
3️⃣ Maintain KPI logic in the KPI Definition sheet
4️⃣ Refresh the Power BI dashboard
5️⃣ Use slicers to filter by month or KPI group
6️⃣ Review the Summary Page for instant performance clarity
7️⃣ Analyze trends on the KPI Trend Page
8️⃣ Drill through to KPI definitions for transparency and alignment
No advanced Power BI skills required—just structured data and smart insights.
👥 Who Can Benefit from This Internal Communications KPI Dashboard in Power BI
This dashboard is ideal for:
📣 Internal Communications Teams – Measure message effectiveness and engagement
👥 HR Teams – Track communication impact on employee alignment
🏢 Change Management Teams – Monitor communication performance during transformations
📊 Business Leaders & Managers – Gain visibility into communication health
📋 Corporate Affairs Teams – Standardize reporting across departments
📈 Strategy & Analytics Teams – Reduce manual reporting effort
Because the dashboard is flexible, it adapts easily across industries and organization sizes.
📘 Click here to read the detailed blog post
▶️ Visit our YouTube channel to learn step-by-step video tutorials
Watch the step-by-step video tutorial:
Compatibility and Requirements
- Works in Power BI Desktop, which is free to download. Microsoft explains how to get it in Get Power BI Desktop.
- You enter your data in the Excel input sheets (Input_Actual, Input_Target and KPI Definition), then refresh the dashboard in Power BI.
Frequently Asked Questions
How many pages does the dashboard have?
Three pages: Summary, KPI Trend and KPI Definition.
Where do I enter my data?
Enter actual values in the Input_Actual sheet and targets in the Input_Target sheet. Keep KPI formulas, units and definitions in the KPI Definition sheet. Then refresh the Power BI dashboard.
Can I filter by month or KPI group?
Yes. The Summary page has slicers for month and KPI group, so you can narrow the table and KPI cards to the period and category you want.
How do I see if a KPI met its target?
The KPI performance table shows green and red arrows as target status indicators. It also lists actuals, targets and previous-year values side by side.
Is there an Excel or Google Sheets version?
Yes. See the Internal Communications KPI Dashboard in Excel and the Internal Communications KPI Dashboard in Google Sheets.
Related KPI Dashboard Templates
- Internal Communications KPI Dashboard in Excel: the same KPIs in Excel
- Internal Communications KPI Dashboard in Google Sheets: the Google Sheets edition
- Internal Audit KPI Dashboard in Power BI: another internal KPI dashboard for Power BI
- Audit & Internal Controls KPI Dashboard in Power BI: KPI tracking for controls and audits
- Power BI Dashboard Mega Collection: 15 Power BI templates in one download
Browse all Power BI KPI dashboards.















Reviews
There are no reviews yet.