Managing refinery purchasing operations without clear visibility often results in cost overruns, delayed approvals, and missed savings opportunities. Refinery procurement teams deal with high-value purchases, strict budgets, multiple suppliers, and urgent requests every day. When purchasing data remains scattered across spreadsheets and static reports, decision-making becomes slow and reactive.
That is exactly why the Refinery Purchasing Dashboard in Power BI is a powerful and essential solution. 🚀
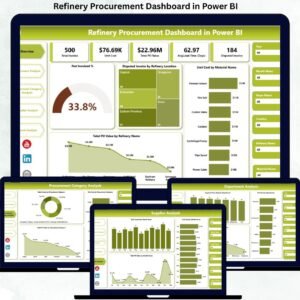
This professionally designed Power BI dashboard transforms complex purchasing data into interactive KPIs, visual insights, and real-time performance indicators. As a result, refinery procurement teams gain better control over budgets, baseline costs, negotiated savings, and high-priority purchases — all from a single centralized dashboard.
Built for refinery operations, this dashboard helps organizations move from manual tracking to data-driven purchasing excellence.
Key Features of Refinery Purchasing Dashboard in Power BI 🔑
📊 Centralized Purchasing Visibility
Monitor all refinery purchasing KPIs in one interactive Power BI dashboard.
📈 Real-Time Cost & Savings Tracking
Track baseline cost, total budget, negotiated savings, and high-priority purchases instantly.
🧭 Interactive Slicers & Filters
Analyze purchasing data by category, refinery plant, requesting department, buyer, and time period.
📉 Category, Department & Plant Insights
Identify high-spend areas, urgent demand patterns, and savings opportunities quickly.
📅 Monthly Trend Analysis
Understand purchasing behavior over time to support forecasting and planning.
⚡ Faster Decision-Making
Visual insights allow leadership to act quickly on cost control and approvals.
💼 Management-Ready Reporting
Ideal for procurement reviews, audits, and strategic sourcing discussions.
What’s Inside the Refinery Purchasing Dashboard in Power BI 📁
This ready-to-use Power BI solution includes five professionally designed analytical pages, each focused on a critical purchasing dimension.
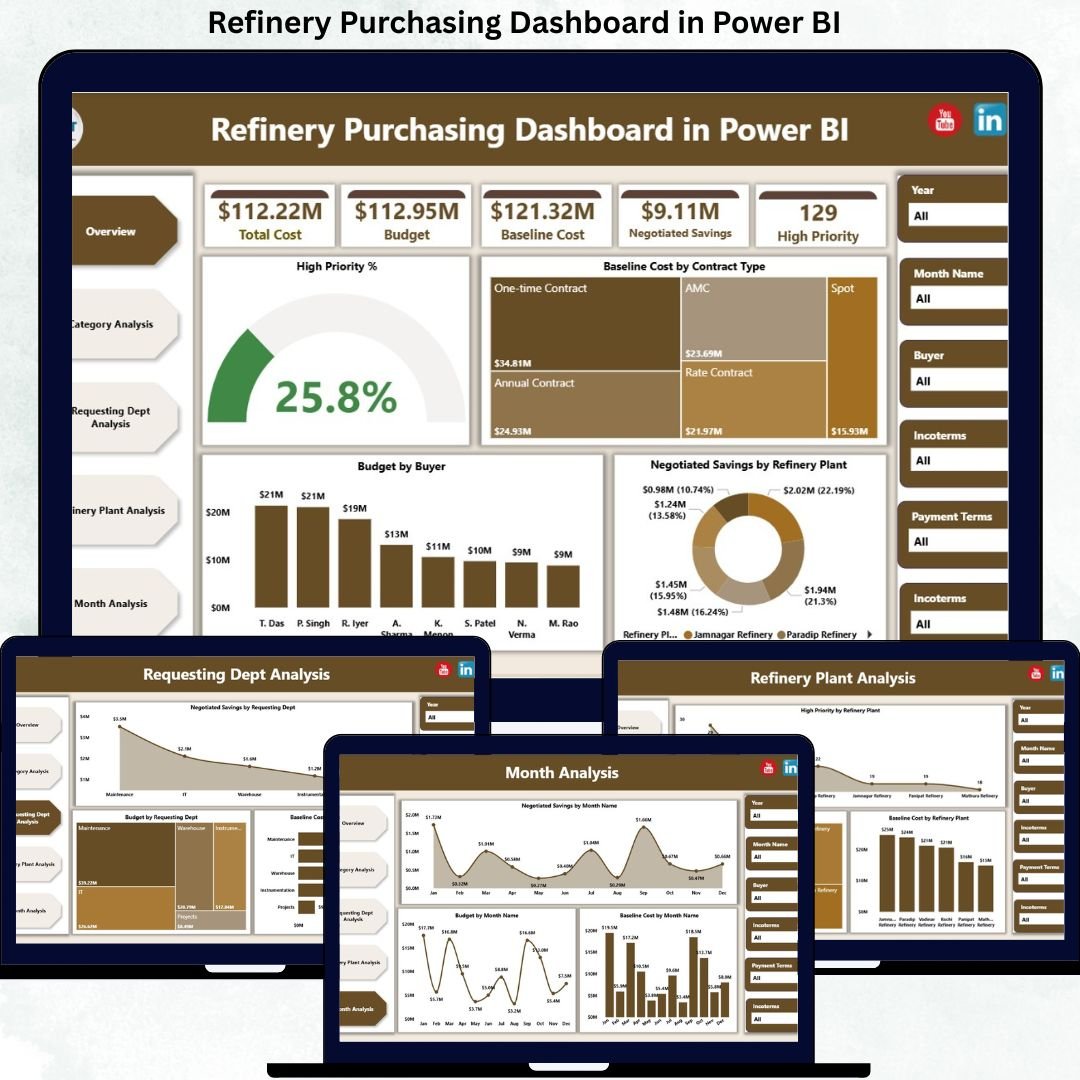
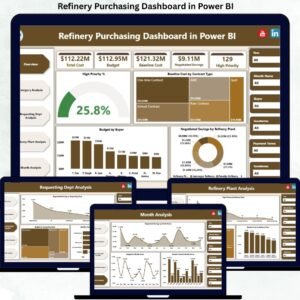
📄 Overview Page
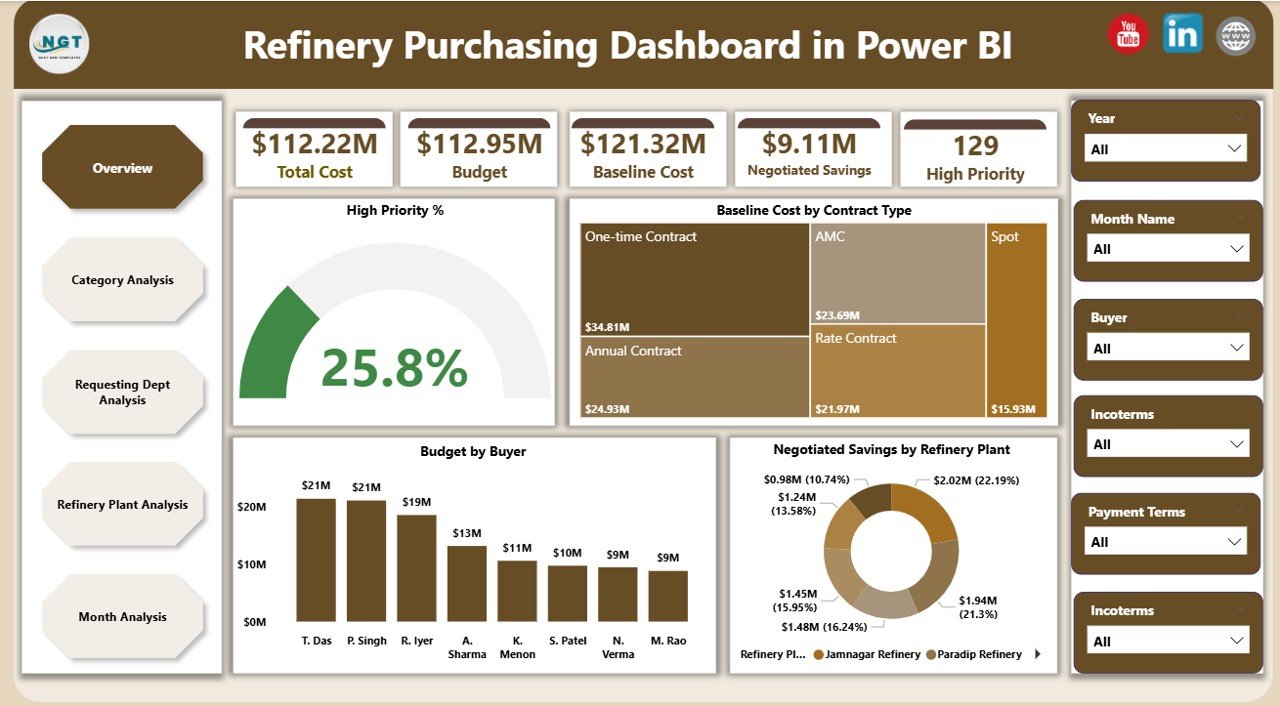
Acts as the command center of the dashboard and provides a high-level snapshot of purchasing performance.
Includes:
-
KPI Cards: High Priority %, Baseline Cost, Total Budget, Negotiated Savings
-
High Priority %
-
Baseline Cost by Contract Type
-
Budget by Buyer
-
Negotiated Savings by Refinery Plant
This page gives leadership instant clarity on cost drivers, savings impact, and urgent purchasing activity.
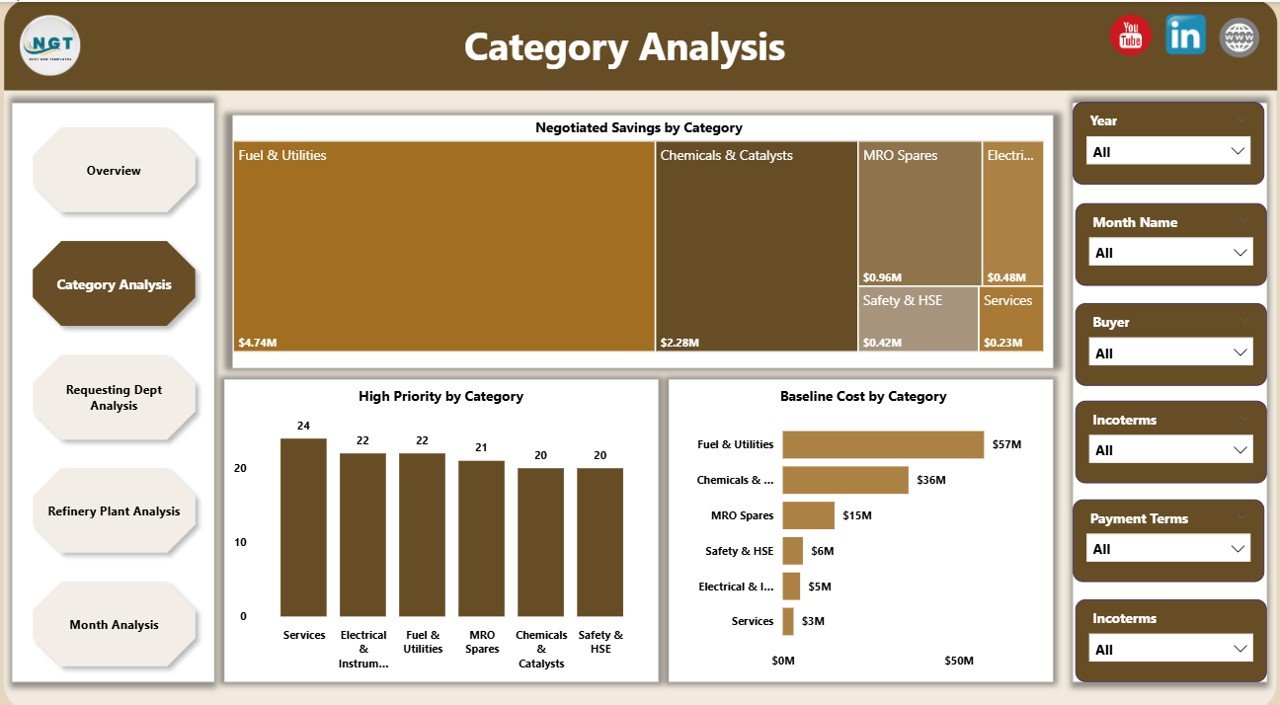
📄 Category Analysis Page
Analyzes procurement performance by purchasing category.
Includes:
-
Negotiated Savings by Category
-
High Priority Purchases by Category
-
Baseline Cost by Category
Helps procurement teams optimize category strategies and renegotiate contracts effectively.
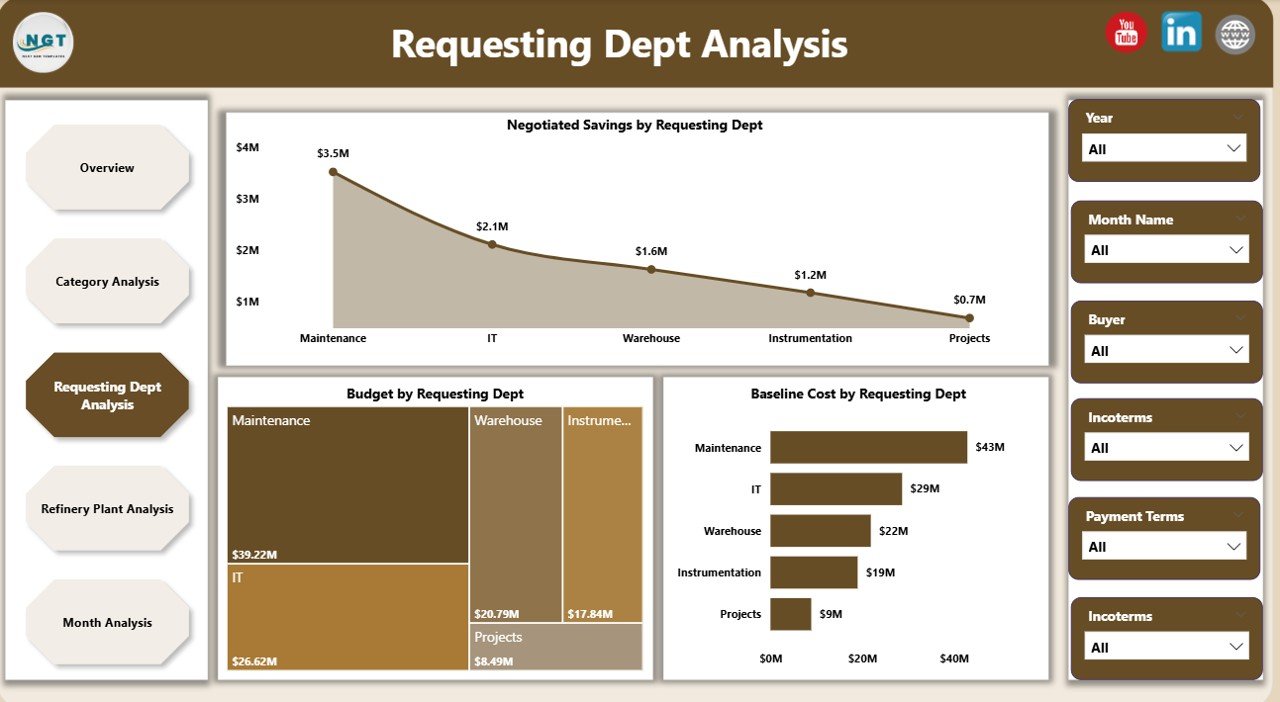
📄 Requesting Department Analysis Page
Tracks purchasing behavior across departments.
Includes:
-
Negotiated Savings by Requesting Department
-
Budget by Requesting Department
-
Baseline Cost by Requesting Department
Improves accountability and highlights departments driving higher costs or savings.
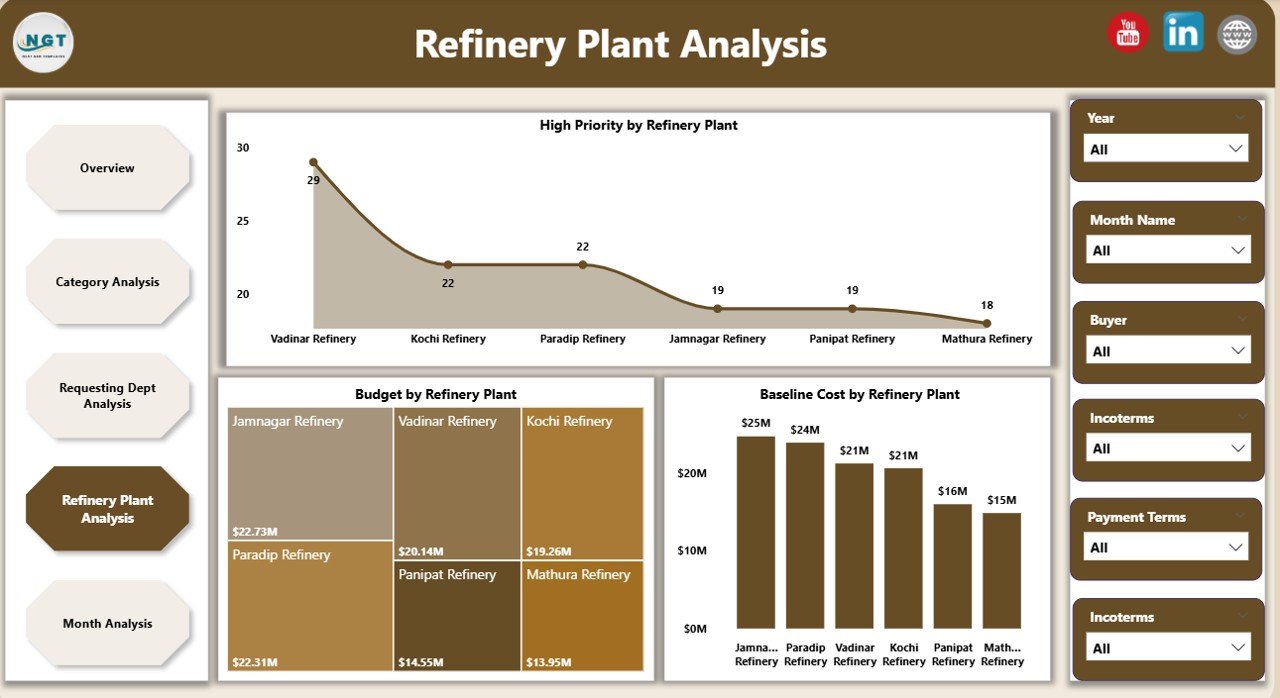
📄 Refinery Plant Analysis Page
Provides plant-wise purchasing visibility across refinery locations.
Includes:
-
High Priority by Refinery Plant
-
Budget by Refinery Plant
-
Baseline Cost by Refinery Plant
Supports cost standardization and performance comparison across plants.
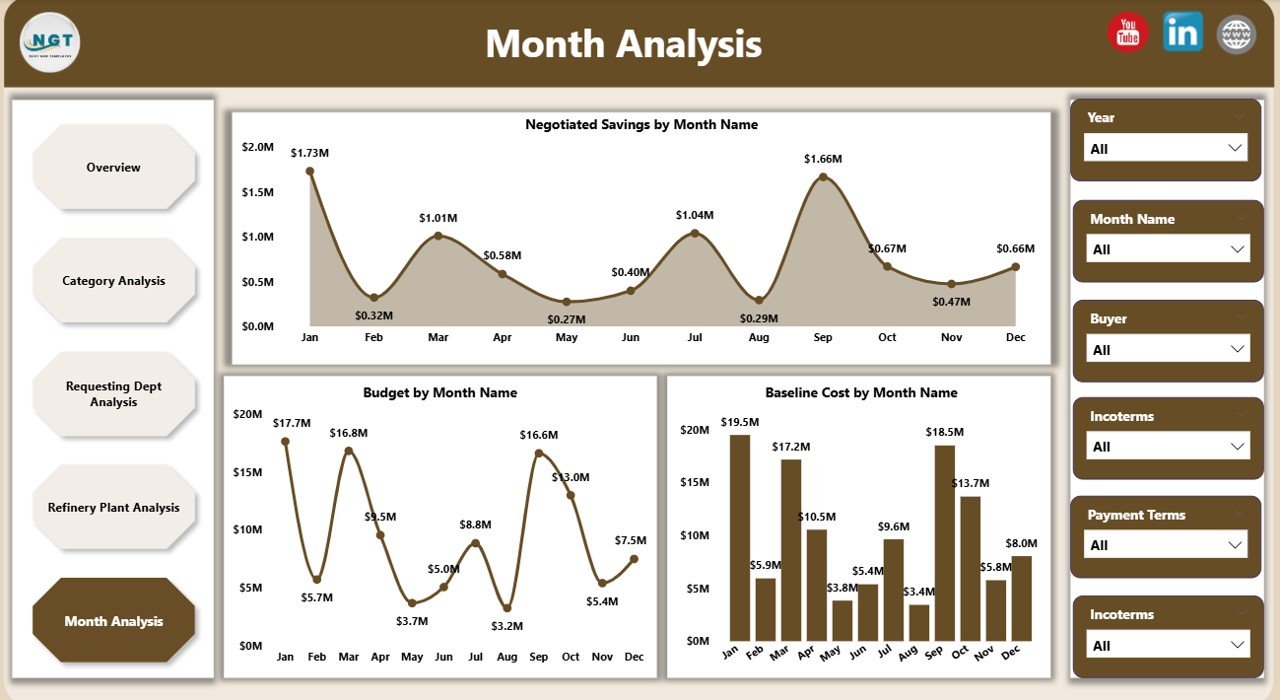
📄 Monthly Trends Page
Tracks purchasing performance over time.
Includes:
-
Negotiated Savings by Month
-
Budget by Month
-
Baseline Cost by Month
Helps forecast budgets, identify seasonal patterns, and maintain savings consistency.
How to Use the Refinery Purchasing Dashboard in Power BI 🛠️
1️⃣ Load purchasing data from Excel or connected systems
2️⃣ Refresh the Power BI dashboard
3️⃣ Apply slicers to filter by category, plant, department, or month
4️⃣ Review KPIs, savings, and cost trends
5️⃣ Use insights for approvals, negotiations, and planning
No advanced technical skills are required. The dashboard is intuitive and easy to use.
Who Can Benefit from This Refinery Purchasing Dashboard 👥
🏭 Refinery Procurement Managers – Gain full purchasing visibility
💼 Buyers & Category Managers – Track budgets and negotiated savings
💰 Finance & Cost Control Teams – Monitor baseline vs actual cost
📊 Supply Chain Analysts – Identify trends and inefficiencies
🧑💼 Senior Management – Make confident, data-driven decisions
Suitable for both single-plant and multi-plant refinery operations.


Reviews
There are no reviews yet.