Managing clinic purchasing is complex, high-volume, and cost-sensitive. Clinics deal daily with medicines, medical equipment, consumables, services, taxes, and multiple vendors. When purchasing data remains scattered across Excel files, invoices, emails, and ERP exports, visibility drops fast. As a result, costs rise, pending orders increase, and compliance risks grow.
That is exactly why the Clinic Purchasing Dashboard in Power BI is a powerful and practical solution. 🚀
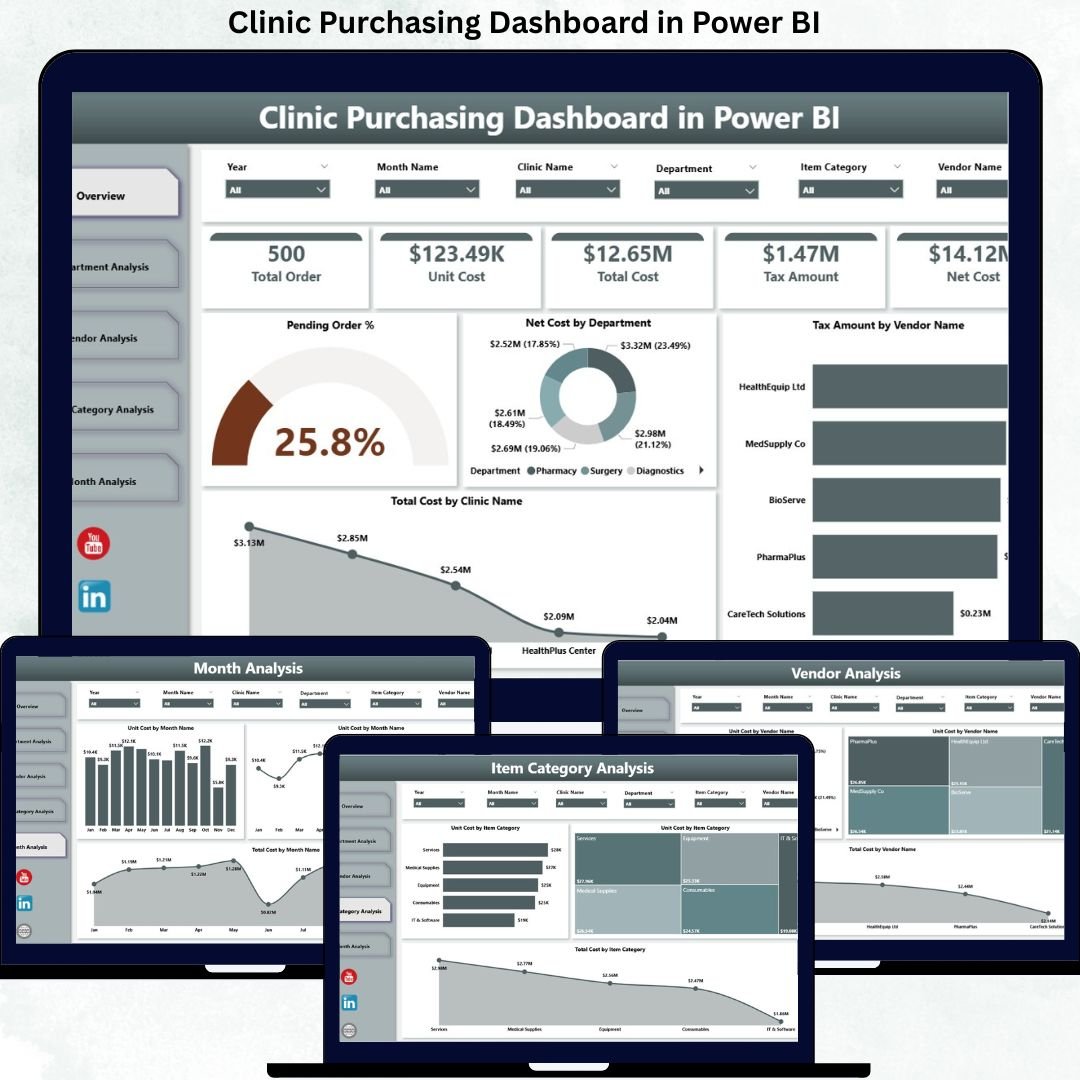
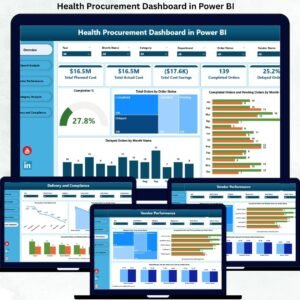
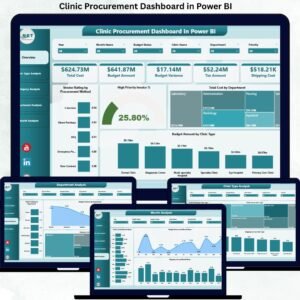
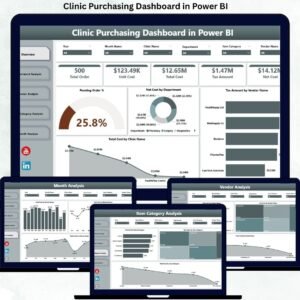
This professionally designed Power BI dashboard converts raw purchasing data into clear KPIs, interactive charts, and real-time insights—helping clinics control spending, monitor vendors, and improve purchasing efficiency with confidence.
Built for healthcare environments, this dashboard enables procurement and finance teams to move from manual reporting to proactive, data-driven purchasing control.
Key Features of Clinic Purchasing Dashboard in Power BI 🔑
📊 Centralized Purchasing Visibility
Track all purchasing activity across clinics, departments, vendors, and item categories from one interactive dashboard.
📈 Real-Time KPI Cards
Instantly monitor Pending Order %, Net Cost, Tax Amount, and Total Cost for fast decision-making.
🧭 Interactive Filters & Slicers
Analyze purchasing data by clinic name, department, vendor, item category, or time period.
📉 Department & Vendor Cost Insights
Identify high-spending departments and cost-intensive vendors in seconds.
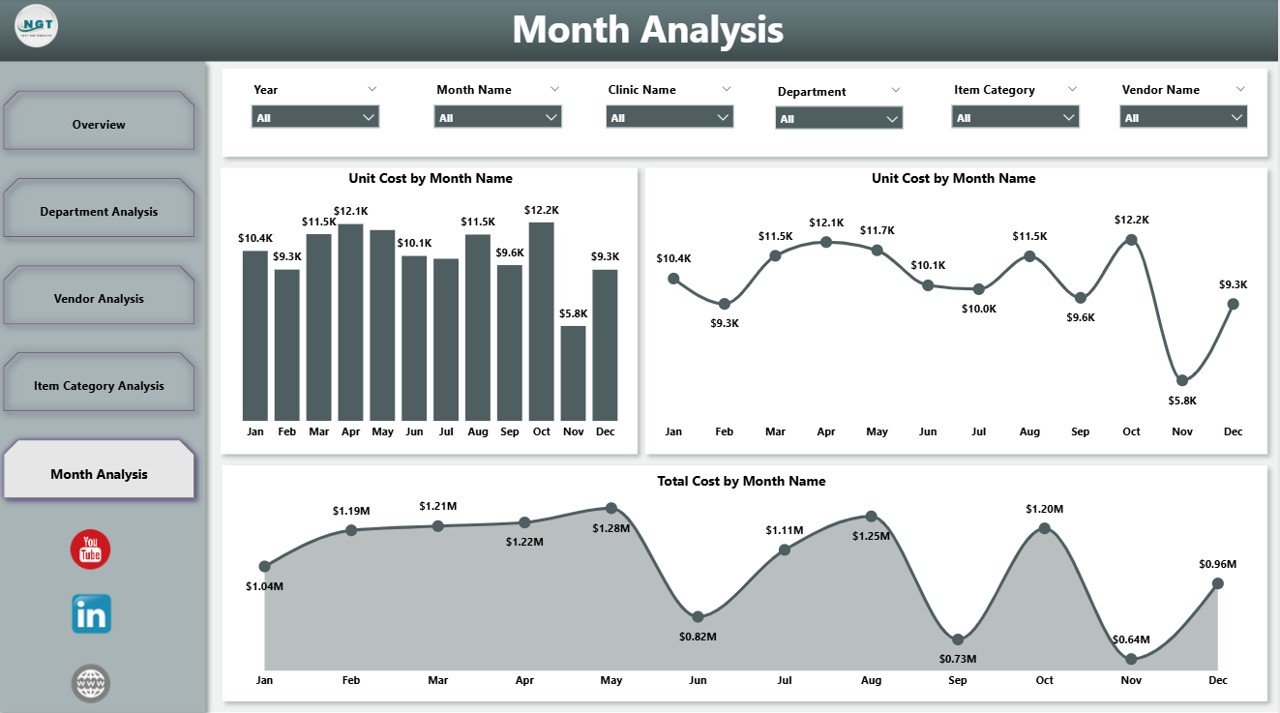
📅 Monthly Cost Trend Analysis
Understand seasonality, price fluctuations, and tax trends over time.
⚡ Faster Procurement Decisions
Dynamic visuals update instantly, reducing delays and manual effort.
💼 Management & Audit-Ready Reporting
Perfect for leadership reviews, compliance checks, and budget discussions.
What’s Inside the Clinic Purchasing Dashboard in Power BI 📁
This ready-to-use Power BI solution includes five professionally designed analytical pages:
📄 Overview Page
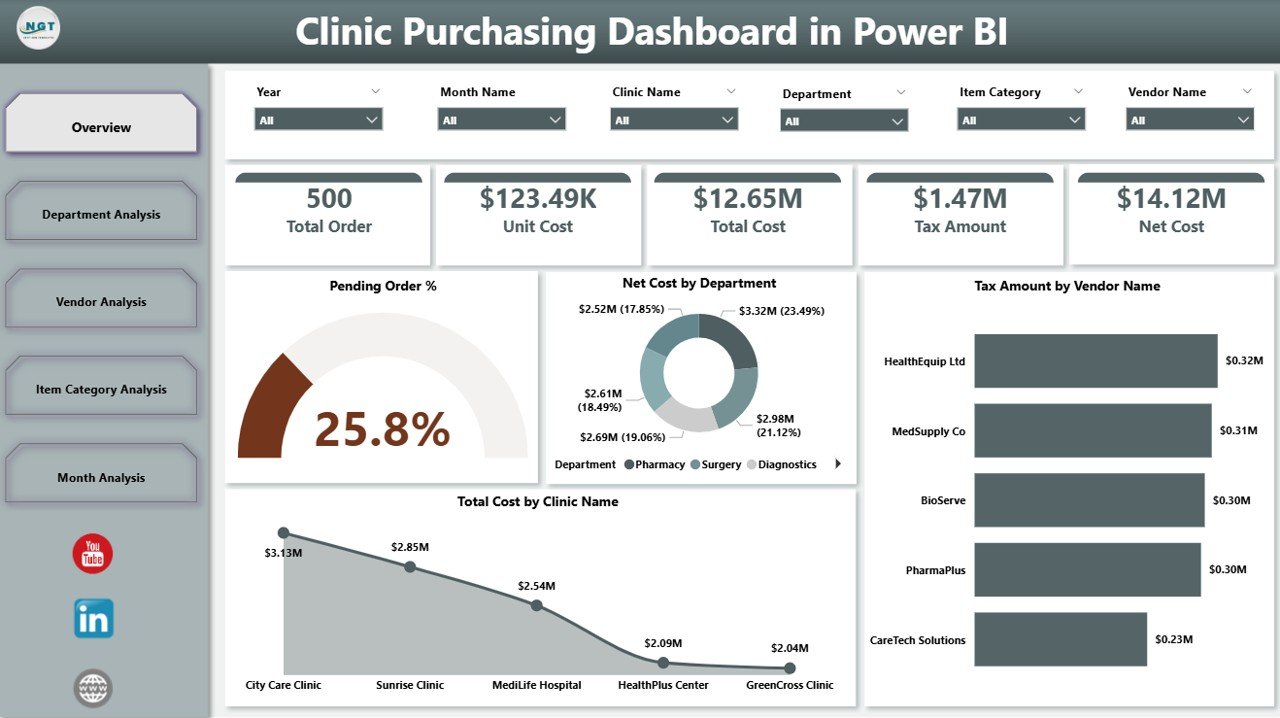
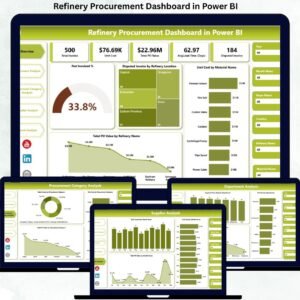
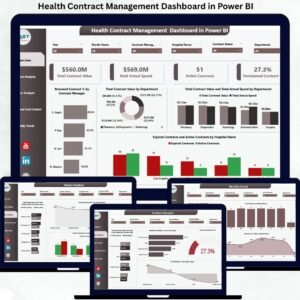
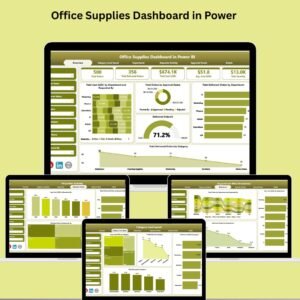
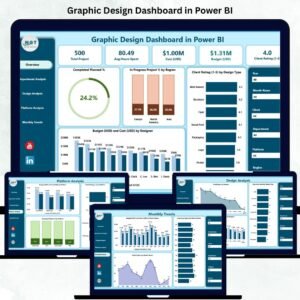
High-level snapshot with KPI cards and charts such as Pending Order %, Net Cost by Department, Tax Amount by Vendor, and Total Cost by Clinic Name.
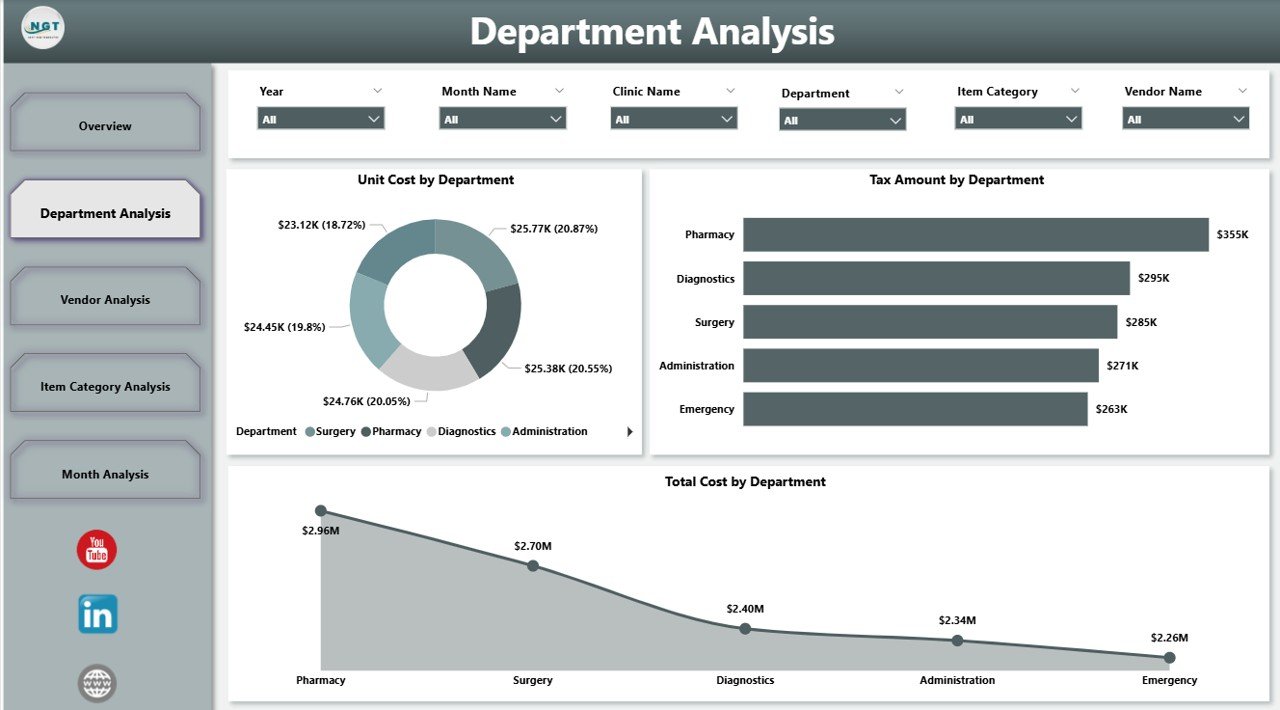
📄 Department Analysis Page
Analyze Unit Cost, Tax Amount, and Total Cost by department to control internal spending.
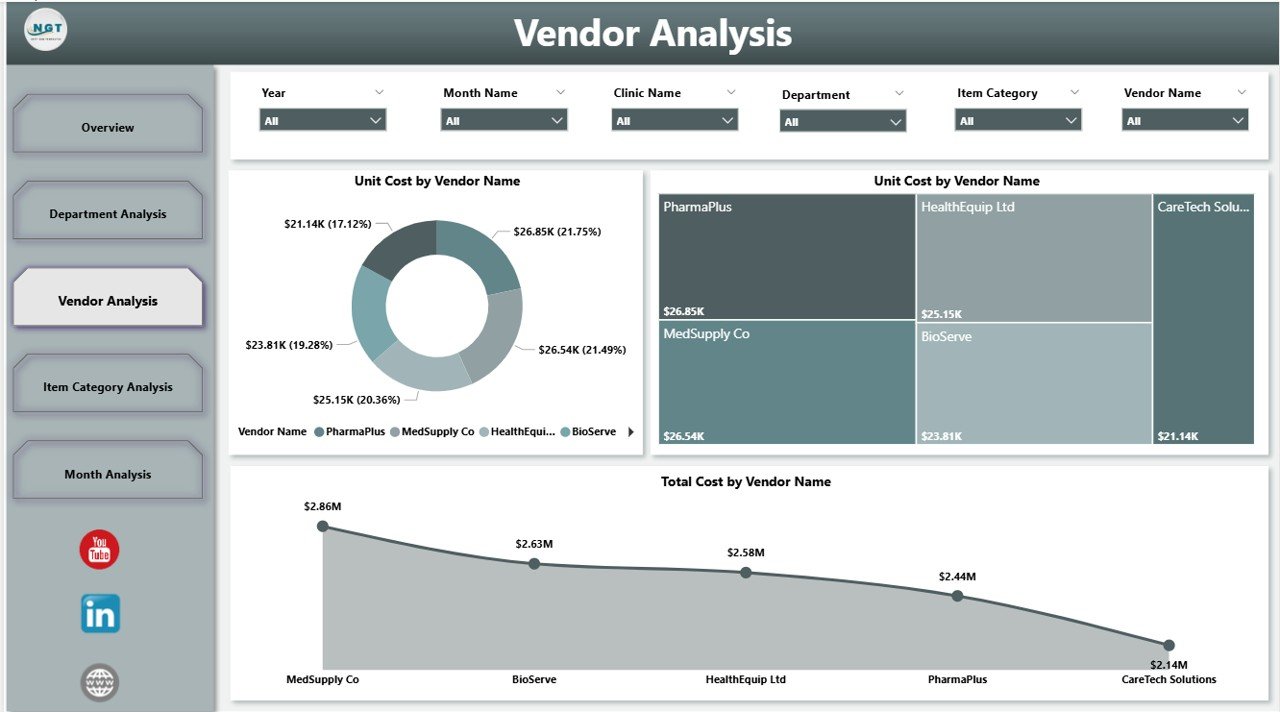
📄 Vendor Analysis Page
Compare vendor pricing, tax impact, and total purchasing cost to improve negotiations.
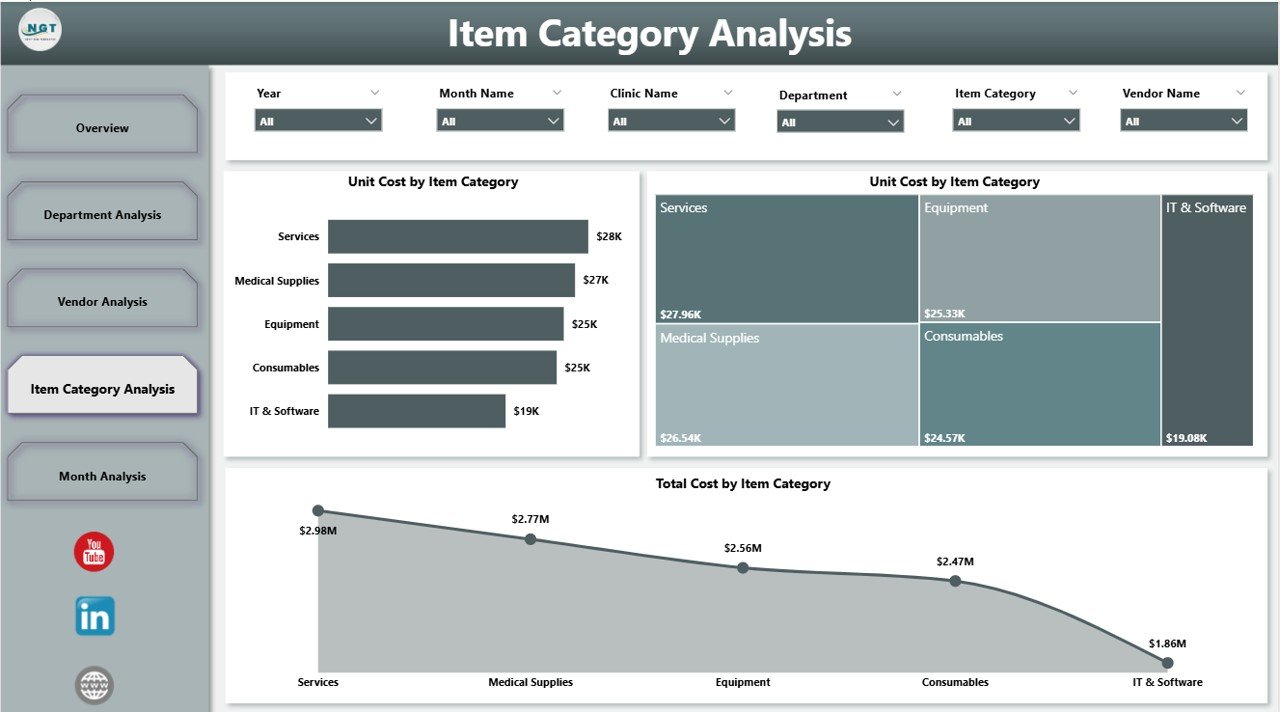
📄 Item Category Analysis Page
Understand which item categories drive the most cost and tax impact.
📄 Monthly Trends Page
Track Unit Cost, Tax Amount, and Total Cost month by month for better forecasting.
Each page is designed to answer real purchasing questions faced by clinic leadership.
How to Use the Clinic Purchasing Dashboard in Power BI 🛠️
1️⃣ Connect purchasing data from Excel, ERP, or accounting systems
2️⃣ Apply slicers to filter by clinic, department, vendor, or category
3️⃣ View updated KPIs and charts instantly
4️⃣ Identify cost leakages and pending orders
5️⃣ Share insights securely with stakeholders
No complex technical setup is required—Power BI handles data transformation and visualization smoothly.
Who Can Benefit from This Clinic Purchasing Dashboard 👥
🏥 Clinic Administrators – Gain full visibility into purchasing performance
📦 Procurement Managers – Track orders, vendors, and costs efficiently
💰 Finance & Accounts Teams – Monitor spending, taxes, and budget impact
📊 Operations Managers – Improve purchasing control across departments
👔 Senior Leadership – Make faster, data-driven procurement decisions
Whether you manage a single clinic or a multi-location healthcare network, this dashboard scales with your needs.


Reviews
There are no reviews yet.