Refinery Contract Management Dashboard in a refinery environment is complex and high-risk. Refineries deal with long-term vendor agreements, high-value contracts, strict compliance requirements, and continuous monitoring of renewals and financial exposure. When contract data is managed through disconnected Excel files or manual trackers, visibility reduces, renewals are missed, and cost leakages occur.
That is exactly why the Refinery Contract Management Dashboard in Power BI is an essential and strategic solution. 🚀
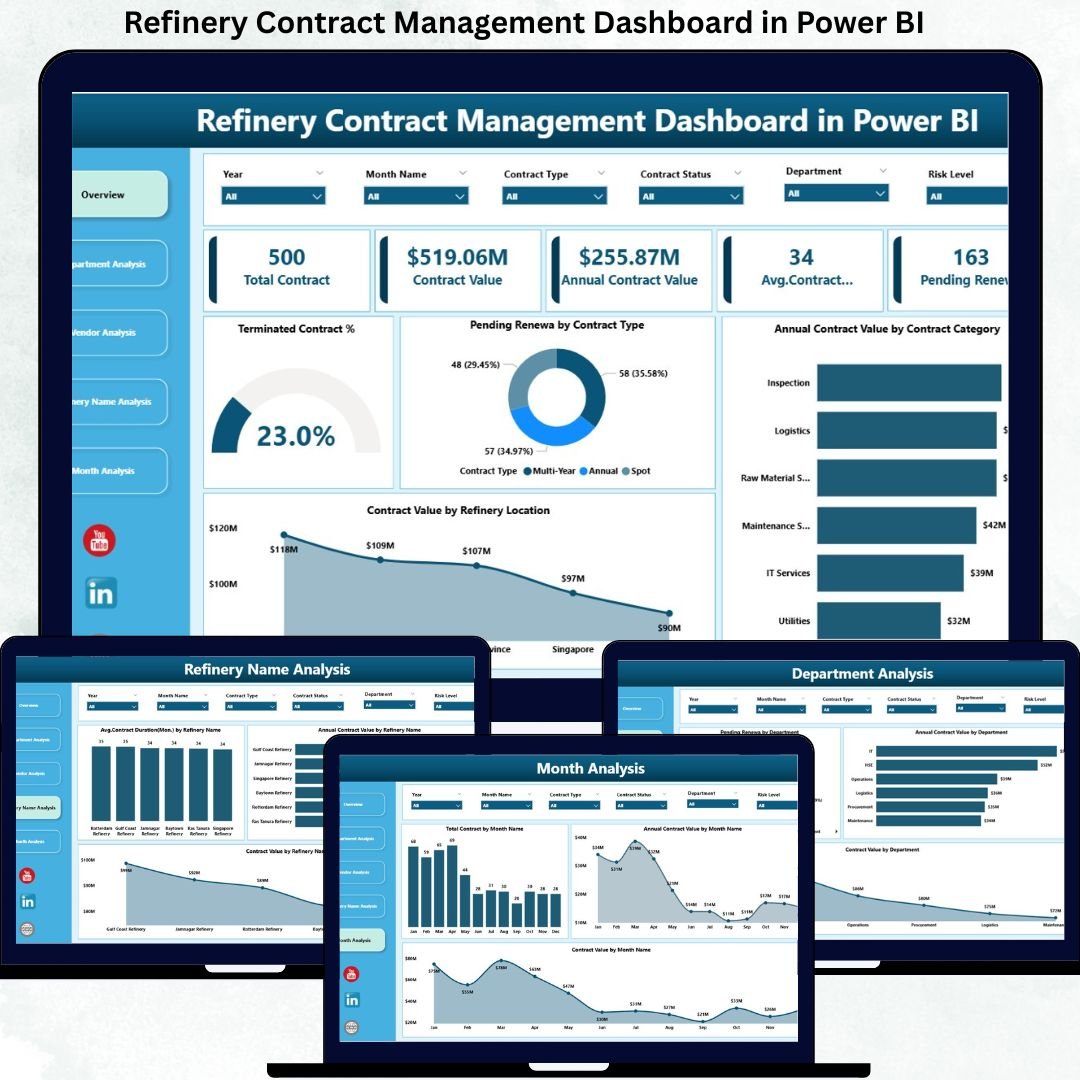
This professionally designed Power BI dashboard transforms raw contract data into clear KPIs, interactive visuals, and actionable insights. It helps refinery leadership track contract values, monitor renewals, evaluate vendor performance, and control risks — all from one centralized dashboard.
Built using Power BI with flexible data connectivity, this dashboard eliminates manual reporting and enables confident, data-driven contract decisions.
Key Features of Refinery Contract Management Dashboard in Power BI 🔑
📊 Centralized Contract Visibility
Track all refinery contracts, values, statuses, and renewals from a single interactive dashboard.
📈 Real-Time KPI Monitoring
Instantly monitor Total Contracts, Active Contracts, Pending Renewals, and Terminated Contract %.
🧭 Interactive Slicers & Filters
Analyze contract data by refinery location, department, vendor, contract category, and time period.
📉 Vendor & Department Performance Insights
Identify high-value vendors, long-term contracts, and departments with high renewal exposure.
📅 Monthly Trend Analysis
Track contract growth, value movement, and renewal patterns over time.
⚡ Faster & Proactive Decision-Making
Visual insights highlight renewal risks and cost exposure before issues arise.
💼 Management & Audit-Ready Reporting
Ideal for leadership reviews, compliance checks, and strategic planning.
What’s Inside the Refinery Contract Management Dashboard in Power BI 📁
This ready-to-use Power BI solution includes five professionally structured analytical pages, each designed for a specific contract management purpose.
📄 Overview Page
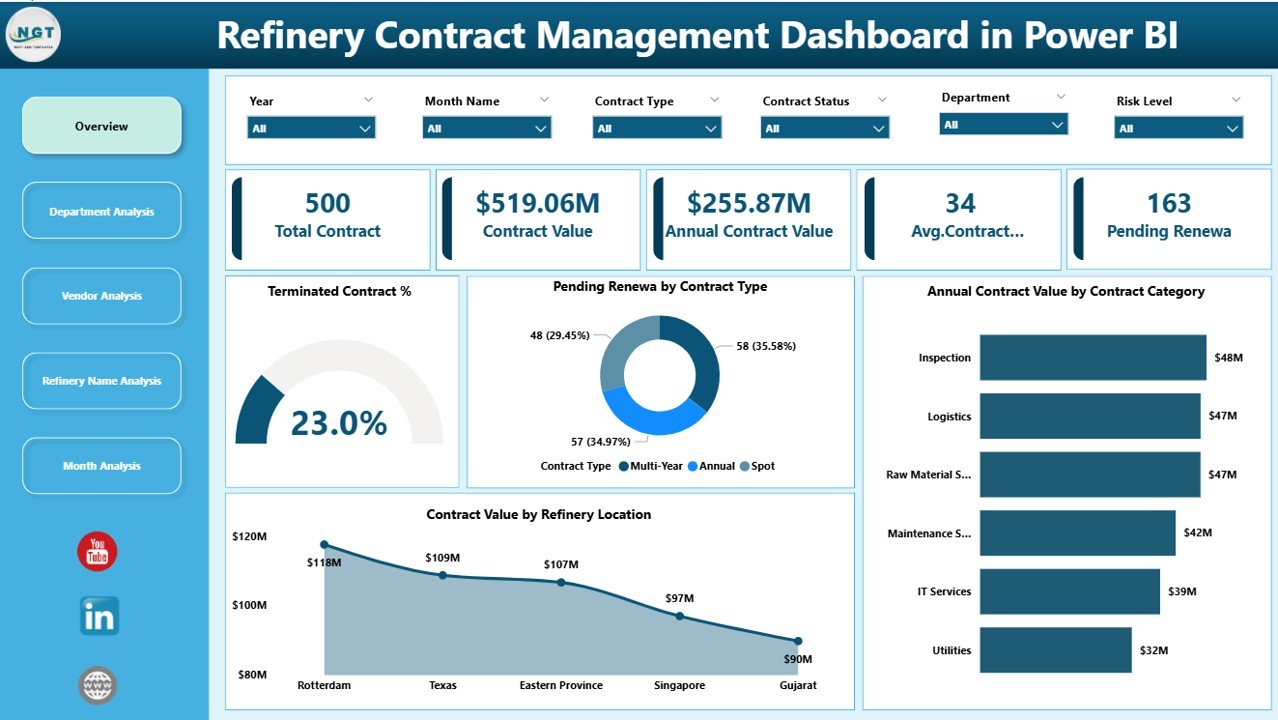
Provides an executive snapshot of the entire contract portfolio with KPI cards and charts such as Terminated Contract %, Pending Renewals by Contract Type, Annual Contract Value by Category, and Contract Value by Refinery Location.
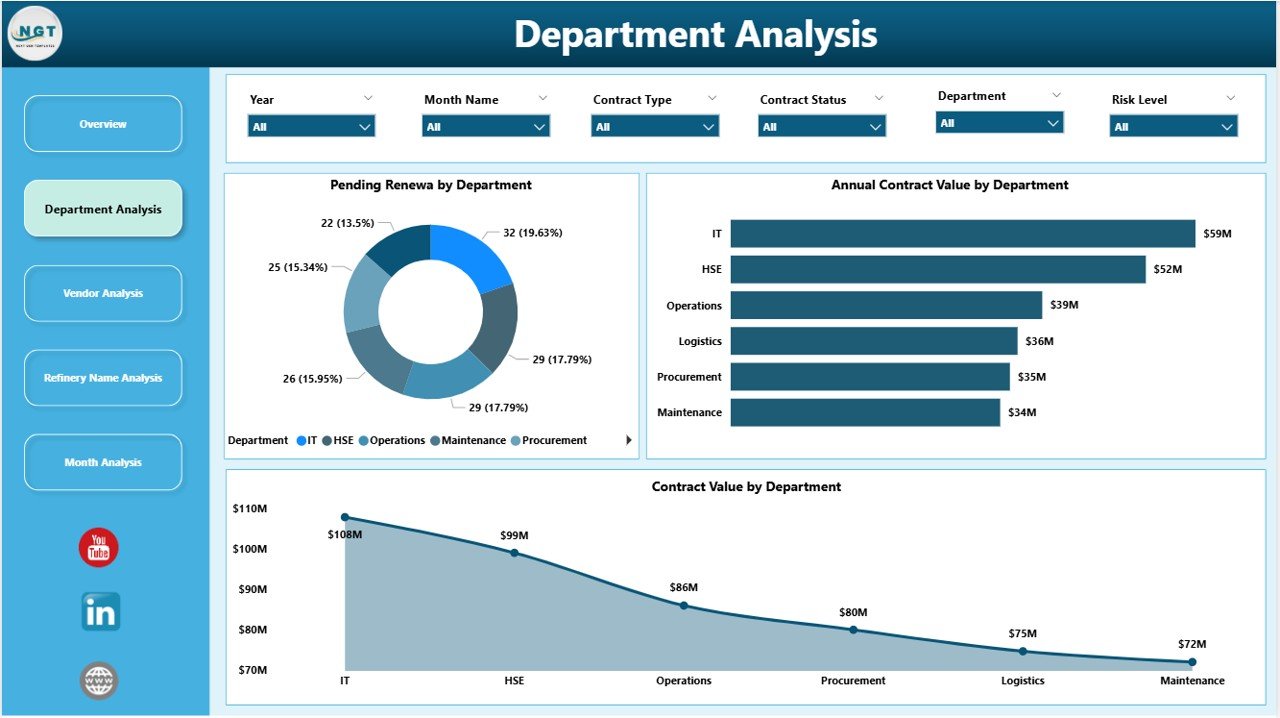
📄 Department Analysis Page
Shows department-wise contract exposure using Pending Renewals, Annual Contract Value, and Total Contract Value by Department.
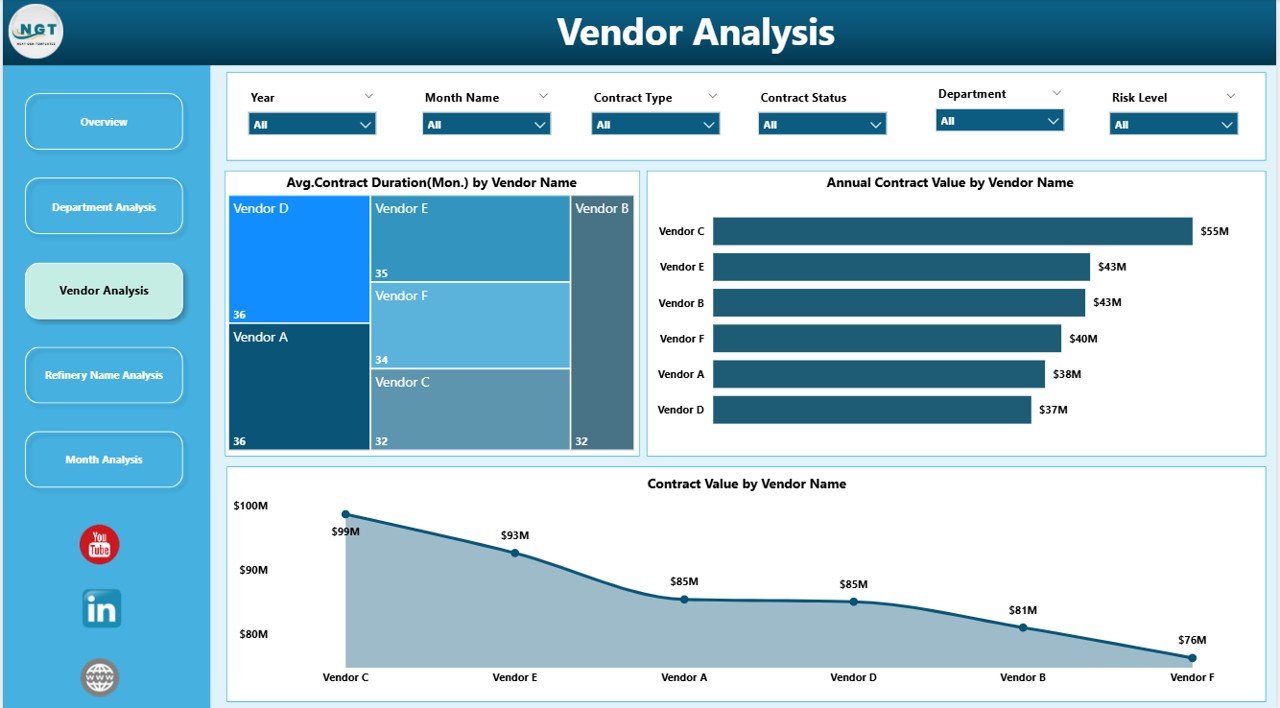
📄 Vendor Analysis Page
Evaluates vendor relationships through Average Contract Duration, Annual Contract Value, and Total Contract Value by Vendor Name.
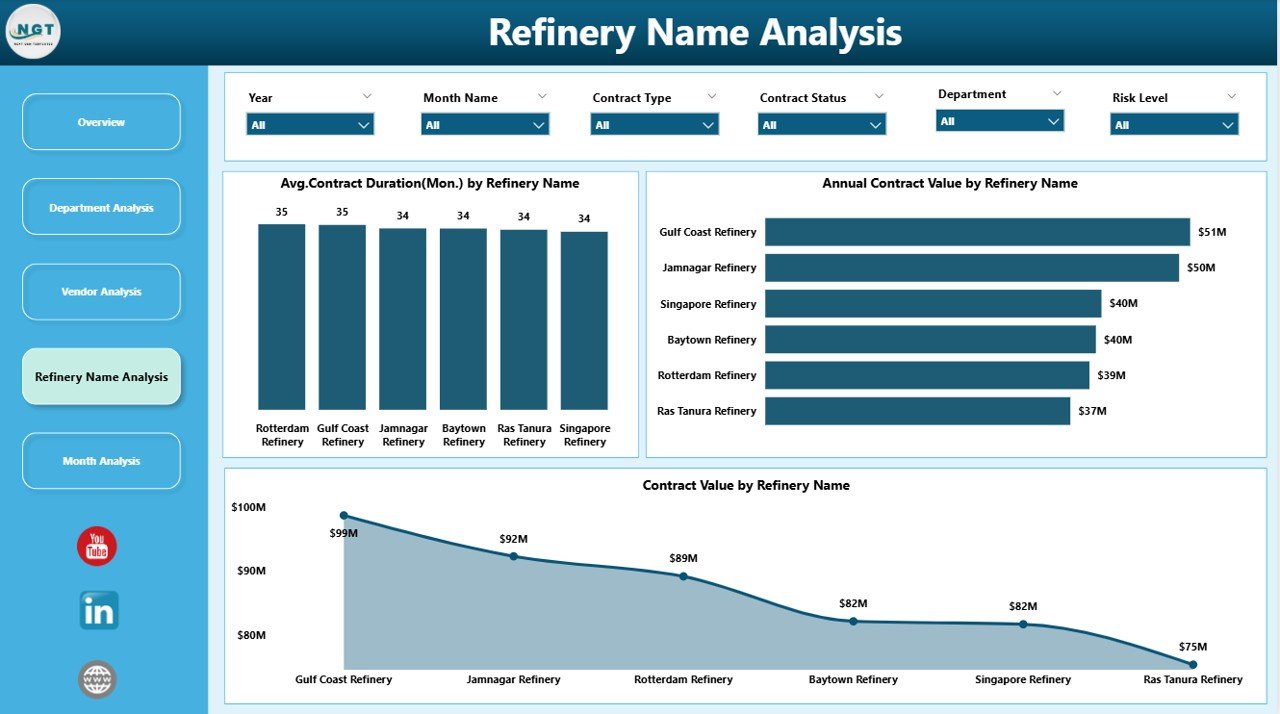
📄 Refinery Name Analysis Page
Compares contract maturity and spending across refinery locations using contract duration and value metrics.
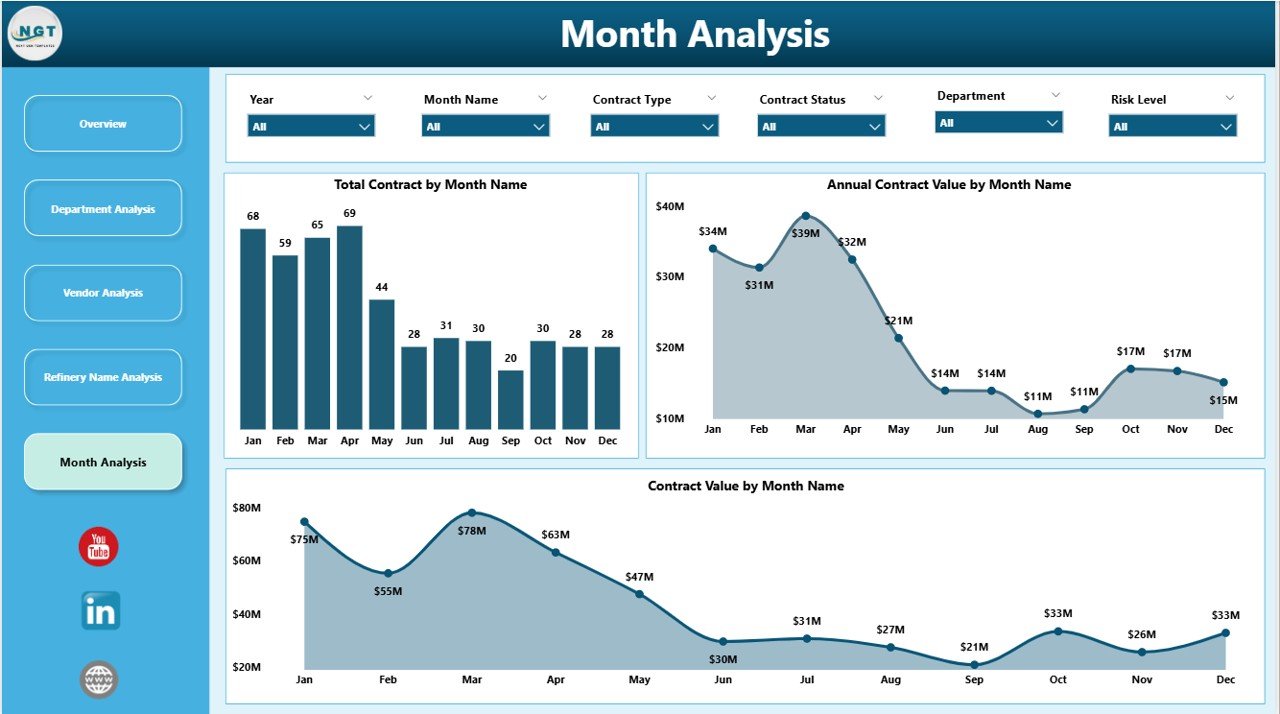
📄 Monthly Trends Page
Tracks Total Contracts, Annual Contract Value, and Contract Value by Month to identify trends and renewal cycles.
Each page uses interactive visuals and slicers for fast and focused analysis.
How to Use the Refinery Contract Management Dashboard in Power BI 🛠️
1️⃣ Load contract data from Excel, ERP, or databases
2️⃣ Refresh the Power BI dashboard
3️⃣ Apply slicers to filter by vendor, department, or refinery
4️⃣ Review KPIs and contract risk indicators
5️⃣ Use insights for renewals, negotiations, and audits
No advanced technical knowledge is required. The dashboard is intuitive and user-friendly.
Who Can Benefit from This Refinery Contract Management Dashboard 👥
🏭 Contract Managers – Track renewals and contract exposure
📦 Procurement Teams – Evaluate vendor contracts objectively
💰 Finance Teams – Monitor high-value contracts and budget exposure
⚙️ Compliance Officers – Support audit-ready reporting
👔 Senior Management – Gain strategic contract visibility
Suitable for both single-refinery and multi-refinery organizations.
### Click here to read the Detailed blog post
Visit our YouTube channel to learn step-by-step video tutorials


Reviews
There are no reviews yet.