
Corporate Social Responsibility (CSR) has evolved far beyond compliance and reporting. Today, organizations must measure real impact, manage budgets responsibly, and communicate outcomes transparently to stakeholders. However, many CSR teams still rely on scattered spreadsheets, manual calculations, and static presentations. As a result, insights remain unclear, reporting becomes time-consuming, and strategic decision-making slows down.
That is exactly where a Corporate Social Responsibility Dashboard in Google Sheets becomes a powerful and practical solution.
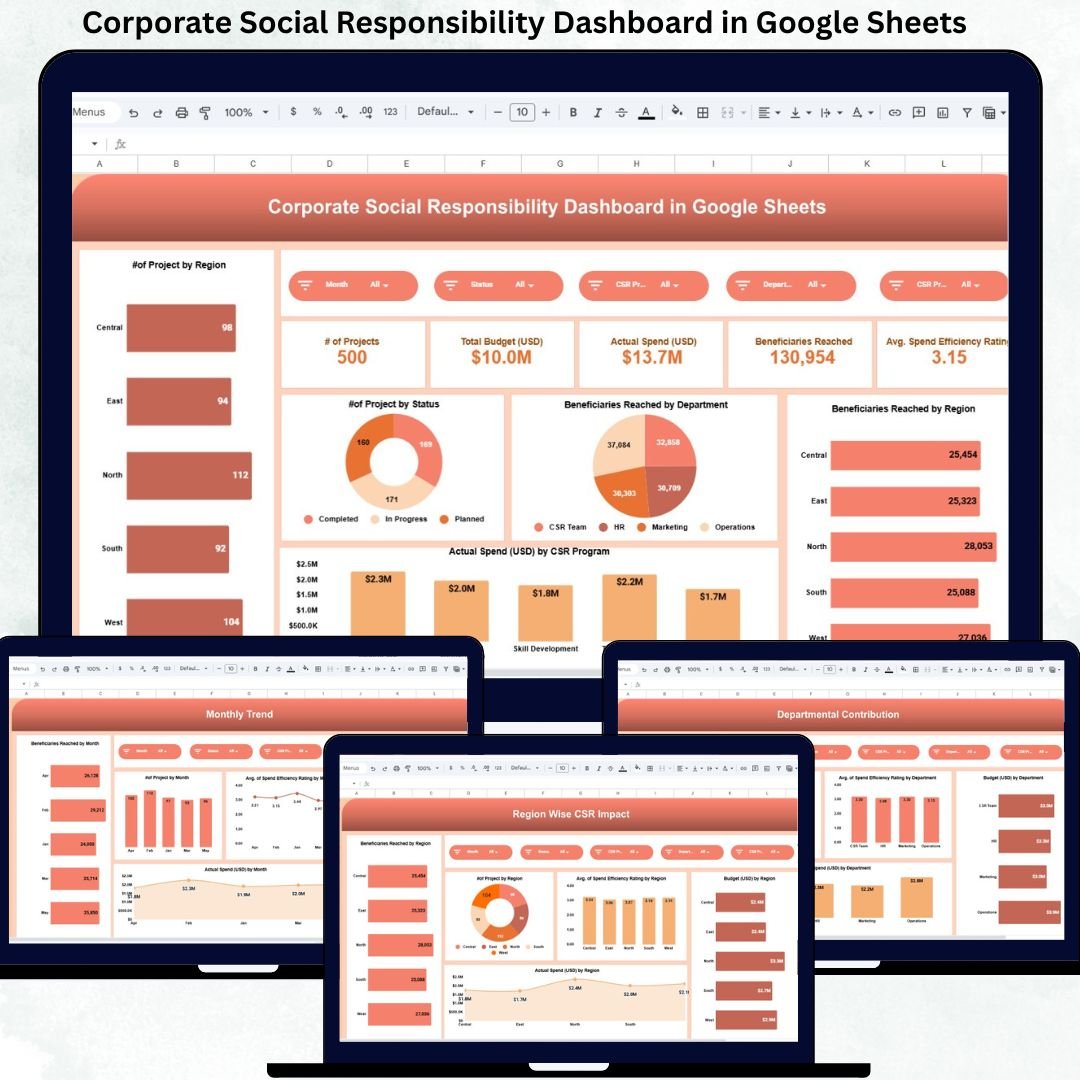
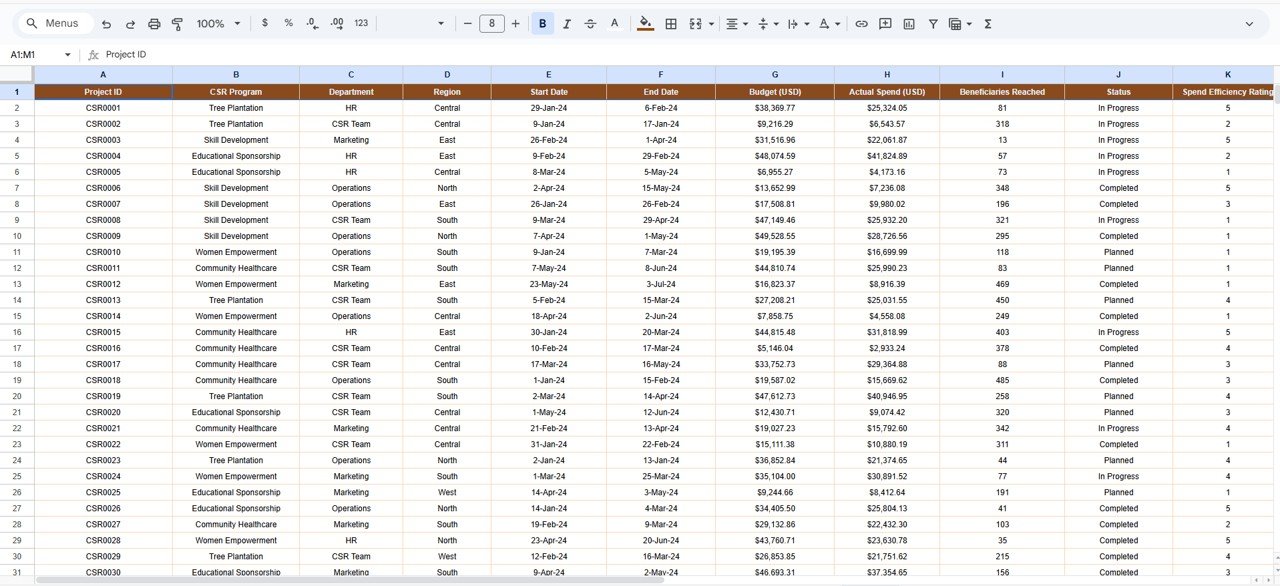
The Corporate Social Responsibility Dashboard in Google Sheets is a ready-to-use analytical system that centralizes all CSR data into one interactive dashboard. It helps organizations track CSR projects, budgets, actual spending, beneficiaries reached, and spend efficiency across programs, regions, departments, and time periods. Instead of compiling reports manually, CSR teams gain real-time visibility into performance and impact.
Because this dashboard is built entirely in Google Sheets, it remains cloud-based, collaborative, and cost-effective. Multiple stakeholders can work simultaneously, calculations update automatically, and insights remain accessible anytime—without expensive BI tools or complex software.
🌟 Key Features of the CSR Dashboard
-
🌍 Centralized CSR project tracking
-
💰 Budget vs actual spend monitoring
-
👥 Beneficiaries impact measurement
-
📊 Program, region & department-wise analysis
-
📈 Monthly trend and efficiency tracking
-
🔍 Smart search by keyword & field name
-
🔄 Real-time updates across all visuals
-
🤝 Easy collaboration in Google Sheets
📦 Dashboard Structure & What’s Inside
The dashboard is thoughtfully designed to support both operational tracking and strategic reporting.
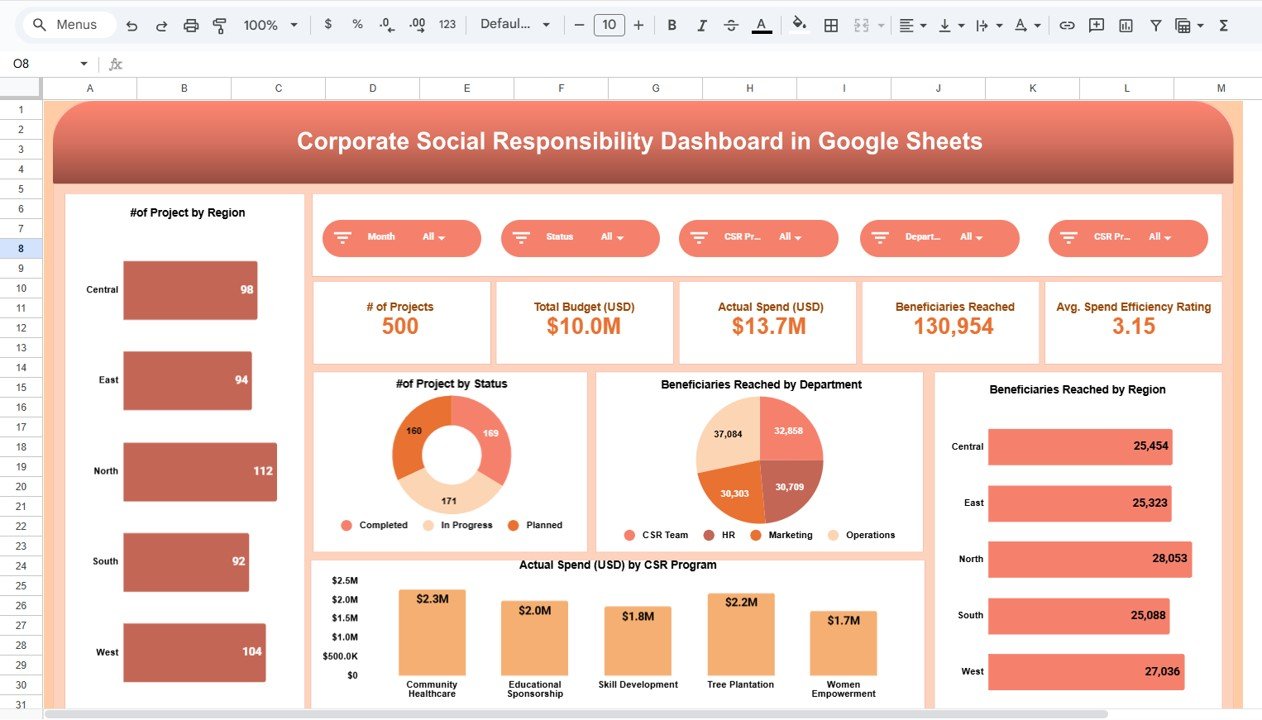
📊 Overview Sheet – Executive CSR Snapshot
This sheet provides a high-level summary ideal for leadership and board reviews.
KPI Cards
-
Number of Projects – Total CSR initiatives tracked
-
Total Budget (USD) – Planned CSR investment
-
Actual Spend (USD) – Budget utilized to date
-
Beneficiaries Reached – Total individuals impacted
-
Average Spend Efficiency Rating – Impact per dollar spent
Overview Charts
-
Projects by Region
-
Projects by Status (Planned, Ongoing, Completed)
-
Beneficiaries Reached by Department
-
Beneficiaries Reached by Region
-
Actual Spend (USD) by CSR Program
These visuals instantly communicate scale, reach, and financial discipline.
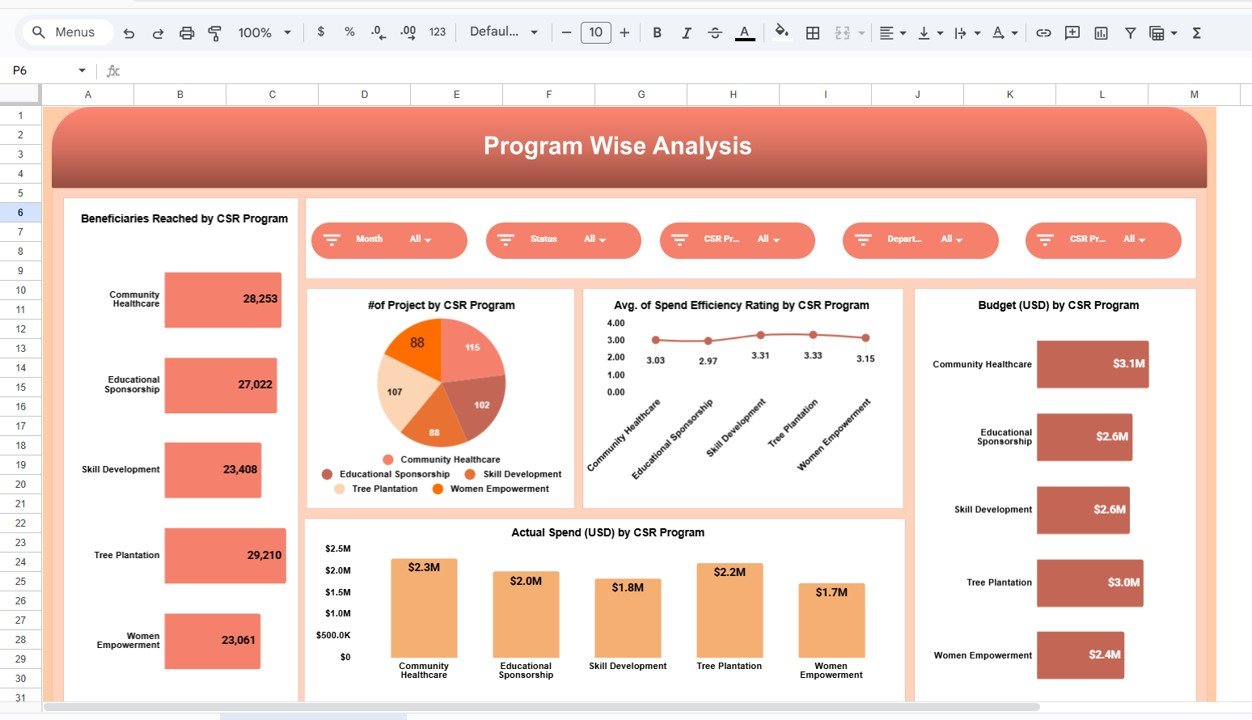
🎯 Program-Wise CSR Analysis
This section evaluates CSR initiatives such as Education, Healthcare, Environment, Community Development, and more.
Key Insights Provided
-
Beneficiaries Reached by CSR Program
-
Number of Projects by Program
-
Budget vs Actual Spend by Program
-
Average Spend Efficiency Rating by Program
This analysis helps organizations prioritize high-impact programs and optimize funding allocation.
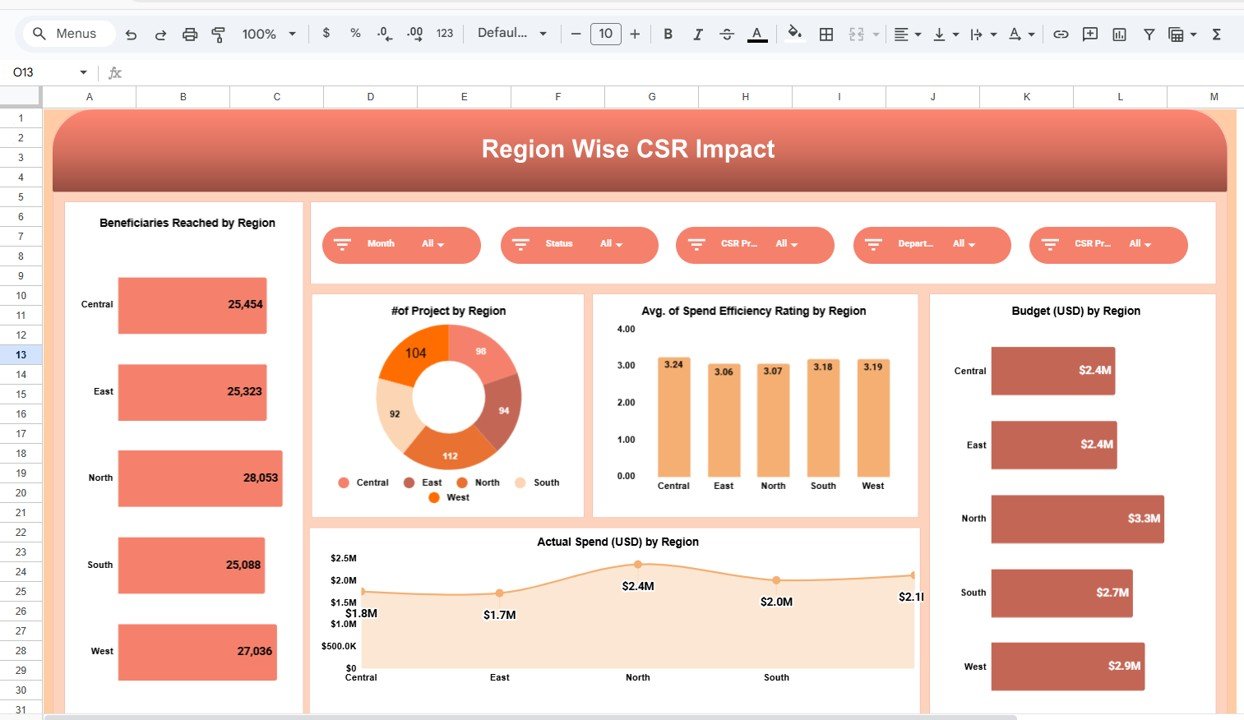
🌍 Region-Wise CSR Impact Analysis
CSR effectiveness often varies by geography. This section highlights:
-
Beneficiaries Reached by Region
-
Number of Projects by Region
-
Budget (USD) by Region
-
Actual Spend (USD) by Region
-
Average Spend Efficiency Rating by Region
With these insights, organizations can rebalance regional investments to maximize social impact.
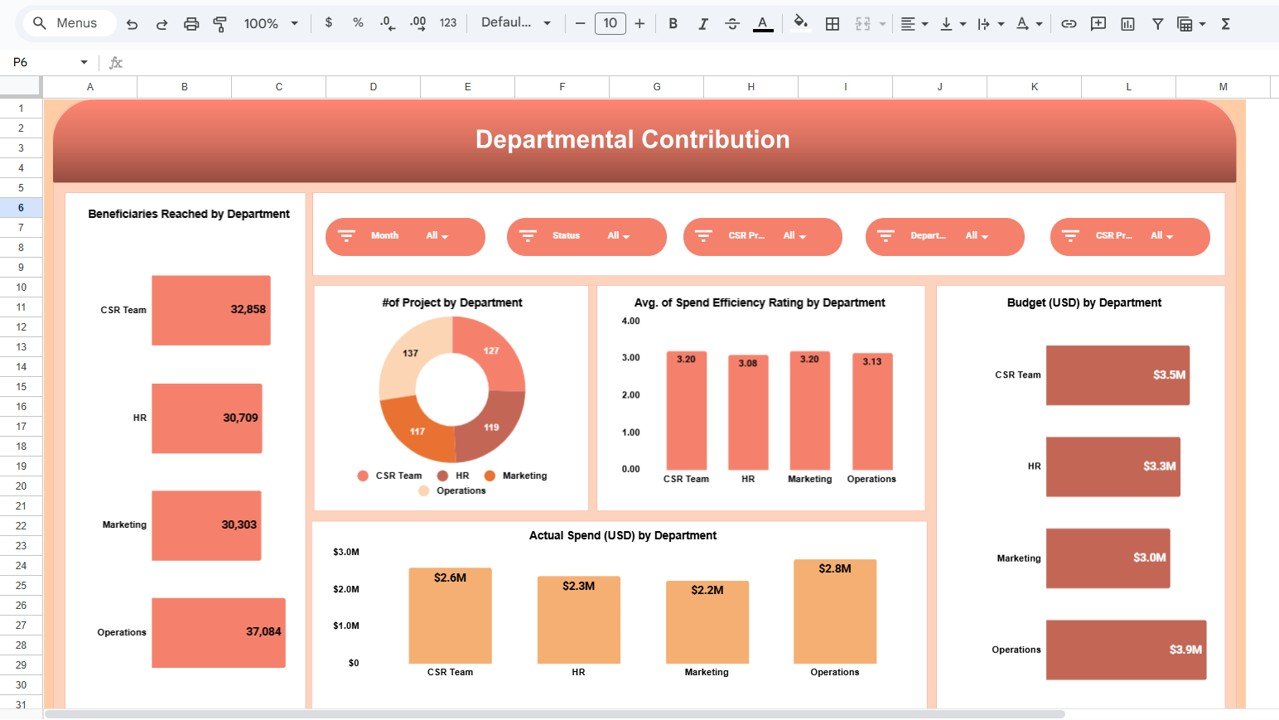
🏢 Departmental Contribution Analysis
CSR success depends on internal collaboration. This section shows how departments contribute.
Department-Level Insights
-
Beneficiaries Reached by Department
-
Projects Managed by Department
-
Budget vs Actual Spend by Department
-
Spend Efficiency Rating by Department
This view improves accountability, ownership, and engagement across teams.
📆 Monthly Trend Analysis
CSR performance changes over time. Monthly trends help track momentum and seasonality.
Monthly Metrics Tracked
-
Beneficiaries Reached by Month
-
Projects by Month
-
Budget (USD) by Month
-
Actual Spend (USD) by Month
-
Spend Efficiency Rating by Month
These trends support better forecasting and planning.
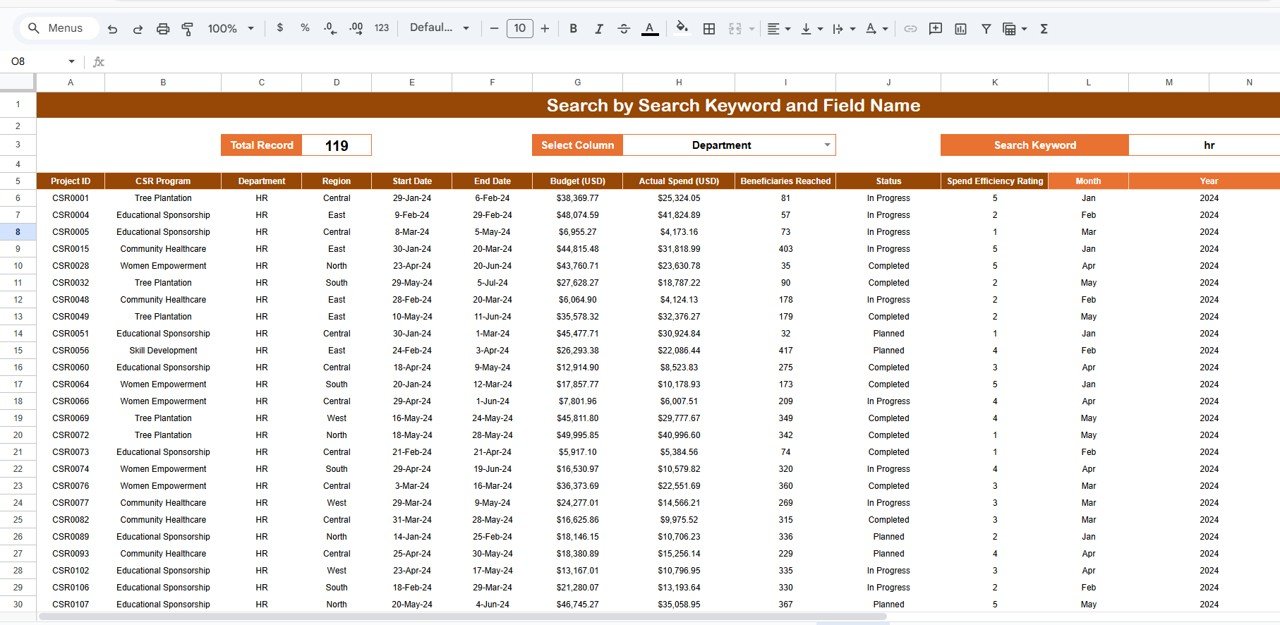
🔍 Smart Search Functionality
The dashboard includes a Search by Keyword and Field Name feature.
You can instantly filter data by:
-
Project Name
-
CSR Program
-
Region
-
Department
-
Project Status
This saves hours during audits, reporting, and management reviews.
🏆 Advantages of the CSR Dashboard
-
Centralized CSR reporting
-
Real-time impact visibility
-
Clear budget vs spend tracking
-
Data-driven CSR decision-making
-
Strong visual storytelling for stakeholders
-
Easy collaboration & audit readiness
-
No expensive BI tools required
🚀 Conclusion
A Corporate Social Responsibility Dashboard in Google Sheets transforms CSR management from manual tracking into strategic insight. With structured data, interactive charts, and real-time visibility, organizations can measure impact accurately, control budgets effectively, and communicate CSR outcomes with confidence. Because it is flexible, scalable, and easy to use, this dashboard is ideal for organizations of all sizes committed to responsible growth.
Click here to Read detailed blog post
Watch the step-by-step video tutorial:


Reviews
There are no reviews yet.