


Pop-up stores have become one of the most effective retail strategies for brands seeking flexibility, rapid market testing, and high customer engagement. Whether it is a seasonal activation, city launch, or promotional campaign, pop-up stores generate valuable data in a very short time. However, without proper analytics, brands often miss critical insights, overspend on operations, or fail to identify winning strategies.
That is exactly where the Pop-up Stores Dashboard in Power BI becomes a must-have decision-making tool.
This ready-to-use Power BI dashboard provides a centralized, visual, and interactive platform to track the financial, operational, and performance metrics of pop-up stores. By converting raw retail data into meaningful visuals, the dashboard helps brands evaluate profitability, efficiency, and customer conversion in real time.
What Is a Pop-up Stores Dashboard in Power BI?
A Pop-up Stores Dashboard in Power BI is an interactive analytics solution designed to monitor and analyze the performance of temporary retail stores. Instead of relying on static Excel sheets or manual summaries, this dashboard presents key metrics through dynamic cards, charts, and slicers.
Using Power BI Desktop, businesses can track:
Cost, Sales, and Profit
Conversion Rate
Store Duration
Staff Utilization
Performance by City, Category, and Promotion Type
Most importantly, the dashboard helps brands measure whether pop-up stores deliver the expected return on investment (ROI).
Why Do Businesses Need a Pop-up Stores Dashboard?
Pop-up stores operate under tight timelines and limited budgets. Therefore, delayed reporting or poor visibility can quickly lead to losses.
The Pop-up Stores Dashboard in Power BI helps because it:
✔ Tracks cost, sales, and profit in real time
✔ Measures conversion and staff efficiency
✔ Compares performance across cities and categories
✔ Evaluates promotion effectiveness
✔ Supports data-driven expansion decisions
As a result, brands gain clarity, control, and confidence when running pop-up retail campaigns.
📊 Key Features of Pop-up Stores Dashboard in Power BI
🚀 Real-Time Performance Visibility
Instant insights into cost, revenue, profit, and conversion.
🏙️ City-Wise & Category-Wise Analysis
Understand where pop-up stores perform best.
🎯 Promotion Effectiveness Tracking
Measure which promotional strategies drive higher ROI.
📈 Monthly Trend Analysis
Identify seasonality, staffing patterns, and cost behavior.
🧩 Interactive Slicers
Filter data by city, category, promotion type, and time.
💼 Management-Ready Visuals
Professional Power BI design suitable for leadership reviews.
📦 What’s Inside the Pop-up Stores Dashboard in Power BI?
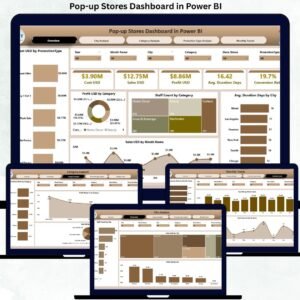
The dashboard includes 5 professionally designed pages; each focused on a specific analytical perspective.
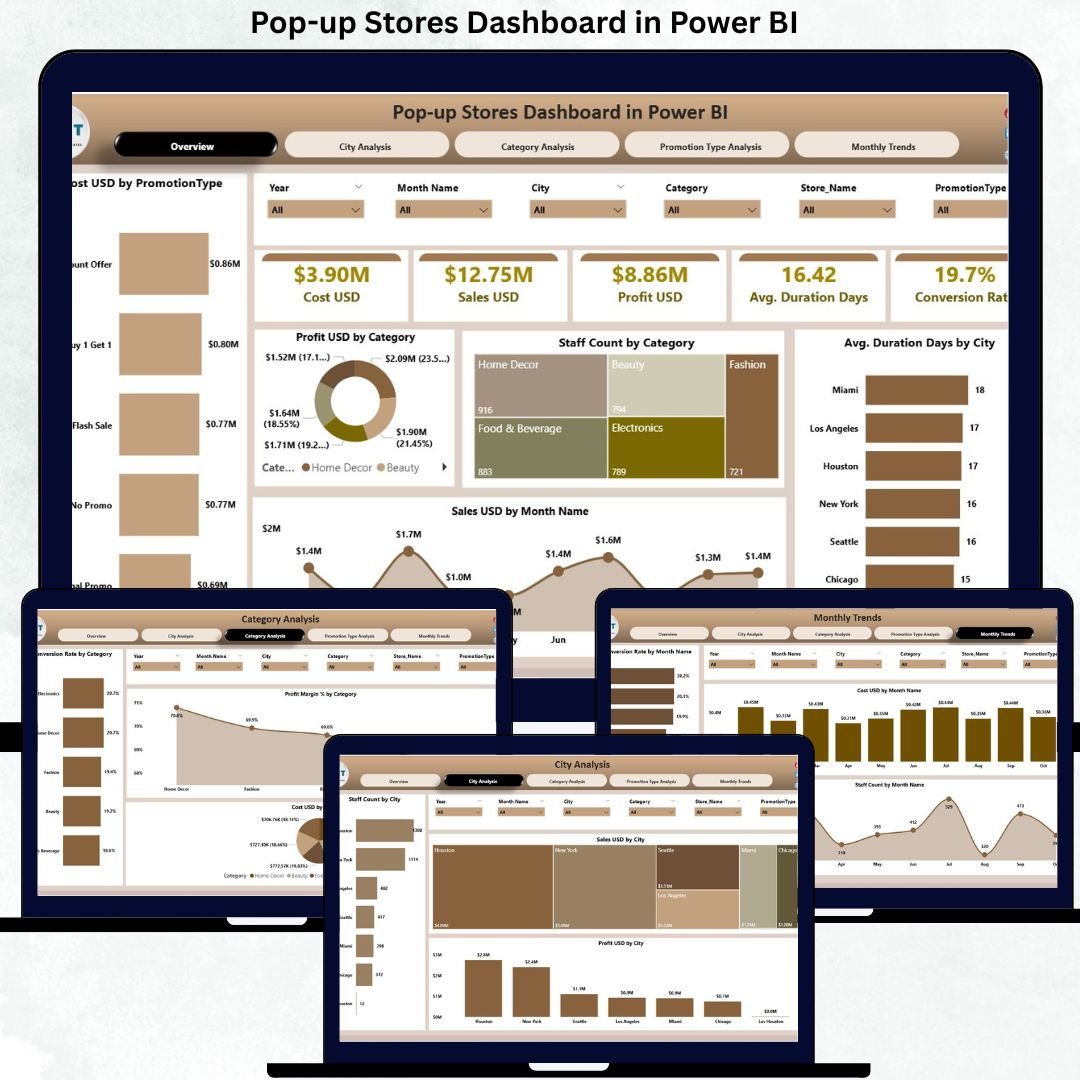
🧭 1. Overview Page – Executive Summary
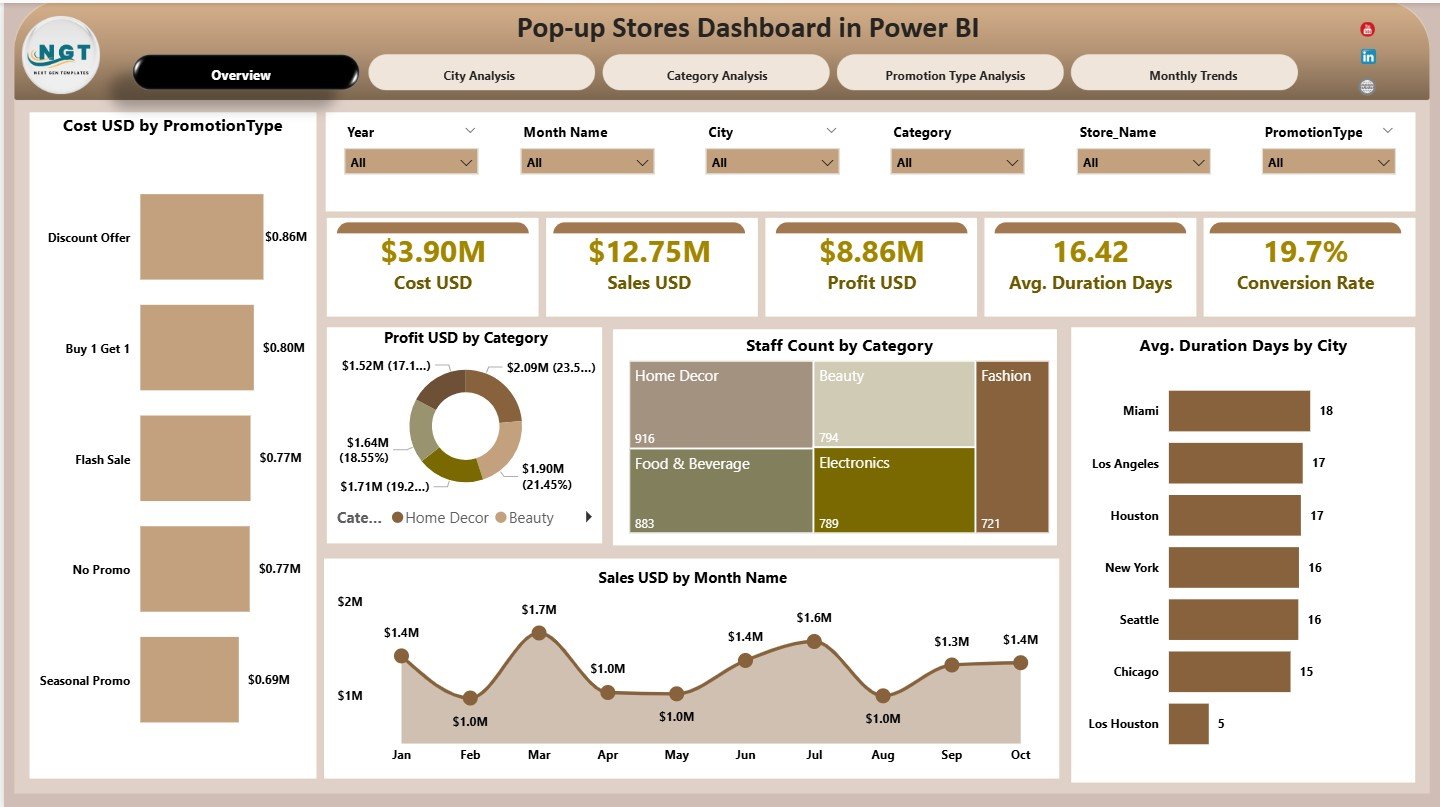
This is the main control center of the dashboard.
KPI Cards Displayed:
💰 Cost USD
💵 Sales USD
📈 Profit USD
⏱️ Average Duration (Days)
🔄 Conversion Rate
Charts on the Overview Page:
Cost USD by Promotion Type
Profit USD by Category
Staff Count by Category
Average Duration (Days) by City
Sales USD by Month
This page provides a quick snapshot of overall pop-up store performance.
🏙️ 2. City Analysis Page – Location Performance
Focuses on city-wise performance insights.
Charts Included:
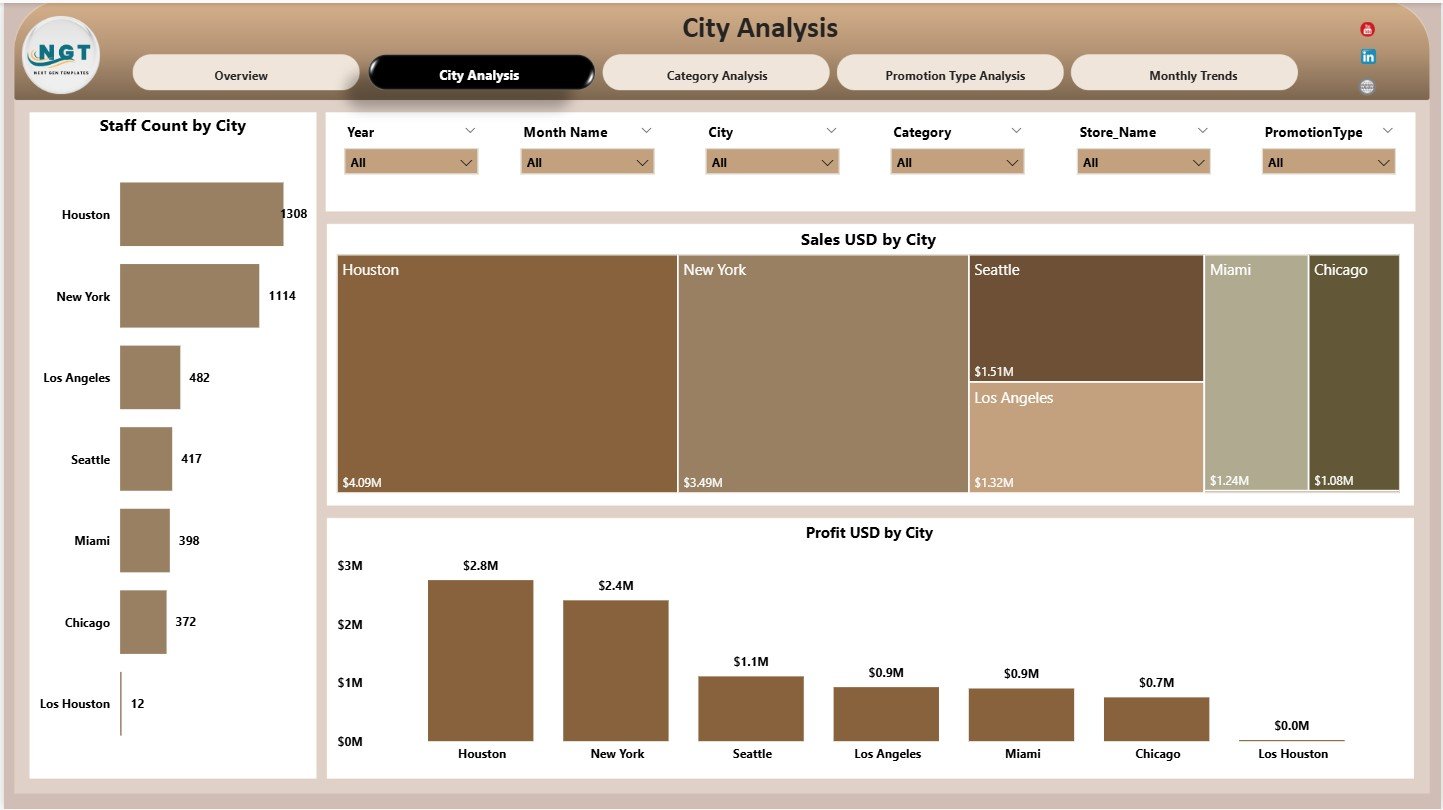
Staff Count by City
Sales USD by City
Profit USD by City
This page helps brands identify high-performing cities and optimize staffing and budgets.
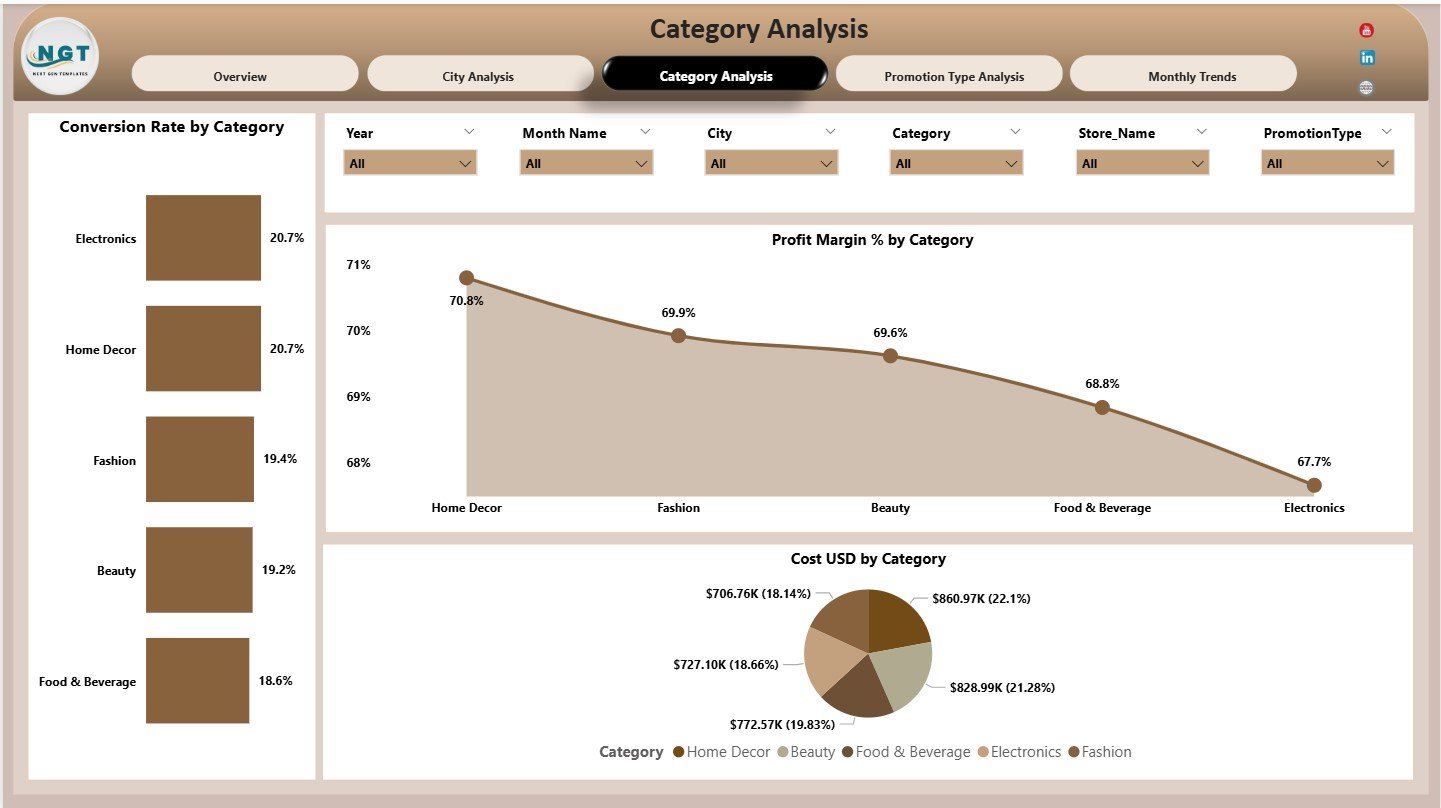
🛒 3. Category Analysis Page – Product Performance
Analyzes performance by product or business category.
Charts Included:
Conversion Rate by Category
Profit Margin % by Category
Cost USD by Category
This analysis helps teams refine product mix and category strategy.
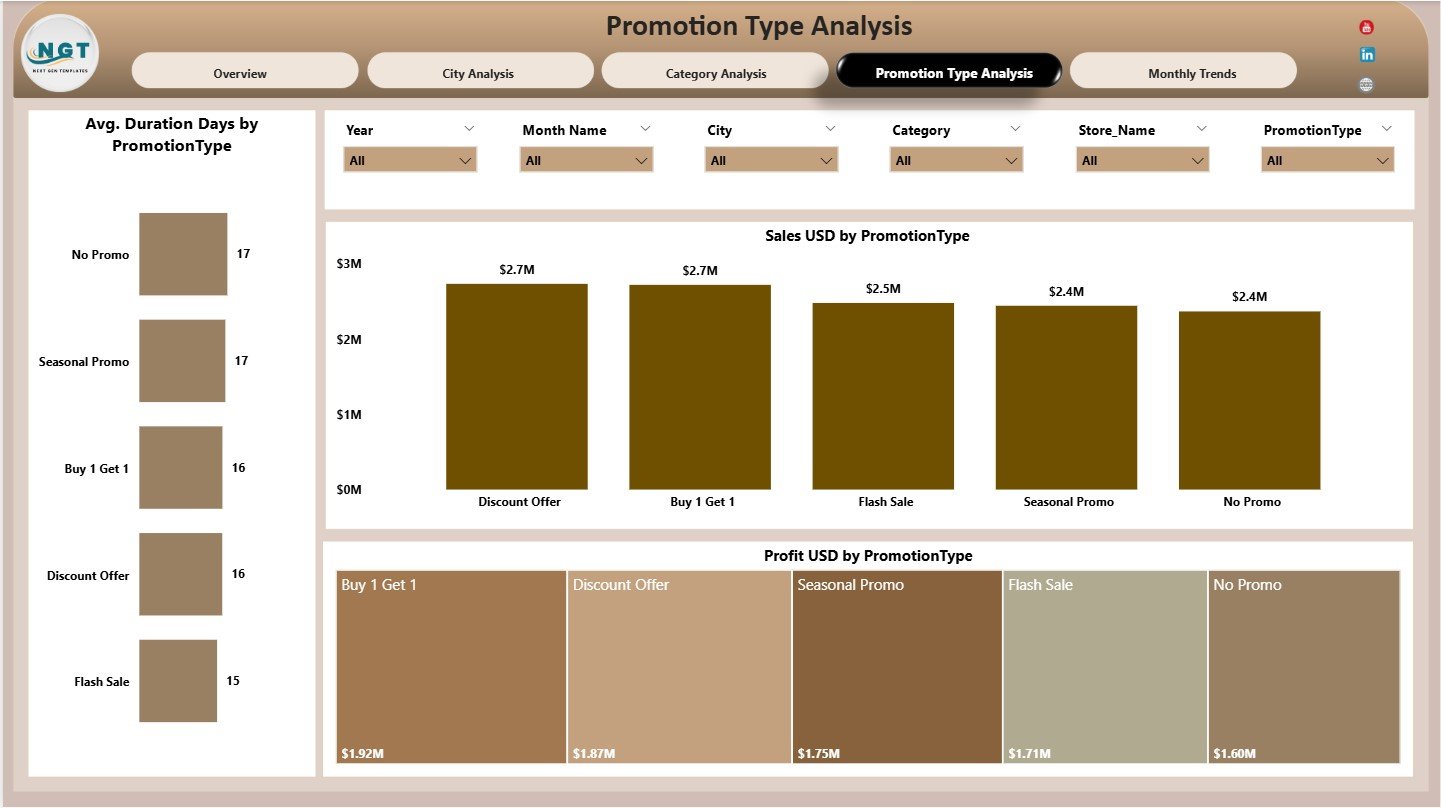
🎯 4. Promotion Type Analysis Page – Campaign Effectiveness
Evaluates different promotional strategies.
Charts Included:
Average Duration (Days) by Promotion Type
Sales USD by Promotion Type
Profit USD by Promotion Type
This page helps brands optimize promotions for maximum impact.
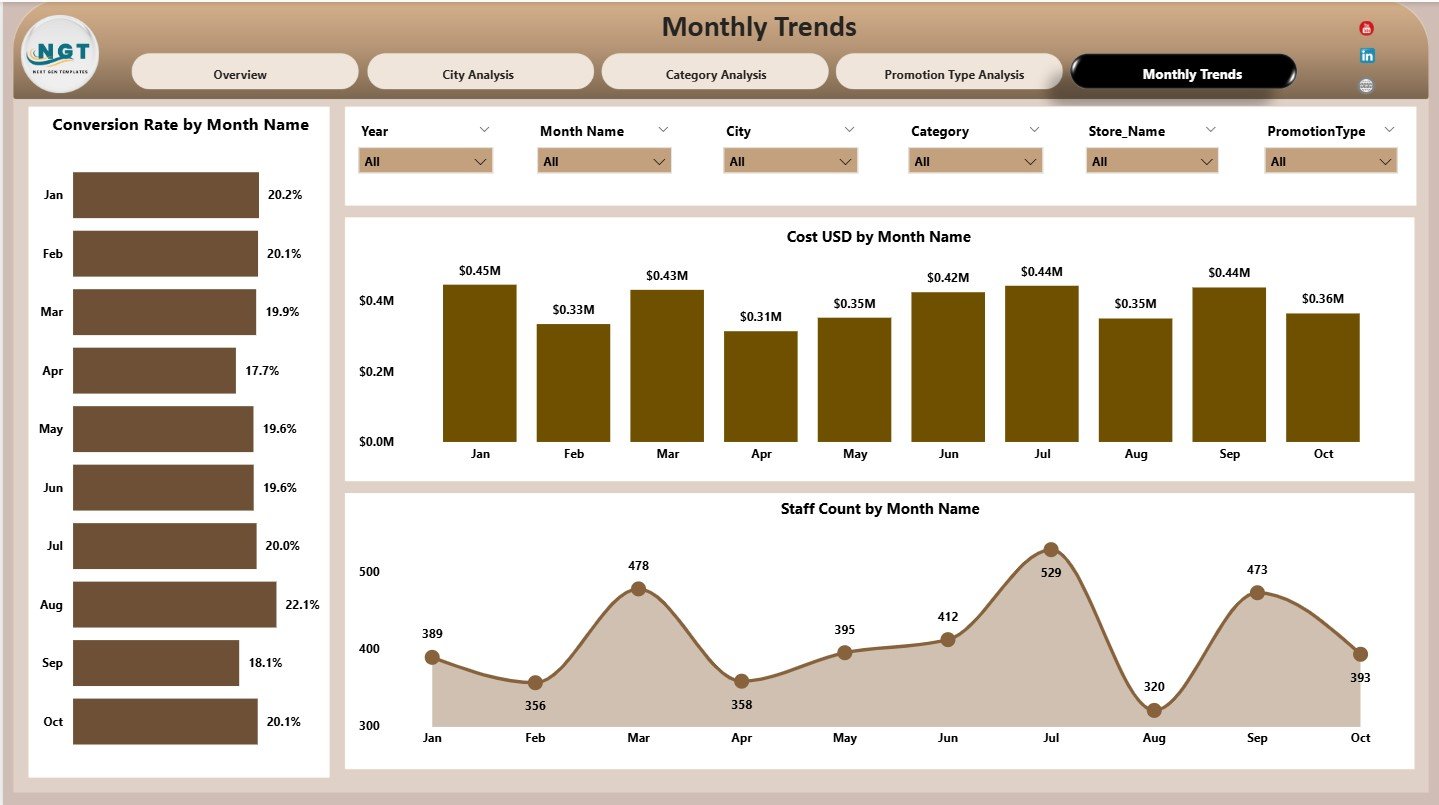
📅 5. Monthly Trends Page – Time-Based Insights
Tracks performance trends over time.
Charts Included:
Conversion Rate by Month
Cost USD by Month
Staff Count by Month
These insights support better planning and forecasting.
👥 Who Can Benefit from This Dashboard?
✔ Retail Managers
✔ Marketing Teams
✔ Brand Managers
✔ Operations Teams
✔ Business Analysts
✔ Senior Leadership
Ideal for both small brands and large retail chains.
🌟 Advantages of Pop-up Stores Dashboard in Power BI
✔ Centralized retail performance tracking
✔ Faster, data-driven decisions
✔ Better cost and profit control
✔ Clear conversion insights
✔ Scalable for multiple cities and campaigns
✔ Professional, presentation-ready visuals
Conclusion
The Pop-up Stores Dashboard in Power BI transforms short-term retail activity into long-term strategic intelligence. By combining financial, operational, and behavioral metrics in one interactive dashboard, brands gain full visibility into what works and what does not.
If you want to maximize ROI, reduce waste, and scale pop-up success confidently, this dashboard becomes an essential retail analytics solution.
📖 Click here to read the Detailed blog post
📺 Visit our YouTube channel to learn step-by-step video tutorials
Watch the step-by-step video tutorial:
Compatibility and Requirements
- Works in Power BI Desktop, which is free to download. Microsoft explains the install in Get Power BI Desktop.
- The dashboard has 5 pages with slicers for city, category, promotion type and time.
Frequently Asked Questions
Which pages are included?
Five pages: Overview, City Analysis, Category Analysis, Promotion Type Analysis and Monthly Trends.
Which KPIs does the Overview page show?
Cost USD, Sales USD, Profit USD, Average Duration (Days) and Conversion Rate.
Can I compare cities and promotion types?
Yes. The City Analysis page shows staff count, sales and profit by city. The Promotion Type Analysis page shows average duration, sales and profit by promotion type.
Can I filter the data?
Yes. Interactive slicers let you filter by city, category, promotion type and time.
Is there an Excel version?
Yes. See the Pop-up Stores Dashboard in Excel.
Related Retail Dashboards
- Pop-up Stores Dashboard in Excel: the same pop-up store analysis in Excel
- Shopify Store Dashboard in Power BI: sales tracking for an online store
- Store Operations KPI Dashboard in Power BI: store KPIs in Power BI
- DIY Home Improvement Stores Dashboard in Power BI: another store type in Power BI
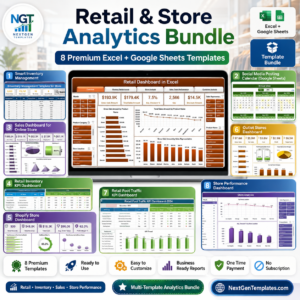
- Retail & Store Analytics Bundle: 8 retail templates in one download
Browse all Power BI dashboards.



















Reviews
There are no reviews yet.