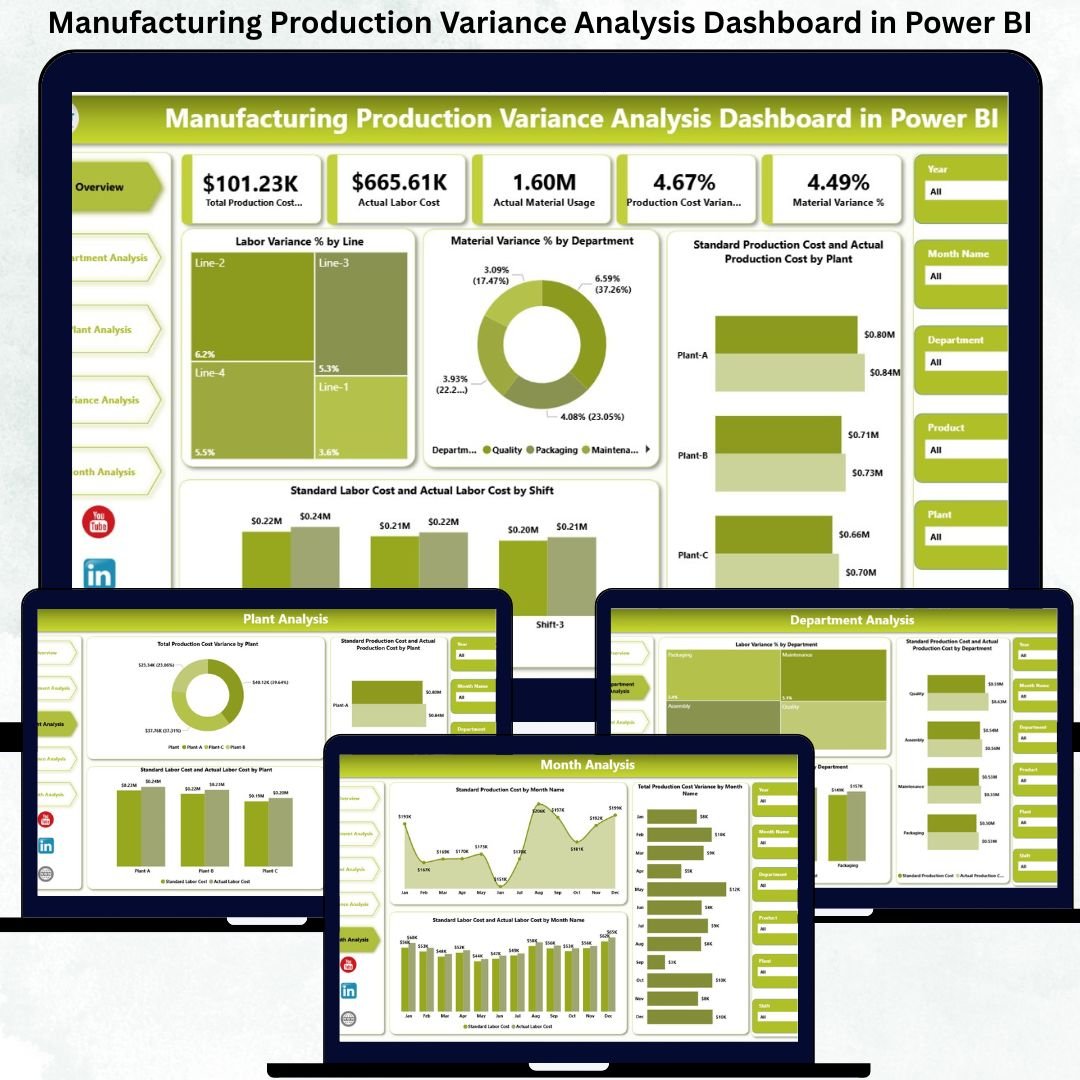
Manufacturing companies lose millions every year due to cost overruns, hidden inefficiencies, and slow reporting systems. Even small deviations in labor hours, material usage, or production costs can severely impact profitability. Traditional Excel reports only make the problem worse—they require manual calculations, hide trends, and delay critical decisions. This is why every modern factory needs a Manufacturing Production Variance Analysis Dashboard in Power BI.
This ready-to-use dashboard transforms raw production data into clear visuals, interactive filters, variance indicators, and powerful trend insights. It helps manufacturers track labor variance, material variance, and total production cost variance at every level—plant, department, production line, and shift. With real-time insights and automated visuals, teams take corrective action faster and improve overall efficiency.
⚡ Key Features of Manufacturing Production Variance Analysis Dashboard in Power BI
This dashboard includes five analytical pages designed to help users spot cost issues instantly, understand root causes, and improve production accuracy.
📊 Overview Page – Your High-Level Cost Visibility
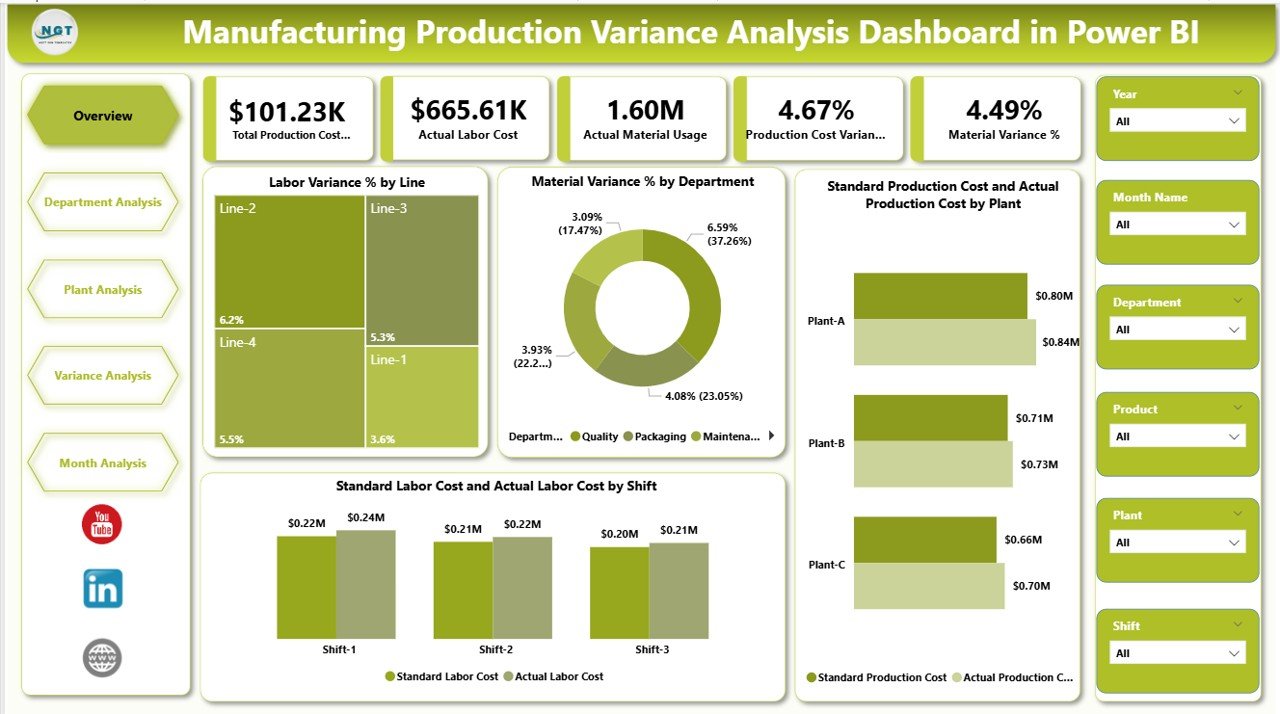
The Overview Page presents all main KPIs and performance indicators on a single screen.
Key elements include:
-
🎛 Top Slicers for Month, Plant & Department
-
🧮 KPI Cards showing overall variance, labor efficiency, cost deviations & high-level performance
-
📉 Labor Variance % by Line – identifies lines with high cost deviations
-
🏭 Material Variance % by Department – highlights material waste areas
-
⚙️ Standard vs Actual Production Cost by Plant – evaluates cost control across plants
-
👷 Standard vs Actual Labor Cost by Shift – shows shifts with higher labor costs
This page delivers immediate clarity for leadership meetings and daily reviews.
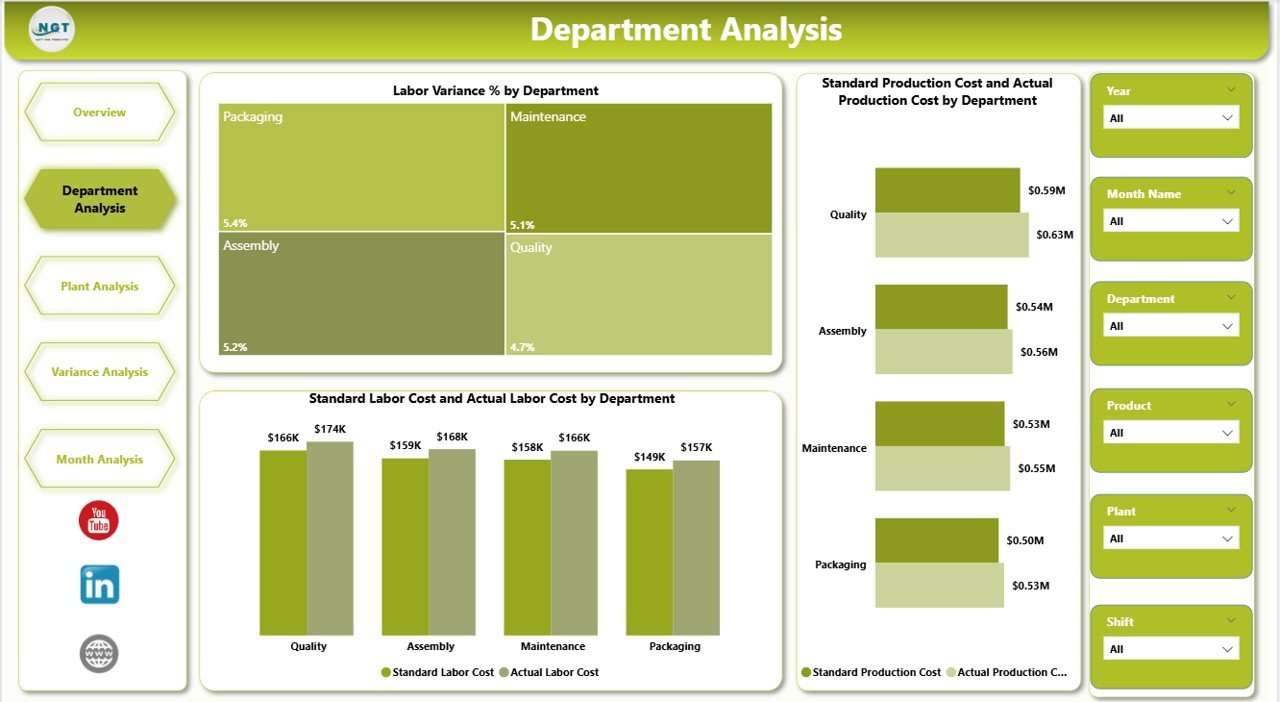
🏭 Department Analysis Page – Improve Department-Level Efficiency
Department managers need deep insights to reduce cost overruns.
This page includes:
-
👥 Labor Variance % by Department
-
💰 Standard vs Actual Production Cost by Department
-
👷 Standard vs Actual Labor Cost by Department
It helps identify departments performing well and those requiring corrective measures.
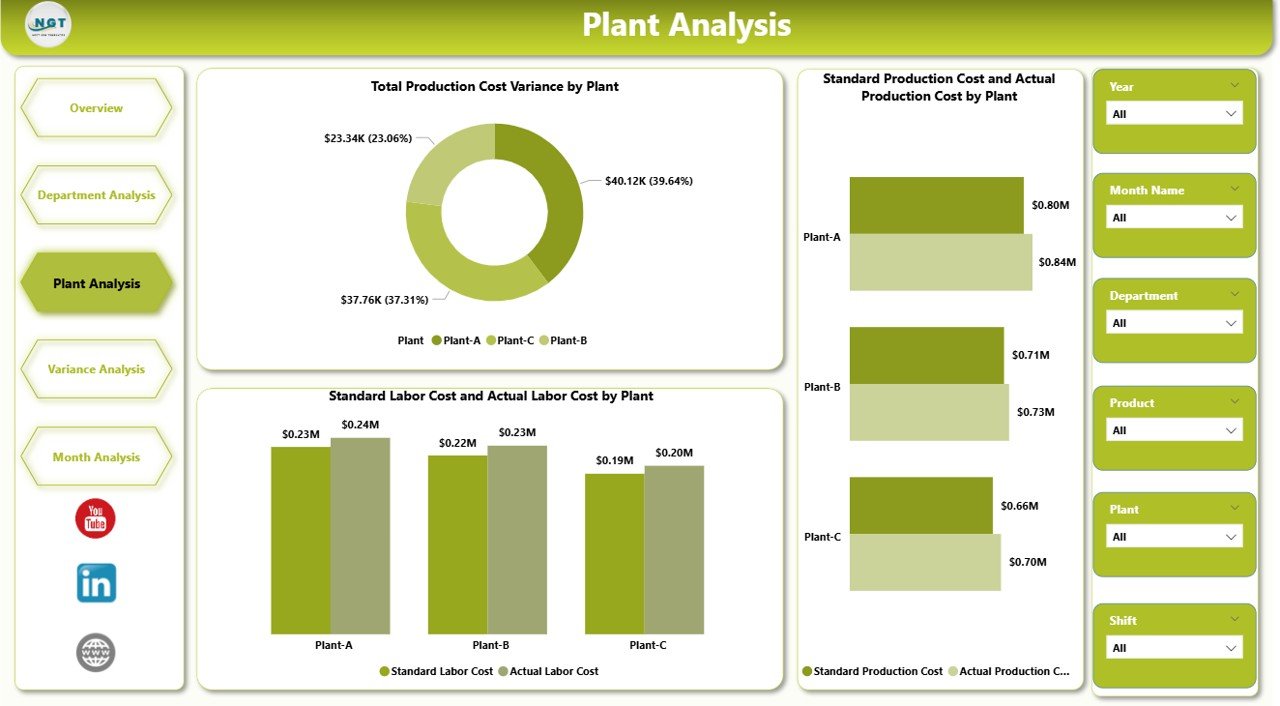
🏢 Plant Analysis Page – Compare Multi-Plant Cost Performance
Manufacturers with multiple plants can benchmark cost performance quickly.
This page displays:
-
📊 Total Production Cost Variance by Plant
-
⚙️ Standard vs Actual Production Cost by Plant
-
👨🏭 Standard vs Actual Labor Cost by Plant
This enables management to identify high-performing plants and support underperforming ones.
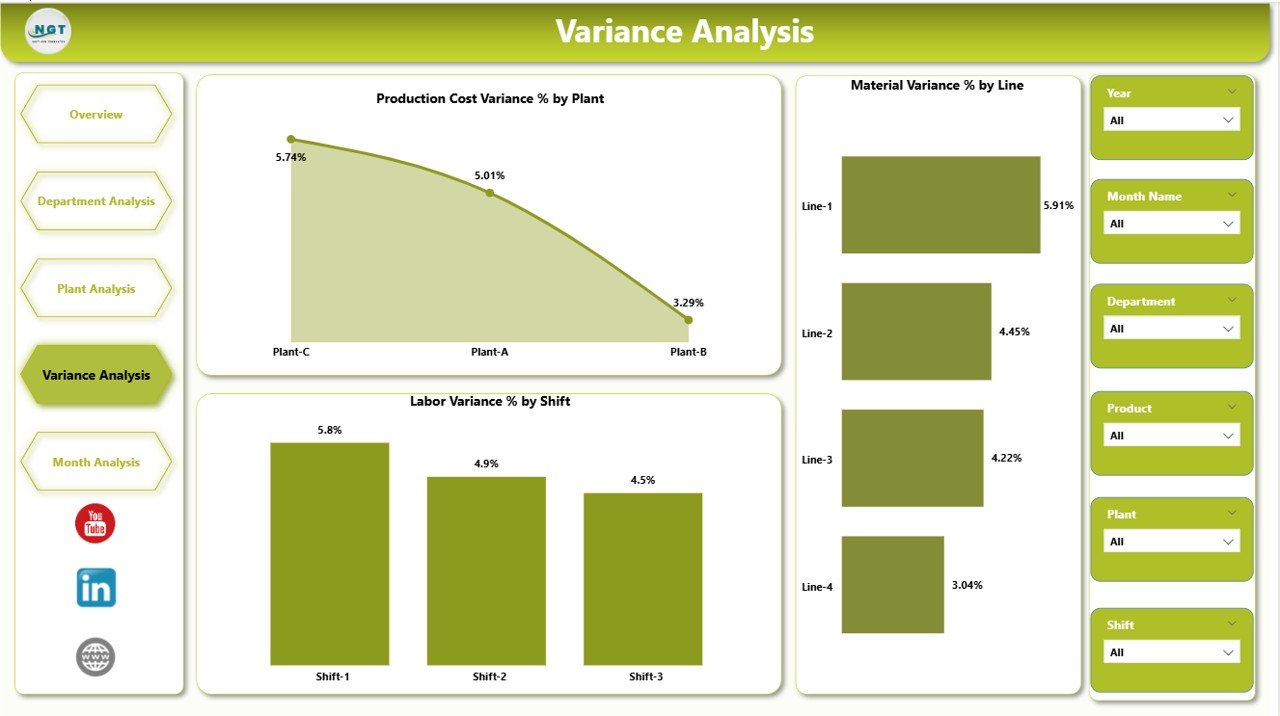
⚠️ Variance Analysis Page – Root Cause Identification
This page is dedicated to understanding variances deeply.
It includes:
-
📈 Production Cost Variance % by Plant
-
🧵 Material Variance % by Line
-
👷 Labor Variance % by Shift
This helps companies take fast, targeted actions to eliminate recurring cost issues.
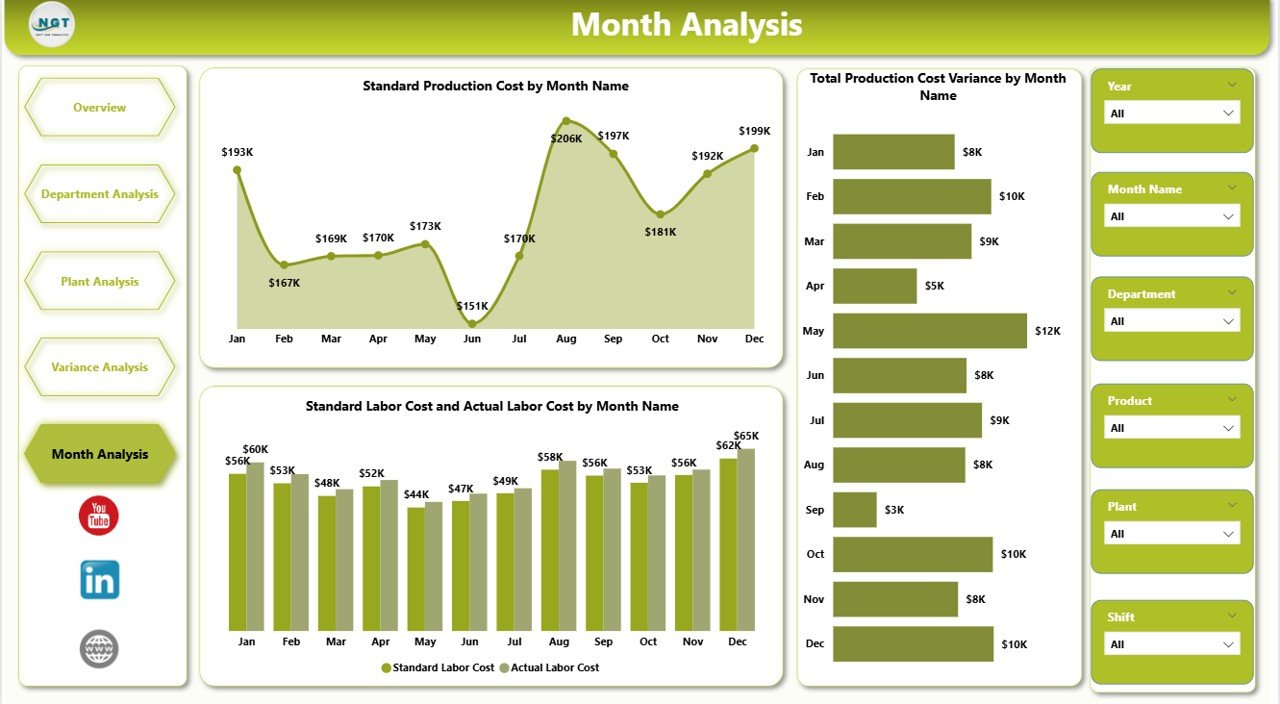
📅 Monthly Trends Page – Monitor Cost Control Over Time
Trends reveal the stability of a manufacturing process.
This page shows:
-
📉 Total Production Cost Variance by Month
-
💵 Standard Production Cost by Month
-
👷 Standard vs Actual Labor Cost by Month
With these trends, leaders forecast budgets accurately and understand seasonal variations in cost performance.
📦 What’s Inside the Manufacturing Variance Dashboard
You receive:
-
📁 Fully interactive Power BI (.pbix) file
-
📊 Excel data source with standard cost, actual cost & variance fields
-
🎛 Slicers for plant, month, department, line & shift
-
📈 KPI cards, trend charts & variance visuals
-
⚡ Automated calculations (no manual formulas needed)
-
🔍 A clean, professional layout ideal for management reviews
Everything is built to save time and deliver clarity.
🧭 How to Use the Manufacturing Variance Dashboard
1️⃣ Update standard and actual production data in Excel
2️⃣ Refresh Power BI
3️⃣ Apply slicers to analyze variance at any level
4️⃣ Review Overview, Department, Plant, Variance & Trends pages
5️⃣ Use insights to reduce cost deviations and improve productivity
Anyone with basic Excel knowledge can maintain this dashboard.
👥 Who Can Benefit from This Dashboard?
This dashboard is ideal for:
-
🏭 Plant Managers
-
📊 Production & Operations Teams
-
👷 Shift Supervisors
-
💼 Finance & Cost Control Teams
-
🧪 Industrial Engineers
-
🏢 Senior Management
If your focus is cost control, operational efficiency, and profitability—this dashboard is a must-have.
### Click here to read the Detailed blog post
Visit our YouTube channel to learn step-by-step video tutorials
👉 Youtube.com/@PKAnExcelExpert


Reviews
There are no reviews yet.