The packaging industry moves fast. Every minute counts, every material variation matters, and every delay impacts customer commitments. Production teams must monitor output, energy consumption, delivery timelines, defect types, and shift performance with precision. However, when these KPIs are tracked manually, managers waste hours preparing reports—and lose visibility into critical trends. The Packaging Industry Dashboard in Power BI solves these challenges by converting raw operational data into clear insights that help teams act faster and make smarter decisions.
This ready-to-use dashboard brings real-time clarity to production, quality, material behavior, and delivery performance. Instead of searching through spreadsheets, users see KPIs in one clean, interactive view. With dynamic slicers, automated calculations, and well-structured visuals, this dashboard becomes the single source of truth for packaging units.
⚡ Key Features of Packaging Industry Dashboard in Power BI
This dashboard is designed to give packaging units complete operational visibility across production lines, product categories, materials, and shifts.
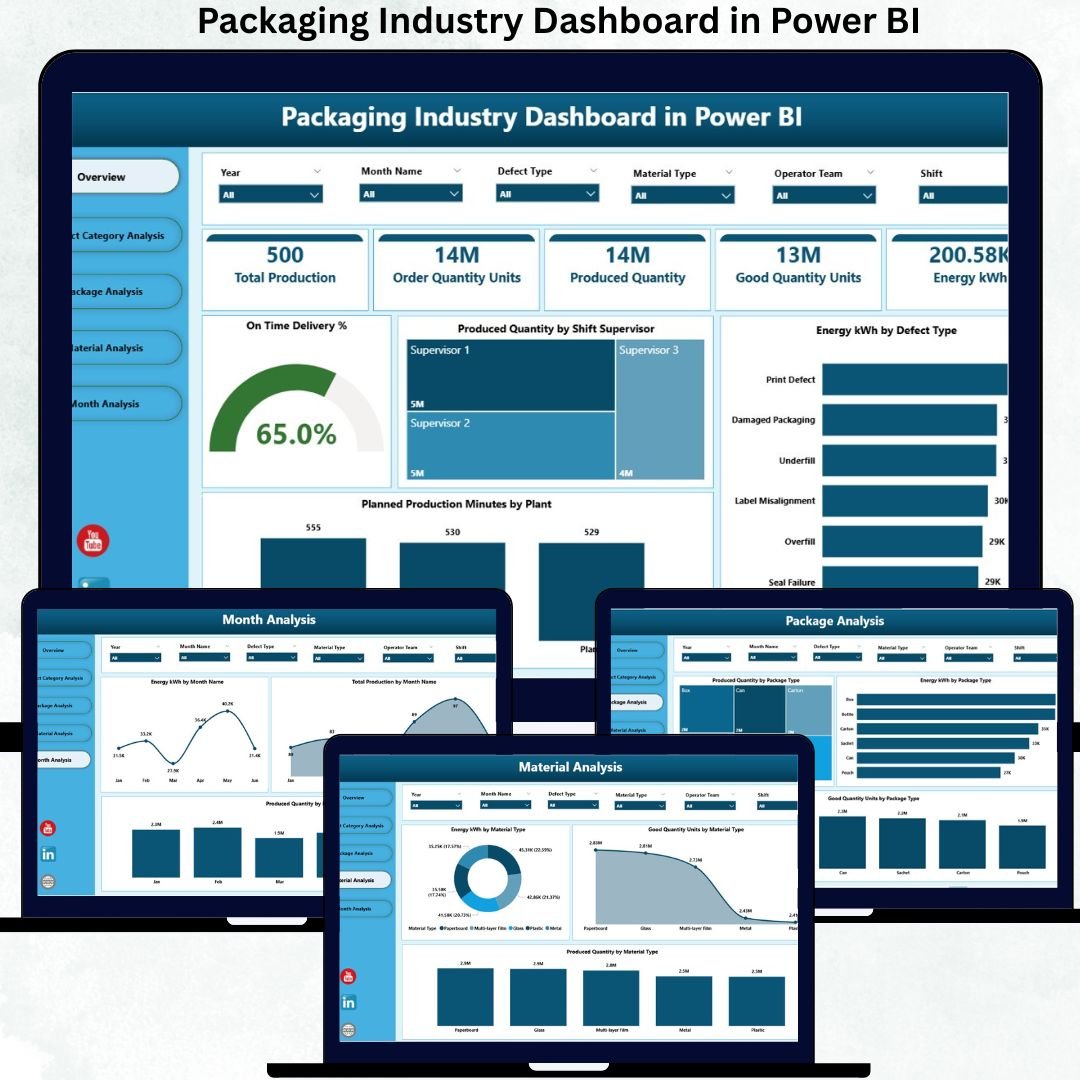
🔥 Smart Overview Page
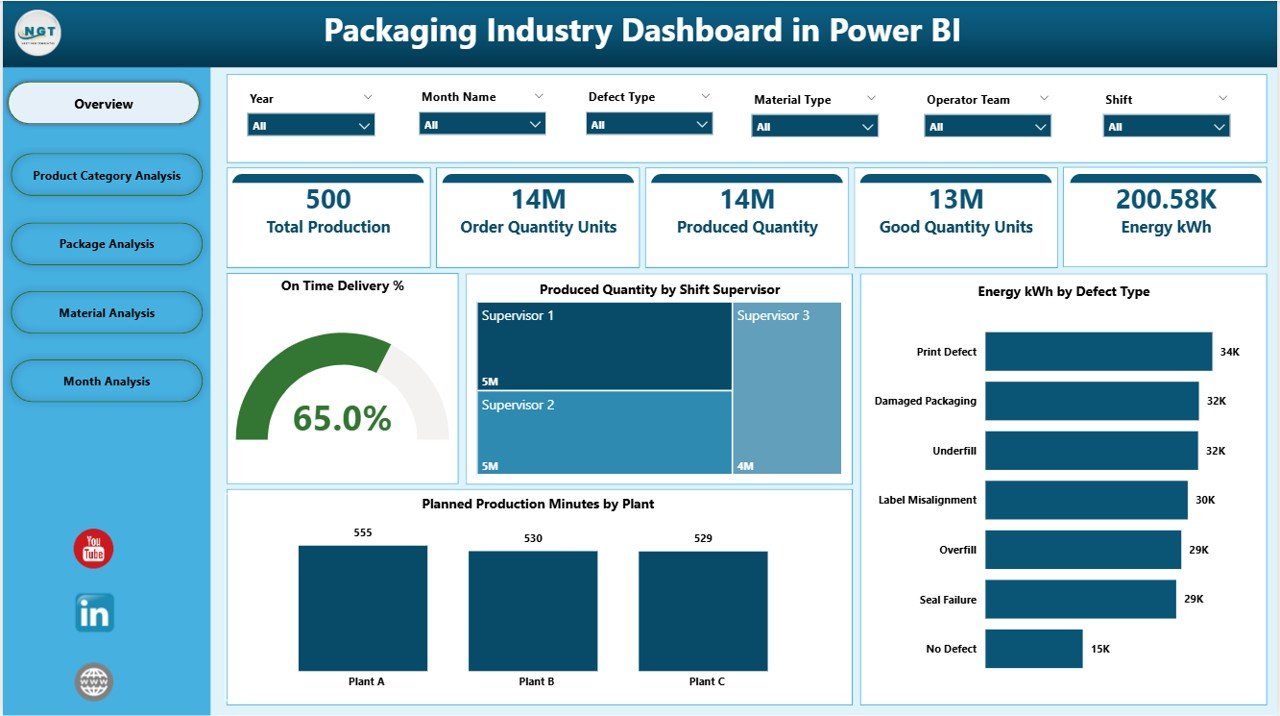
The Overview Page works as the main control center where leadership gets instant answers.
-
📊 KPI Cards for On-Time Delivery %, Production Quantity, Energy Consumption & Planned Production Minutes
-
👨🏭 Production by Shift Supervisor to identify top-performing shifts
-
⚡ Energy by Defect Type to detect wasteful processes
-
🏭 Production Minutes by Plant for quick plant-level insights
This page helps managers spot issues instantly without navigating deeper dashboards.
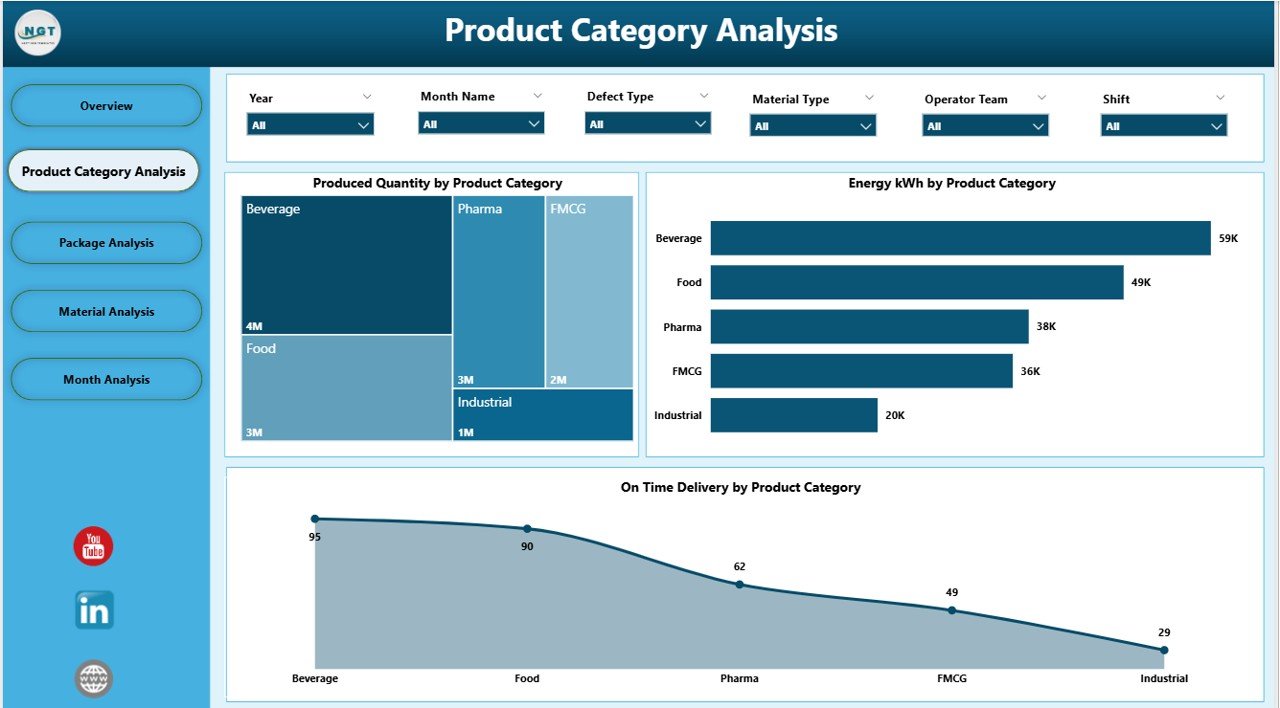
📦 Product Category Analysis
This page compares performance across different product categories.
-
📈 Production Volume by Category
-
⚡ Energy kWh by Category
-
🚚 On-Time Delivery % by Category
Users understand which category drives the highest output, consumes the most energy, or impacts delivery performance.
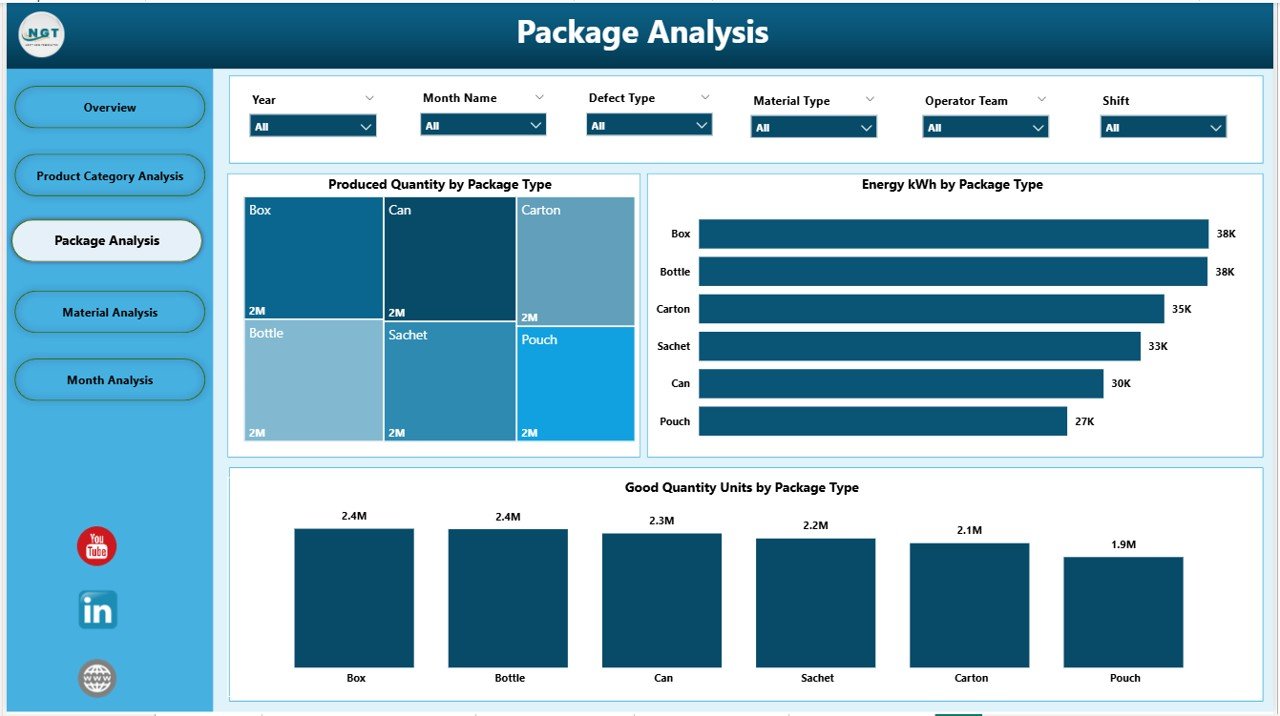
🧴 Package Analysis
Packaging units handle many packaging formats—cartons, bottles, pouches, cans, bags, sleeves, and more.
This page shows:
-
📦 Produced Quantity by Package Type
-
⚡ Energy Consumption by Package Type
-
🟢 Good Quantity Units by Package Type
These visuals help teams evaluate packaging efficiency and quality across all packaging formats.
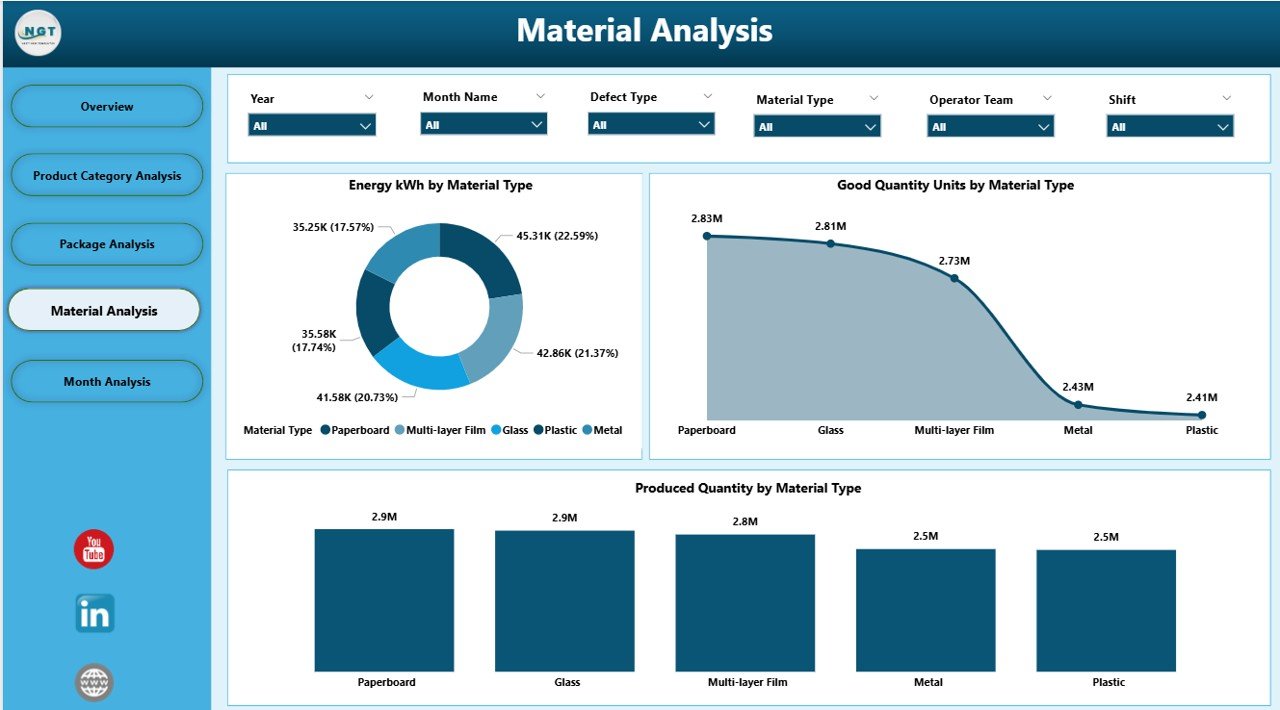
🧪 Material Analysis
Material type affects production performance significantly.
This page includes:
-
🔍 Produced Quantity by Material Type
-
⚡ Energy kWh by Material Type
-
🟢 Good Units by Material Type
Teams use these insights for selecting materials, evaluating suppliers, and improving cost control.
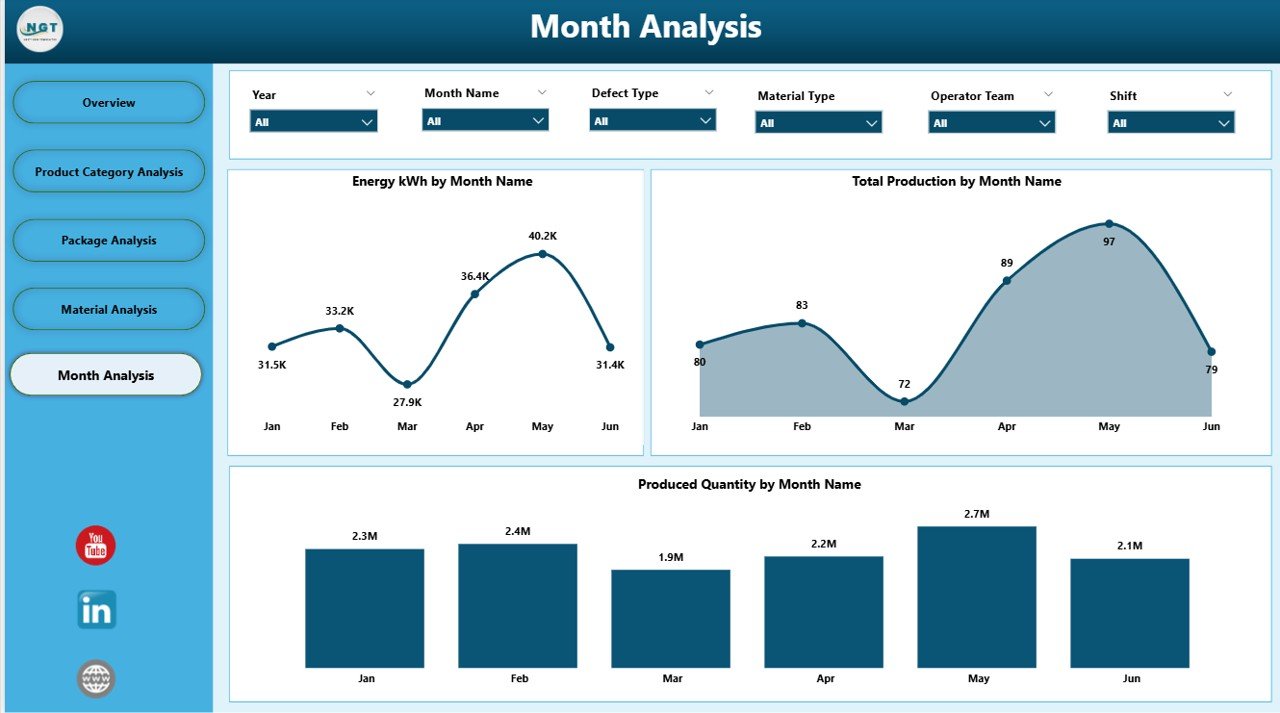
📅 Monthly Trends Page
This page highlights long-term patterns in:
-
📈 Production Volume
-
⚡ Energy Consumption
-
🧰 Total Production Units
Managers detect seasonal changes, identify unusual spikes, and make data-backed forecasts.
📦 What’s Inside the Packaging Industry Dashboard in Power BI
With this download, you receive:
-
📁 Fully automated Power BI Dashboard (.pbix)
-
📊 Clean and structured Excel data source file
-
🎛 Slicers for month, product category, package type, material type, and plant
-
🔧 Prebuilt KPIs for production, quality, delivery, and energy
-
📉 Interactive charts that refresh instantly
-
🚀 A five-page professional dashboard for end-to-end manufacturing visibility
Everything is built to ensure speed, accuracy, and seamless reporting.
🧭 How to Use the Packaging Industry Dashboard in Power BI
1️⃣ Enter or paste your production, energy, category, and material data into the Excel file
2️⃣ Refresh the Power BI dashboard
3️⃣ Select your desired month, product category, plant, material, or package type
4️⃣ Review instant insights from the five dashboard pages
5️⃣ Use the visuals to support planning, analysis, and daily decision-making
No coding. No complex setup. Just plug in your data and get real-time answers.
👥 Who Can Benefit from This Dashboard
This dashboard is designed for every packaging environment—small plants to large multi-plant operations.
-
🏭 Plant Managers – Monitor output and efficiency
-
🔧 Production Teams – Track performance in real time
-
📦 Quality Teams – Analyze defects and improve good units
-
⚡ Energy Managers – Reduce energy wastage
-
🎯 Operations Leaders – Compare plants, materials & packaging types
-
🧑💼 Senior Management – Make confident decisions with reliable visuals
If your goal is better quality, lower cost, and higher productivity—this dashboard is a game changer.
### Click here to read the Detailed blog post
Visit our YouTube channel to learn step-by-step video tutorials
👉 Youtube.com/@PKAnExcelExpert


Reviews
There are no reviews yet.