The fisheries industry operates in one of the most unpredictable environments—changing marine conditions, fluctuating fuel prices, seasonal patterns, and strict regulations. Fleet owners, managers, and government agencies need fast, accurate, and real-time insights to make better decisions. Traditional spreadsheets cannot keep up with these demands.
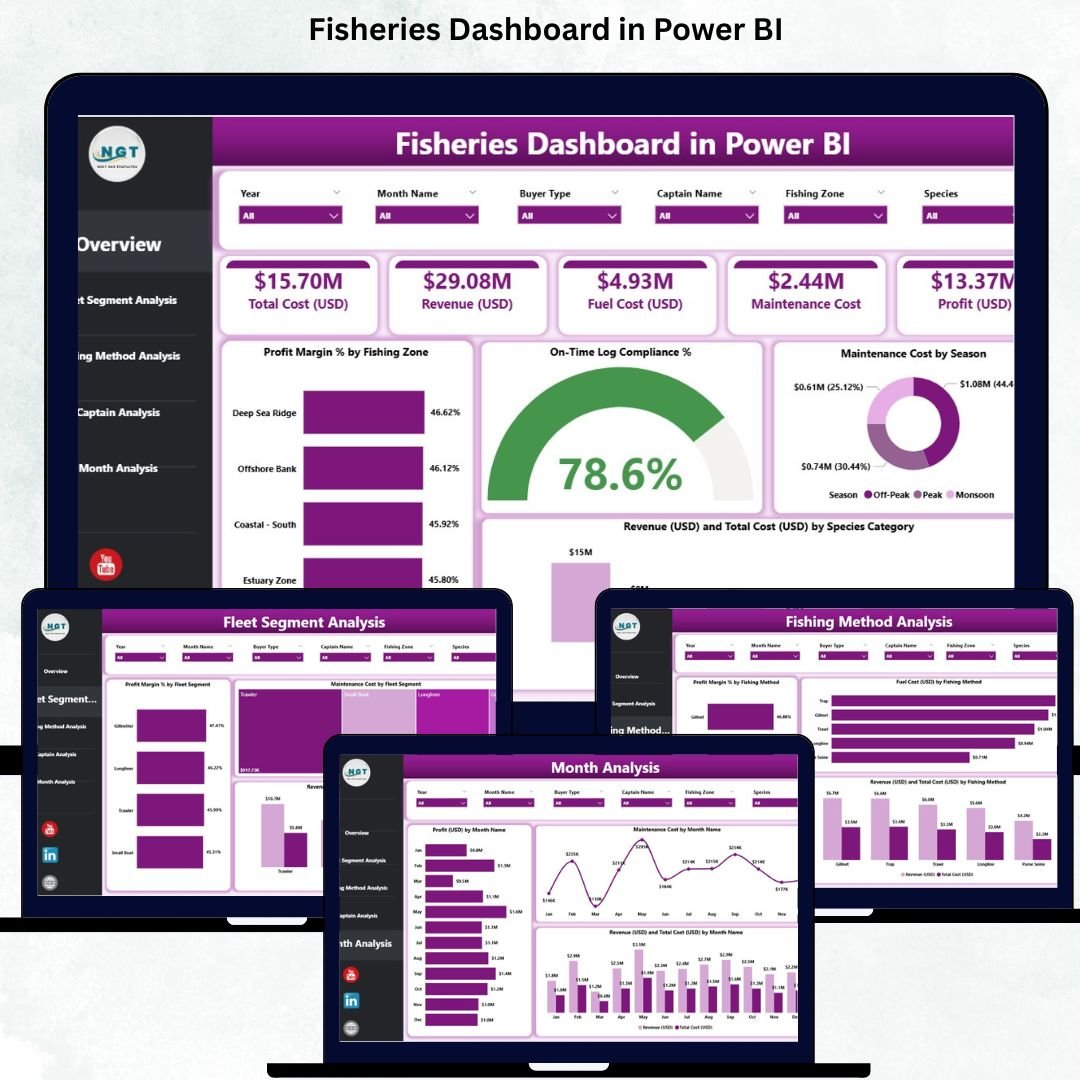
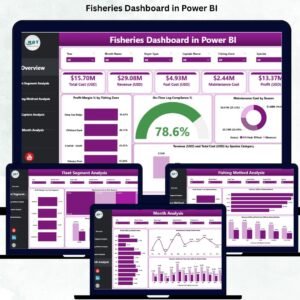
The Fisheries Dashboard in Power BI solves this challenge with a complete, visual, and interactive reporting system. It brings together operational, financial, and compliance data into one smart dashboard so teams understand performance, cost, seasonality, and resource utilization instantly. Whether you monitor fleet segments, captain output, fishing methods, or revenue trends, this dashboard gives you the clarity you need.
This fully-designed Power BI dashboard is ready to use with an Excel backend, making it suitable for organizations of all sizes. Just update your data file and the entire dashboard refreshes automatically—no technical skills required.
✨ Key Features of the Fisheries Dashboard in Power BI
(H2 Heading)
This dashboard includes five powerful analytical pages, each built to simplify fisheries operations and financial decision-making.
🟦 1. Overview Page – Complete Fisheries Summary
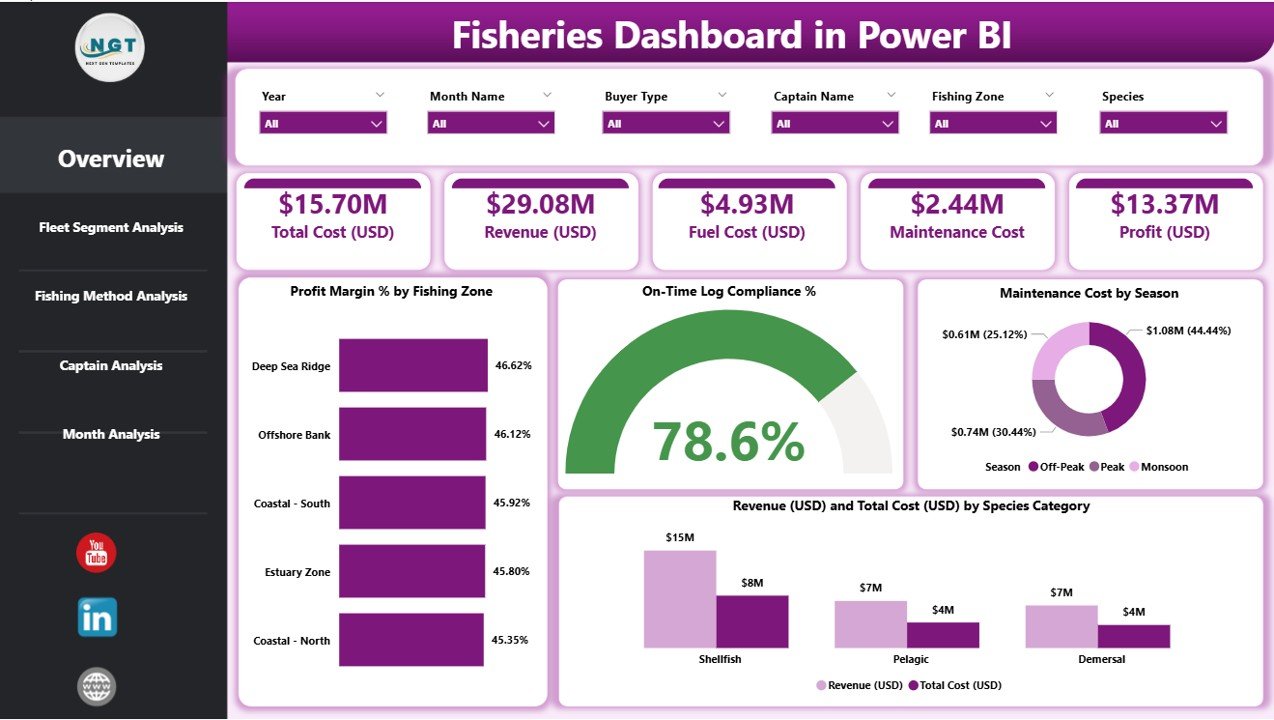
The Overview Page brings together the most important KPIs in one place so decision-makers understand performance at a glance.
It includes:
✔ Dynamic Slicers
Filter by month, fleet segment, fishing zone, method, and species.
✔ KPI Cards
-
Total Profit Margin %
-
On-Time Log Compliance %
-
Total Maintenance Cost
-
Total Revenue
✔ Insightful Charts
-
Profit Margin % by Fishing Zone
-
On-Time Log Compliance %
-
Maintenance Cost by Season
-
Revenue & Total Cost by Species Category
This page gives you instant clarity about fleet health, compliance, and cost behavior.
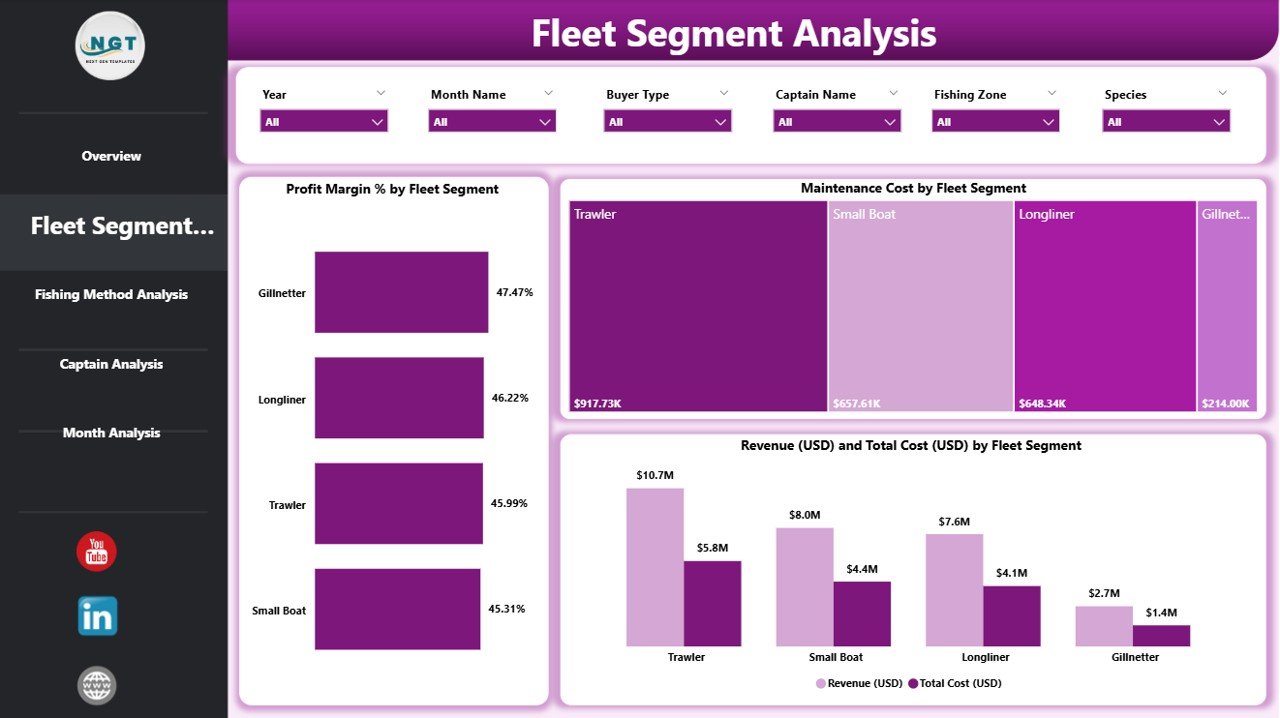
🟦 2. Fleet Segment Analysis – Track Performance by Fleet Category
Different fleet types behave differently. Some require more fuel, some catch high-value species, and some show better profit margins.
This page displays:
-
Profit Margin % by Fleet Segment
-
Maintenance Cost by Fleet Segment
-
Revenue & Total Cost by Fleet Segment
Use this section to identify top-performing fleets and those needing operational improvement.
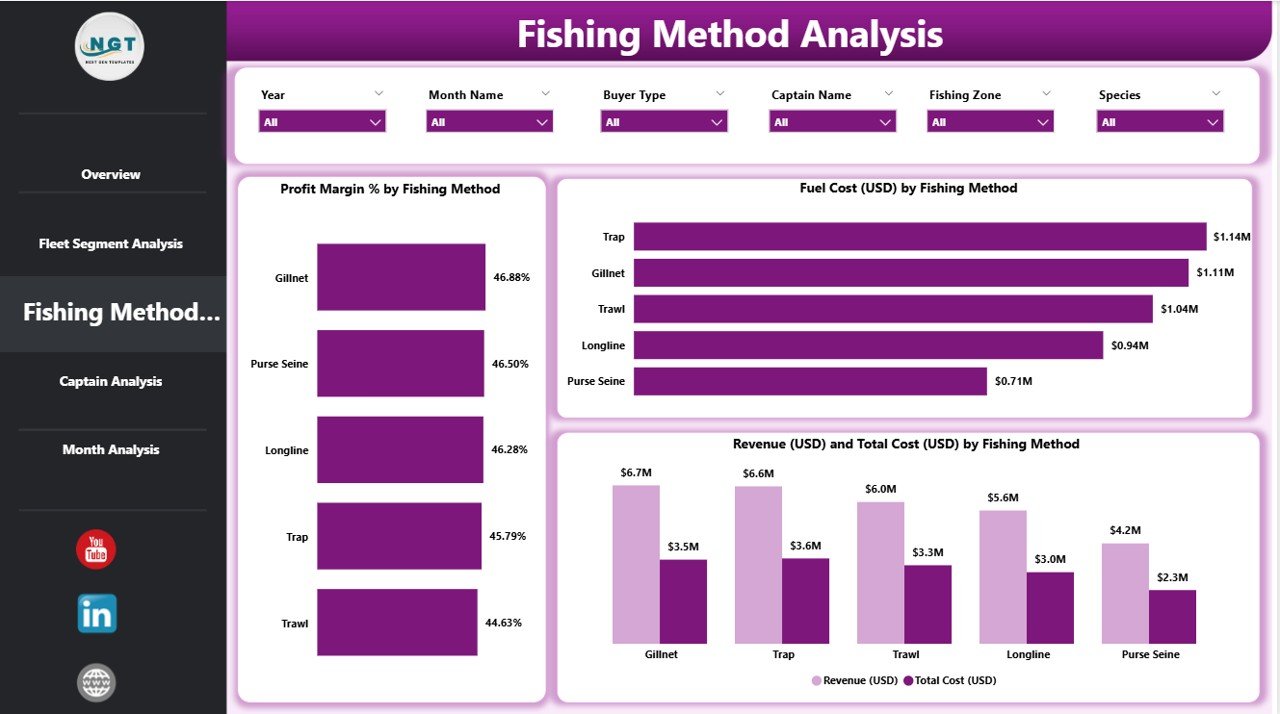
🟦 3. Fishing Method Analysis – Compare Techniques & Efficiency
Fishing methods like longlining, gillnetting, trawling, and purse seining impact fuel usage, cost, and profitability.
This page shows:
-
Profit Margin % by Fishing Method
-
Fuel Cost (USD) by Method
-
Revenue & Total Cost by Method
This helps optimize fishing strategies and choose techniques that produce higher efficiency.
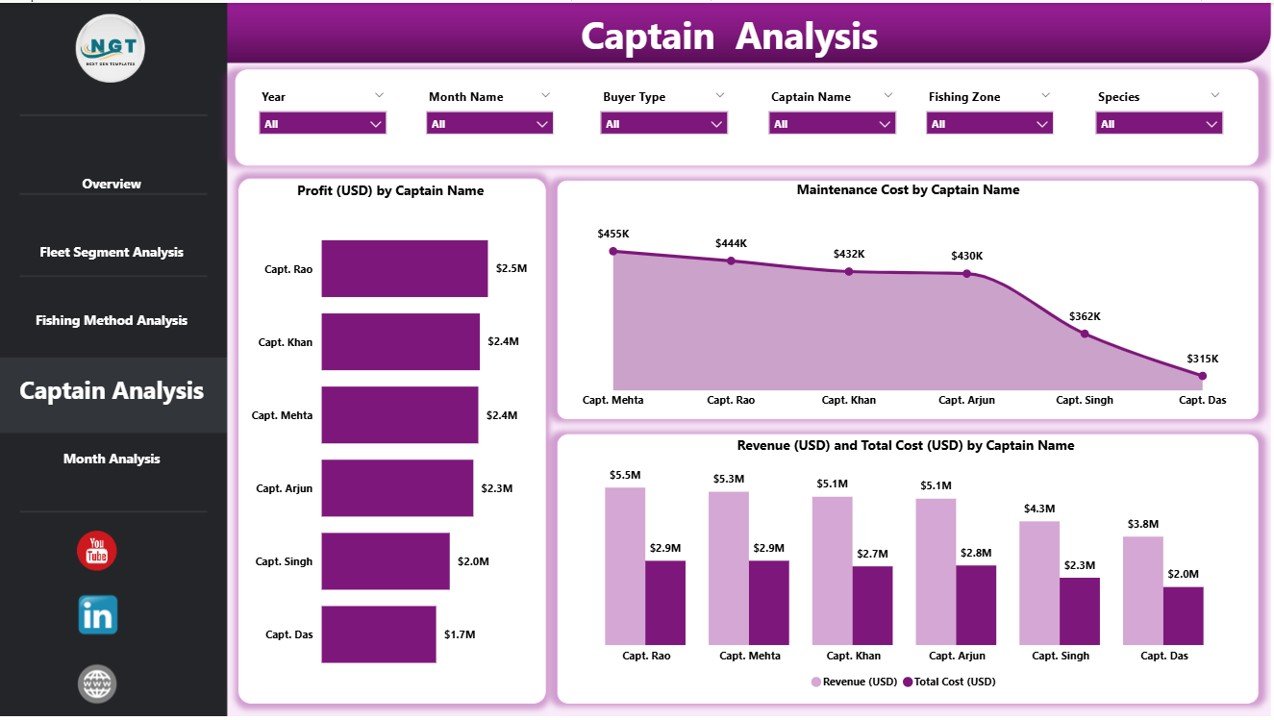
🟦 4. Captain Analysis – Evaluate Crew Leadership & Contribution
Captains drive fleet success through experience, route selection, and operational discipline.
This page highlights:
-
Revenue by Captain
-
Total Cost by Captain
-
Profit Margin % by Captain
This encourages accountability and helps identify training needs or performance gaps.
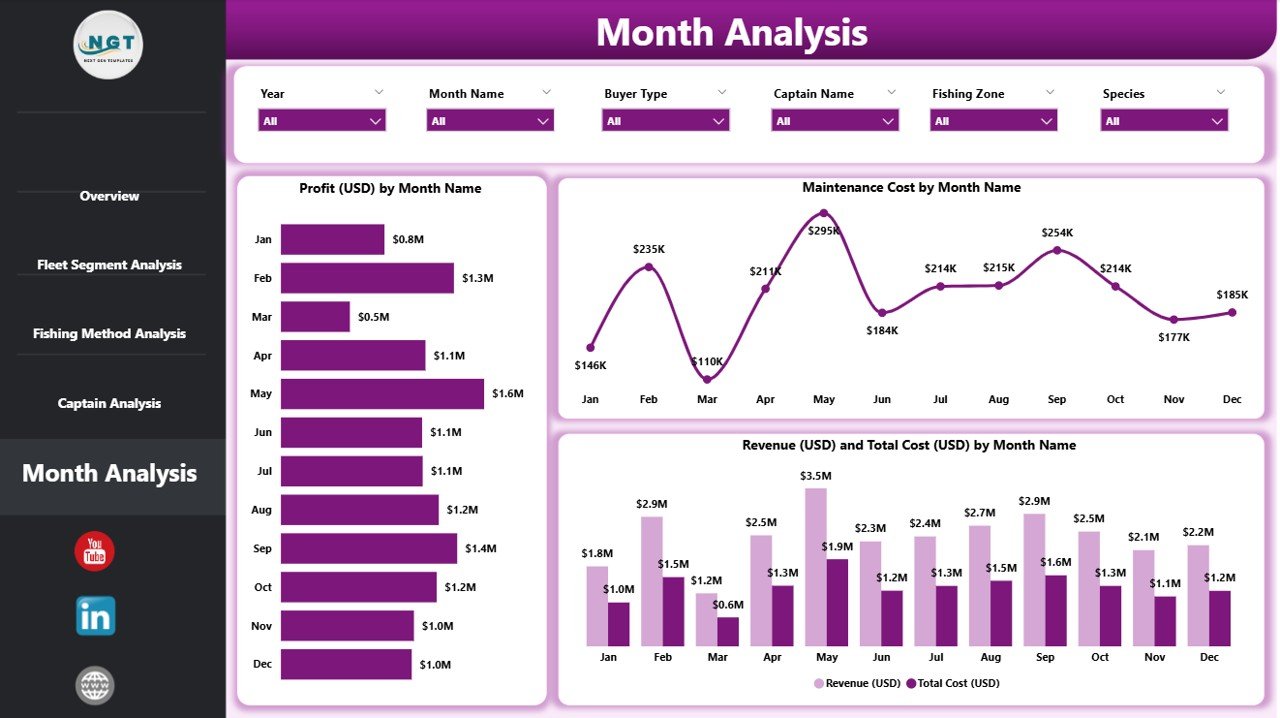
🟦 5. Monthly Trends – Understand Seasonality & Market Behavior
Marine conditions, species availability, and weather impact business monthly.
This page includes:
-
Profit (USD) by Month
-
Maintenance Cost by Month
-
Revenue & Total Cost by Month
These visuals support forecasting, budgeting, maintenance planning, and seasonal preparation.
🛠 How This Dashboard Helps Fisheries Improve Decisions
(H2 Heading)
With this Power BI dashboard, fishing companies can:
-
Detect cost leakages early
-
Improve maintenance scheduling
-
Control fuel consumption
-
Track captain performance
-
Optimize fleet resource allocation
-
Strengthen compliance
-
Increase profit margins using real data
The dashboard turns complex fishing operations into simple, actionable insights.
🌟 Advantages of the Fisheries Dashboard in Power BI
(H2 Heading)
✔ Real-time operational visibility
✔ Improved profitability tracking
✔ Stronger compliance monitoring
✔ Better fleet and method optimization
✔ Clear seasonal insights
✔ Easy-to-understand visuals
✔ Automated reporting with no manual calculation
This dashboard acts as a complete performance management system for the fisheries industry.
📘 What’s Included in Your Download
(H2 Heading)
-
Fully designed Power BI (.pbix) dashboard
-
Editable Excel data file
-
Pre-built slicers, KPIs, and visuals
-
Clear navigation for all five pages
-
Clean data structure for easy updates
Just replace the sample data with your own numbers and start analyzing immediately.
🧭 Who Should Use This Dashboard?
(H2 Heading)
-
Fisheries managers
-
Fleet owners
-
Marine operations teams
-
Government fisheries departments
-
Compliance officers
-
Sustainability teams
-
Financial and planning departments
This template works for organizations of all sizes—from small fleets to large marine enterprises.
▶️ Visit our YouTube channel for step-by-step tutorials
Visit our YouTube channel to learn step-by-step video tutorials
🔗 Click here to read the Detailed blog post


Reviews
There are no reviews yet.