A glass manufacturing plant runs on precision, timing, and accuracy. Every minute, machines melt raw materials, maintain furnace temperature, cool finished products, track energy usage, monitor downtime, and manage scrap output. With production running across multiple shifts, plants, and product types, it becomes extremely challenging to track everything manually. This is exactly where the Glass Manufacturing Dashboard in Excel becomes an essential tool for production managers, supervisors, engineers, and quality teams.
This ready-to-use Excel dashboard converts raw manufacturing data into clean, interactive visuals that update instantly. With powerful slicers, page navigation, and automatically refreshed pivot charts, you get a complete 360° view of production, energy consumption, downtime, and scrap performance. No complex tools, no coding, and no expensive software—just simple, professional analytics inside Excel.
Designed for real-time decision-making, this dashboard helps you identify bottlenecks, track productivity, reduce scrap, and improve your manufacturing efficiency. Whether you manage a single glass plant or multiple locations, this dashboard gives you clarity, control, and confidence in your operations.
🚀 Key Features of the Glass Manufacturing Dashboard in Excel
Below is a complete breakdown of what you will find inside this dashboard.
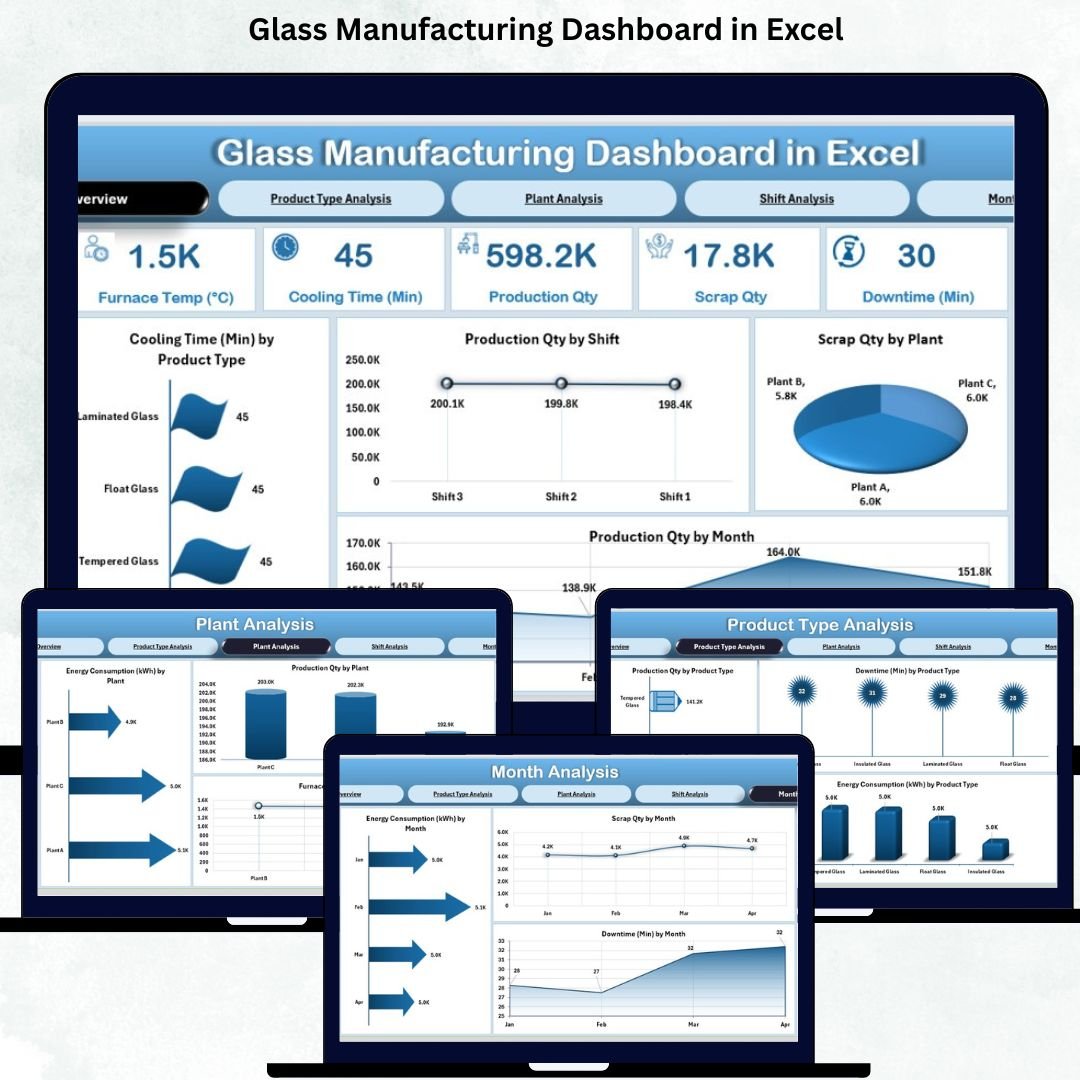
⭐ 1. Overview Page – The Central Control Panel
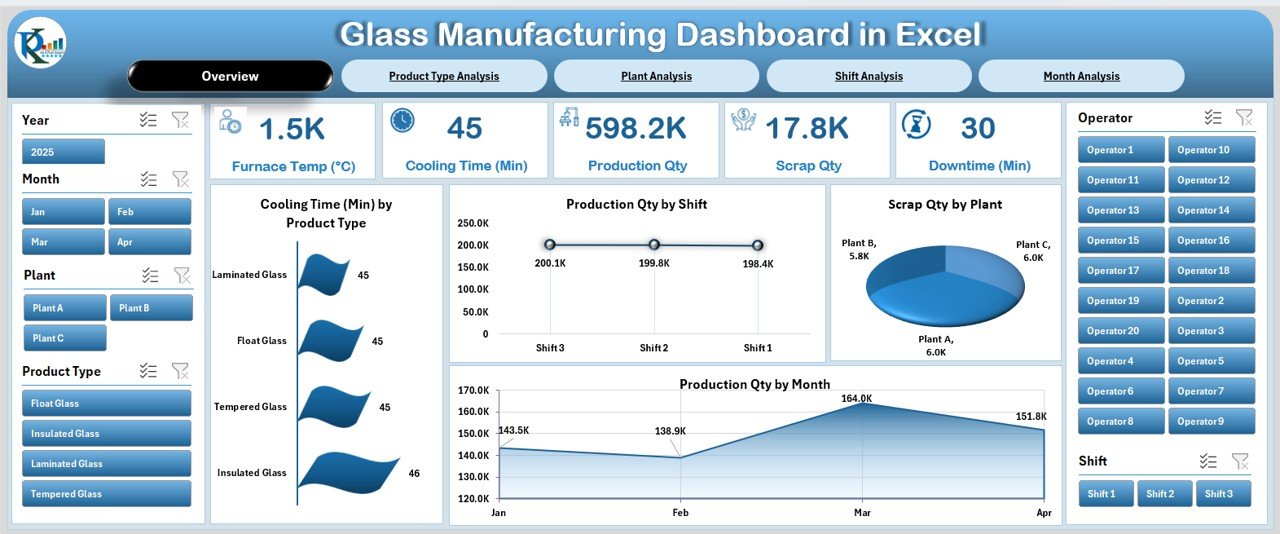
The Overview Page provides a complete summary of plant performance. You also get a right-side slicer panel, allowing you to filter the visuals by month, plant, shift, or product type.
🔹 KPI Cards Include:
-
Total Production Quantity
-
Total Scrap Quantity
-
Total Downtime
-
Total Energy Consumption
-
Average Cooling Time
These cards help you monitor your plant’s overall health within seconds.
🔹 Charts on the Overview Page:
-
Cooling Time by Product Type – Compare cooling behavior across different glass products.
-
Production Qty by Shift – Identify which shifts produce the highest output.
-
Scrap Qty by Plant – Detect plants with high scrap rates and quality issues.
-
Production Qty by Month – Track monthly production patterns and seasonal trends.
This page gives teams instant visibility, making it ideal for daily review meetings.
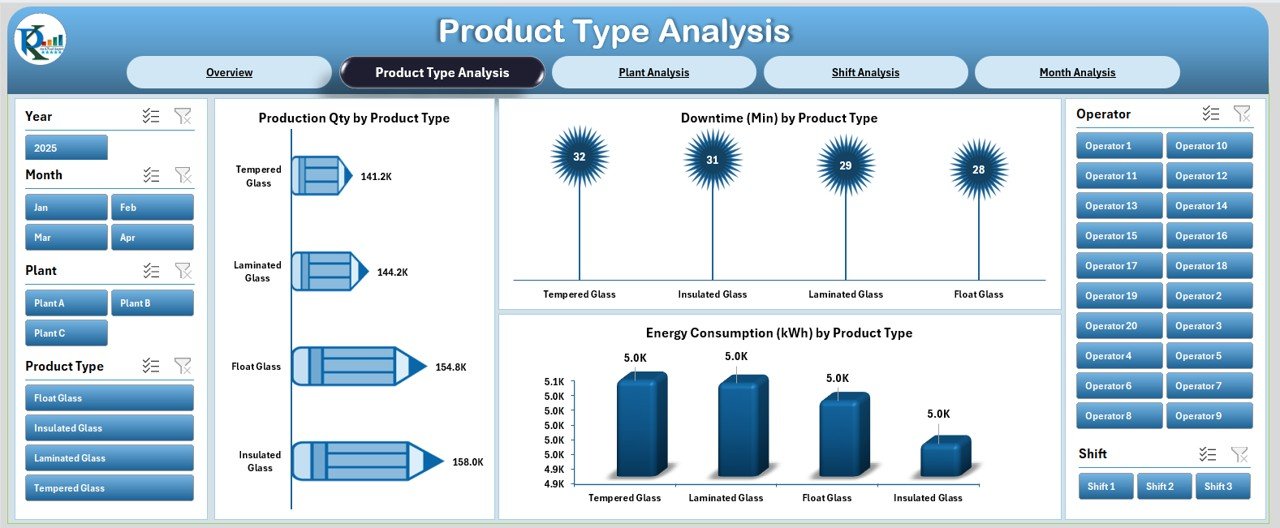
⭐ 2. Product Type Analysis – Understand Product-Level Performance
Different glass products (bottles, sheets, containers, tempered glass, etc.) have unique production patterns and energy requirements. This page highlights how each product type performs.
Right-side slicers help you drill down deeper into any selection.
🔹 Charts on This Page:
-
Production Qty by Product Type – Understand which products drive maximum volume.
-
Downtime by Product Type – Identify products that cause more machine stoppages.
-
Energy Consumption by Product Type – Track power usage to optimize cost efficiency.
This page helps engineering, production, and planning teams understand product-specific performance quickly.
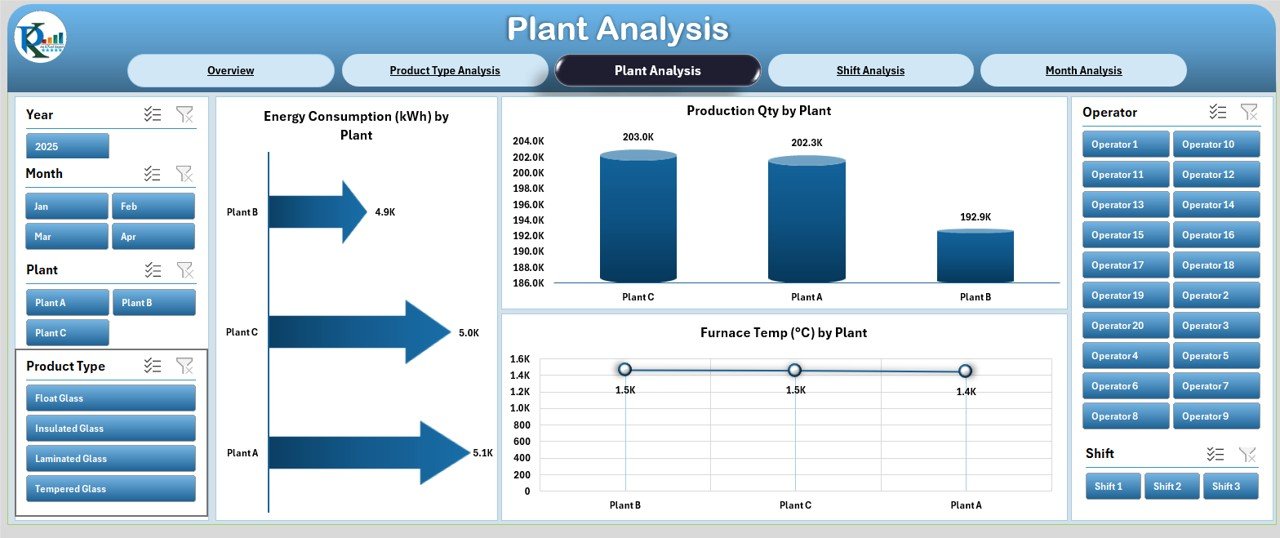
⭐ 3. Plant Analysis – Compare Plants with Clear Visuals
When multiple plants operate simultaneously, comparing their performance becomes crucial. The Plant Analysis Page gives a detailed comparison of all locations.
🔹 Charts on This Page:
-
Production Qty by Plant – Compare manufacturing output plant-wise.
-
Furnace Temperature by Plant – Monitor temperature variations to ensure product consistency.
-
Energy Consumption by Plant – Identify plants with higher power usage.
This page helps you find improvement areas, optimize performance, and control energy costs across all plants.
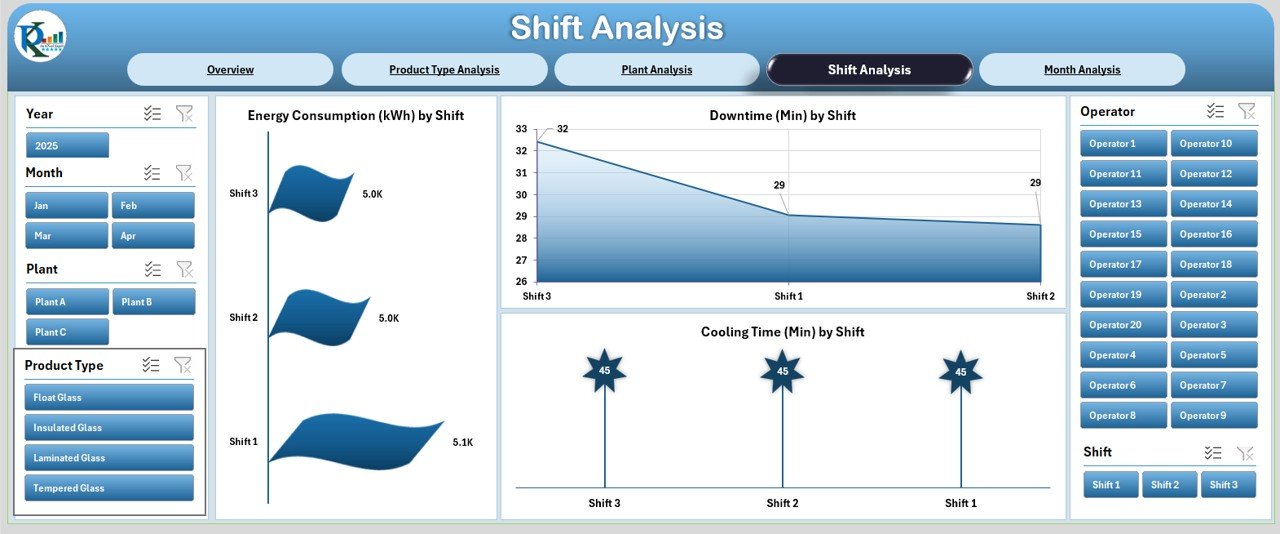
⭐ 4. Shift Analysis – Track Shift-Wise Efficiency
Shifts play a critical role in glass manufacturing because of continuous furnace operations. This page helps you identify which shifts perform better and where delays occur.
🔹 Charts on This Page:
-
Energy Consumption by Shift – Compare energy usage across shifts.
-
Downtime by Shift – Identify shifts facing more stoppages or maintenance issues.
-
Cooling Time by Shift – Understand how shift performance affects product cooling time.
This page becomes a powerful tool for supervisors and HR teams to improve workforce planning and shift scheduling.
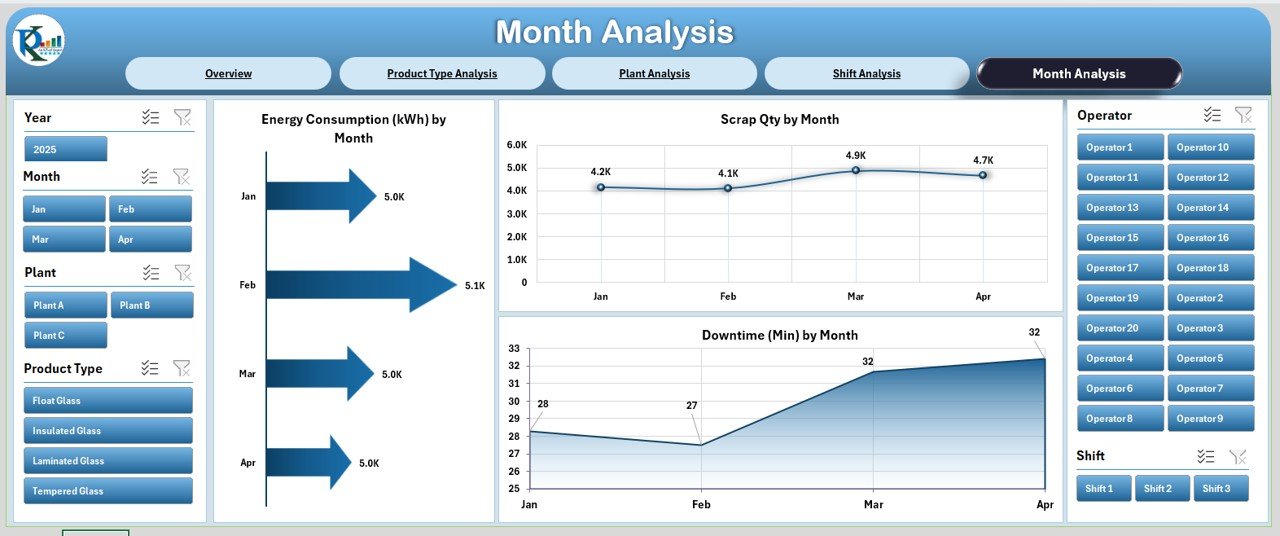
⭐ 5. Month Analysis – Track Long-Term Trends & Patterns
Monthly trends reveal valuable insights about demand cycles, energy behavior, and quality issues. The Month Analysis Page helps you plan future production strategies with clarity.
🔹 Charts on This Page:
-
Energy Consumption by Month – Track how power usage changes month-by-month.
-
Downtime by Month – Identify recurring downtime patterns.
-
Scrap Qty by Month – Find months with higher scrap and quality concerns.
These trends help management predict future production bottlenecks and optimize resource planning.
📦 What’s Inside the Dashboard?
-
5 professionally designed analysis pages
-
Page navigator on the left for easy navigation
-
Right-side slicers for dynamic filtering
-
KPI cards, pivot-based charts, and interactive visuals
-
Dedicated Data Sheet for entering production data
-
Support Sheet for lookup values
-
Clean, professional layout designed for everyday use
Everything updates automatically once you modify the Data Sheet.
🎯 Who Can Benefit from This Dashboard?
-
Glass manufacturing plants
-
Production managers
-
Quality & process engineers
-
Maintenance teams
-
Shift supervisors
-
Manufacturing analysts
-
Industrial consultants
If your goal is to reduce scrap, optimize energy, track downtime, or improve production flow—this dashboard is the perfect starting point.
💡 How to Use the Glass Manufacturing Dashboard in Excel
-
Enter all production data into the Data Sheet
-
Update product types, shifts, and plant names in the Support Sheet
-
Use slicers on each page to filter insights
-
Analyze daily, weekly, and monthly performance
-
Use the charts to identify gaps and improvement opportunities
-
Share the dashboard with internal teams for coordinated action
No complex setup required—just plug in your data and start analyzing!
### Click here to read the detailed blog post
📺 Visit our YouTube channel to learn step-by-step video tutorials
👉 youtube.com/@PKAnExcelExpert


Reviews
There are no reviews yet.