



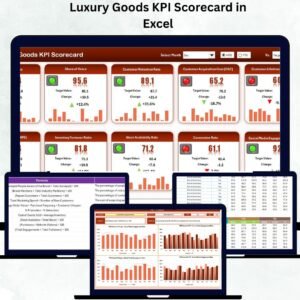
Managing a luxury brand means maintaining perfection across every detail — from craftsmanship and exclusivity to profitability and customer experience. The Luxury Goods KPI Scorecard in Excel is a powerful, ready-to-use performance tracking tool that enables luxury businesses to measure what truly matters.
Whether you manage a fashion house, jewelry brand, watch retailer, or high-end boutique, this Excel-based system gives you a 360° view of your sales, marketing, supply chain, and customer service performance — all within a single interactive file.
Built entirely in Microsoft Excel, this template delivers real-time insights through KPIs, charts, and automated comparisons, helping executives make fast, data-backed decisions without needing complex software or coding knowledge.
⚙️ Key Features of the Luxury Goods KPI Scorecard in Excel
📊 Four Main Sheets – Scorecard, KPI Trend, Input Data, and KPI Definition.
📅 MTD & YTD Analysis – Track performance month-to-date or year-to-date with dropdown filters.
🎯 Actual vs Target Tracking – Instantly compare goals against real results.
📈 Visual Indicators – Conditional formatting with arrows or traffic lights for instant clarity.
💡 KPI Trend Charts – Graphical analysis of performance patterns over time.
📘 Predefined KPI Library – Covers financial, operational, and marketing indicators.
⚙️ Auto-Refresh Calculations – Charts and metrics update automatically with new data.
🧩 Fully Customizable – Add or modify KPIs to match your luxury business model.
💻 No Technical Skills Required – Designed for simplicity and accessibility.
📤 Presentation-Ready Design – Ideal for management meetings or client reporting.
📂 What’s Inside the Luxury Goods KPI Scorecard
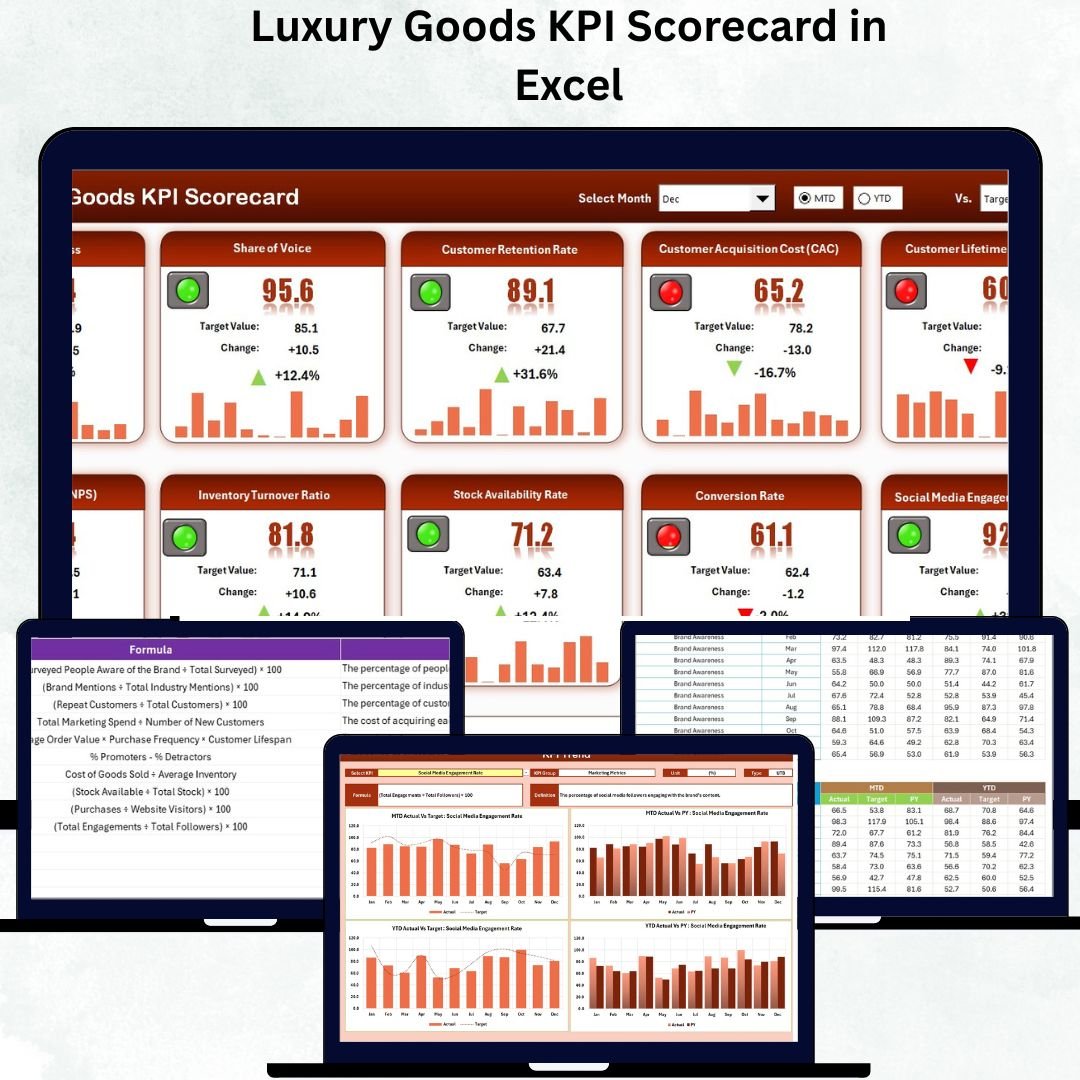
💼 1️⃣ Scorecard Sheet – Executive Dashboard
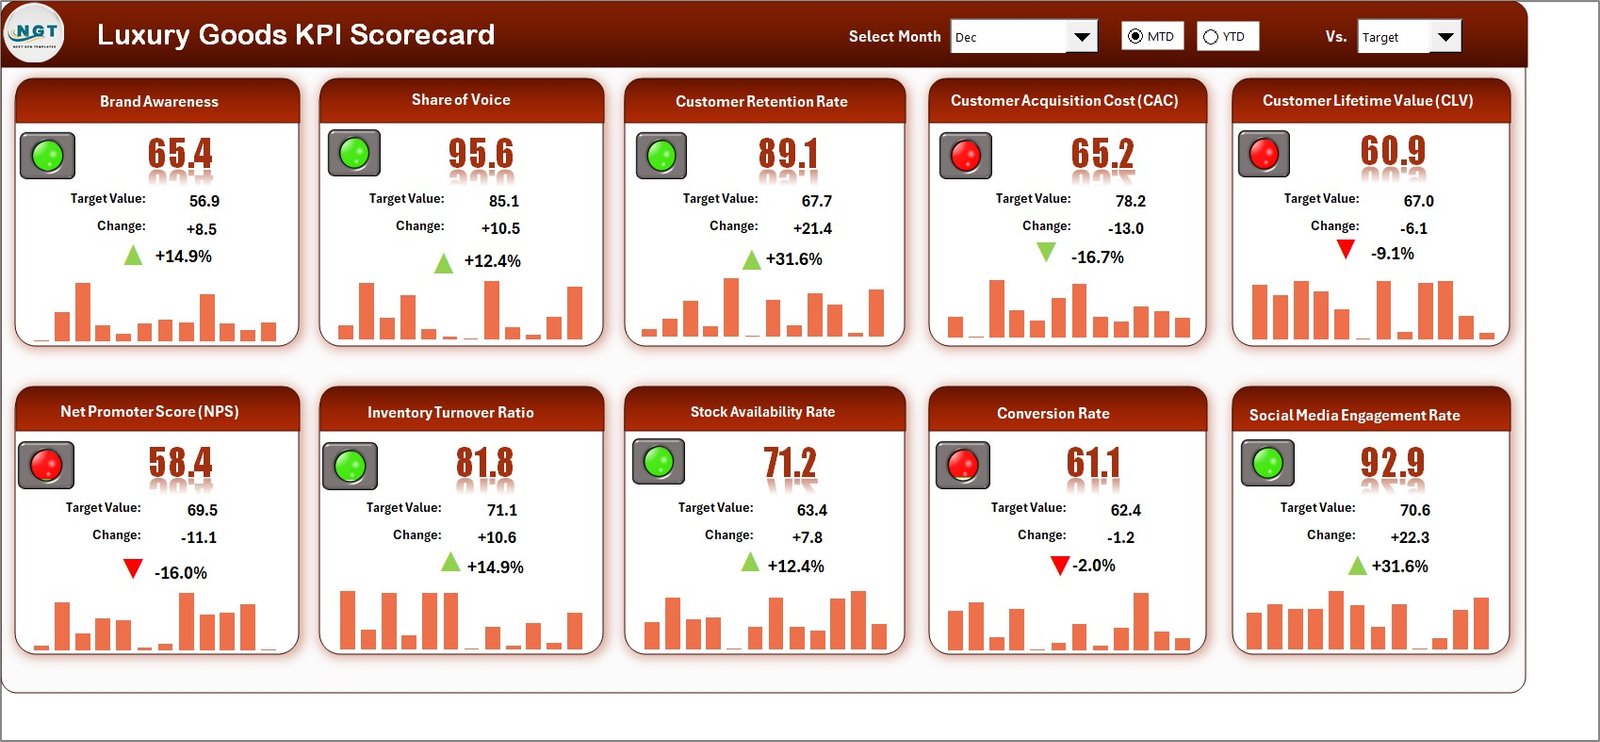
Your main control center for tracking brand performance.
Dropdown selectors for Month and Analysis Type (MTD/YTD).
Automatically updates KPI results and comparisons.
Visual indicators (green/red arrows) highlight performance status.
Displays Actual vs Target and Previous Year comparisons.
Example KPIs:
💰 Total Sales Revenue
💎 Average Transaction Value
📈 Gross Profit Margin
🛍️ Customer Retention Rate
🌍 Revenue per Region
This clean, visual layout helps executives instantly identify trends, gaps, and achievements.
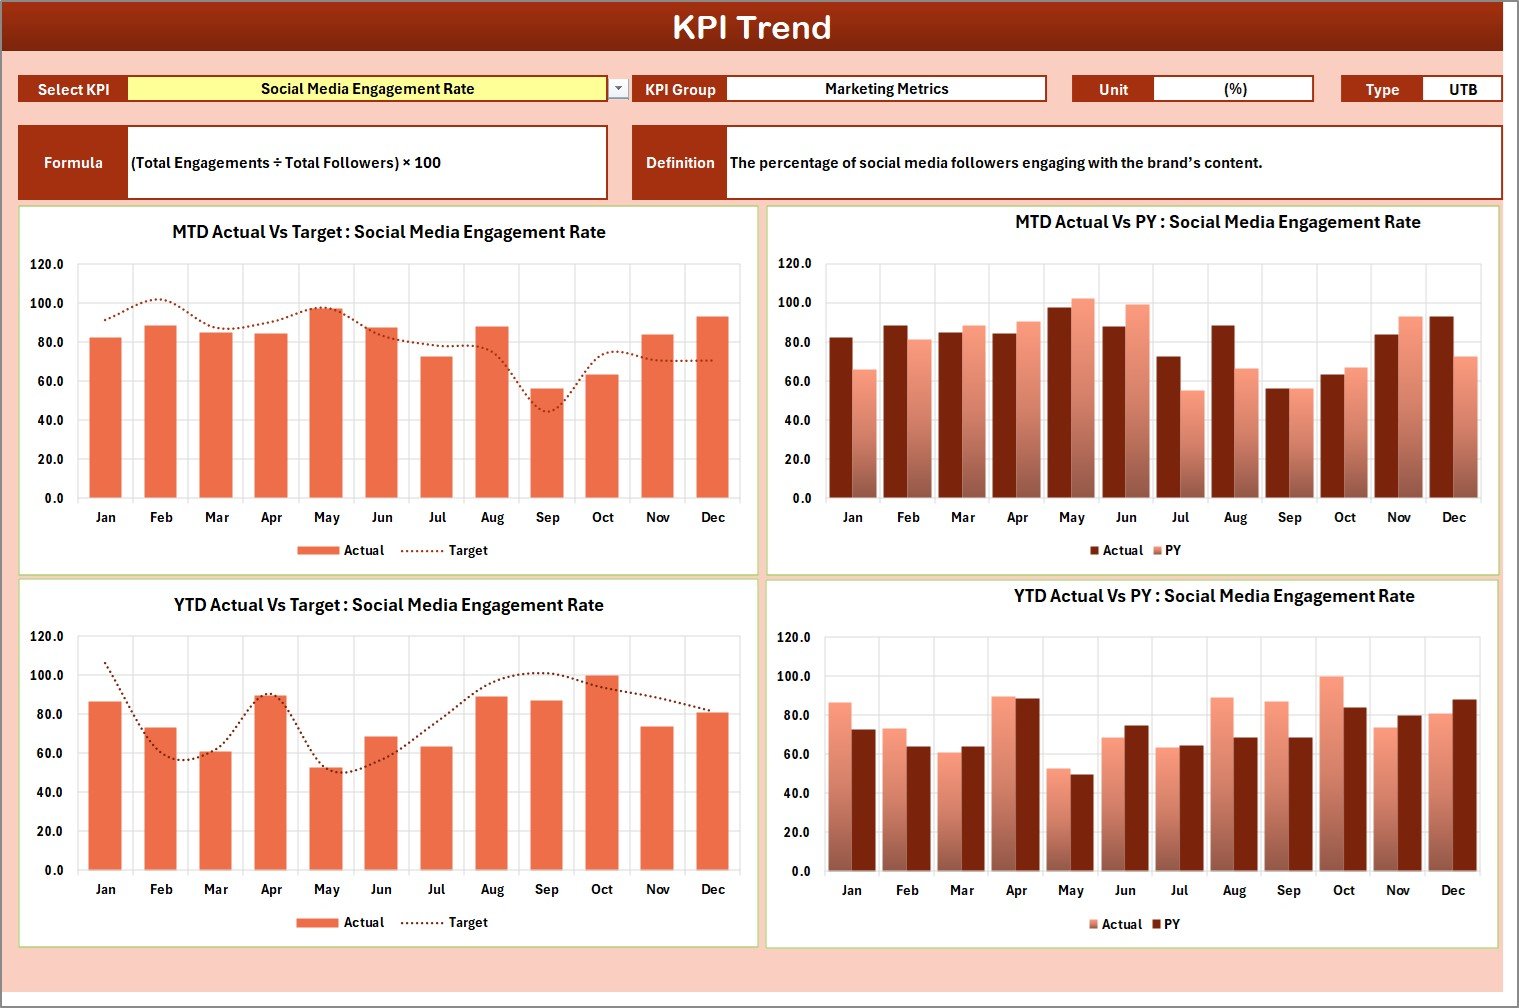
📊 2️⃣ KPI Trend Sheet – Deeper Performance Insights
Drill down into individual KPIs and monitor historical progress.
Dropdown (cell C3) to select any KPI for analysis.
Displays KPI Group, Unit, Formula, and Type (UTB/LTB).
Includes MTD and YTD trend charts comparing Actual, Target, and Previous Year.
📈 Ideal for identifying emerging patterns, forecasting future performance, and guiding strategic actions.
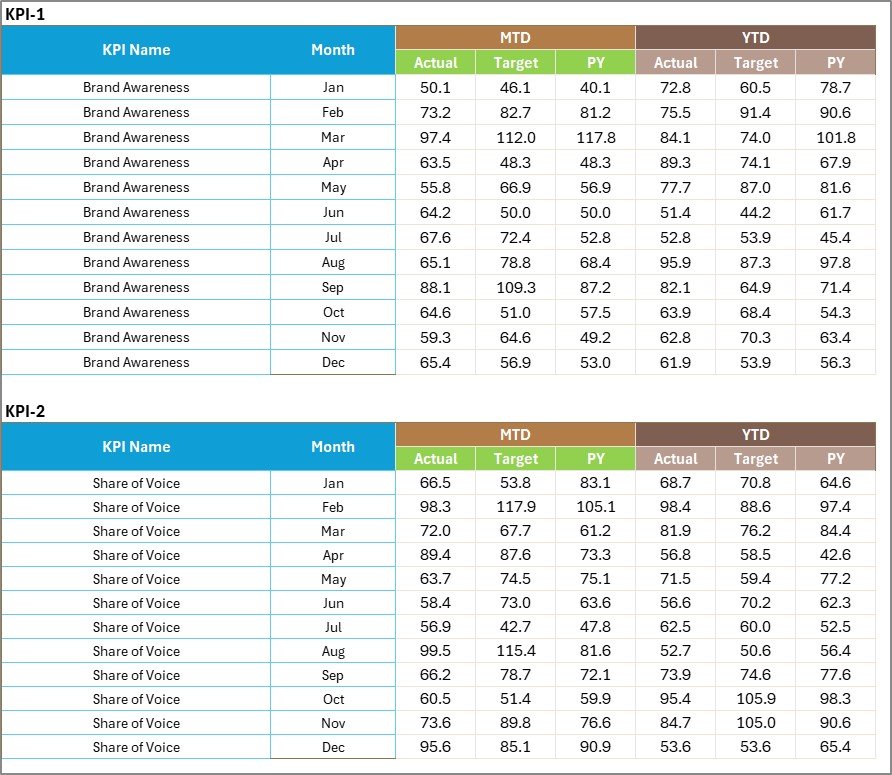
📋 3️⃣ Input Data Sheet – Data Management Hub
A simple and structured input area for your performance data.
Enter Actual, Target, and Previous Year values for each KPI.
Data auto-syncs with all visuals and dashboards.
Supports multiple departments (Sales, Marketing, Operations, Customer Service).
This ensures all reports stay accurate, consistent, and up-to-date.
📘 4️⃣ KPI Definition Sheet – Reference & Standardization
Ensures every team member understands each KPI clearly.
Includes fields for:
KPI Name
Group
Unit
Formula
Definition
Type (Upper or Lower the Better)
By maintaining this sheet, luxury brands ensure transparency, clarity, and alignment across global teams.
💡 Examples of KPIs Tracked in the Luxury Industry
Sales & Revenue: Total Sales, Sales Growth %, Gross Profit Margin, Revenue per Store.
Customer Experience: Retention Rate, Repeat Purchase %, Net Promoter Score (NPS).
Marketing: Campaign ROI, Brand Engagement Rate, Customer Acquisition Cost.
Operations: Inventory Turnover, Stock-out Rate, Order Fulfillment Time.
Financials: Operating Profit Margin, Return on Assets (ROA), Return on Equity (ROE).
These KPIs deliver a holistic view of luxury business performance — from boutique experience to bottom-line profitability.
🌟 Advantages of the Luxury Goods KPI Scorecard in Excel
✅ All-in-One Dashboard – Consolidates sales, marketing, and customer KPIs in one place.
✅ Faster Decisions – Auto-updating visuals for real-time strategy refinement.
✅ Visual Simplicity – Clear color-coded design for executive-level clarity.
✅ Accountability – Assign KPIs by department for better ownership.
✅ Full Flexibility – Add new KPIs, adjust formulas, or expand categories easily.
✅ Cost-Efficient Solution – No expensive BI software required.
✅ Collaboration Ready – Share via email or cloud for team access.
🧠 Best Practices for Effective KPI Tracking
📌 Align KPIs with strategic objectives.
📌 Update data monthly to maintain accuracy.
📌 Validate data sources before inputting.
📌 Use consistent units and naming conventions.
📌 Focus on 10–15 key metrics for clarity.
📌 Review results quarterly to refine business goals.
📌 Keep visuals simple and meaningful.
👑 Who Can Benefit from This Scorecard
💼 Luxury Brand Managers – Track sales, quality, and customer loyalty.
🏬 Retail Executives – Monitor profitability and store performance.
📊 Data Analysts – Study trends across multiple product lines.
🧵 Fashion Houses & Boutiques – Measure market reach and client retention.
💎 Jewelry & Watch Brands – Evaluate high-ticket sales and conversion ratios.
🔗 Click here to read the Detailed Blog Post
📺 Visit our YouTube Channel for step-by-step video tutorials.
Watch the step-by-step video tutorial:
Compatibility and Requirements
- Works in Microsoft Excel desktop (Excel 2016 or later, or Microsoft 365).
- You pick the month and the MTD or YTD view from dropdowns on the Scorecard sheet. Microsoft explains dropdown lists in Create a drop-down list.
Frequently Asked Questions
Which sheets are included?
Four sheets: Scorecard, KPI Trend, Input Data and KPI Definition.
How do I update the scorecard?
Enter your Actual, Target and Previous Year values for each KPI in the Input Data sheet. Then choose a month and MTD or YTD on the Scorecard sheet and the results update.
How do I see the trend for one KPI?
Open the KPI Trend sheet and pick a KPI from the dropdown in cell C3. It shows the KPI group, unit, formula and type (UTB or LTB), plus MTD and YTD charts comparing Actual, Target and Previous Year.
Can I add my own KPIs?
Yes. The template is fully customizable, so you can add or change KPIs to match your luxury business. Record each one in the KPI Definition sheet with its group, unit, formula, definition and type.
Is there a Google Sheets or Power BI version?
There is a Luxury Goods KPI Scorecard in Google Sheets. For dashboards, see the Luxury Goods KPI Dashboard in Excel and the Luxury Goods KPI Dashboard in Power BI.
Related Luxury and KPI Scorecard Templates
- Luxury Goods KPI Scorecard in Google Sheets: the same scorecard for Google Sheets
- Luxury Goods KPI Dashboard in Excel: a dashboard view of luxury KPIs
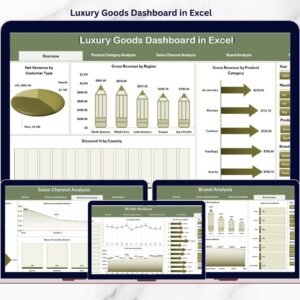
- Luxury Goods Dashboard in Excel: another Excel dashboard for luxury brands
- Luxury Travel KPI Scorecard in Excel: a scorecard for the luxury travel sector
- Retail KPI Scorecard in Excel: a scorecard for general retail
Browse all Excel KPI dashboards.

















Reviews
There are no reviews yet.